Marine Weather Review - North Pacific Area
January to April 2004
By George P. Bancroft, National Center for Environmental Prediction
Introduction
The most active period of winter storms was January through the middle of March, when low-pressure systems tracked east and northeast off Japan toward Alaska and occasionally taking northward turns into the Bering Sea where they weakened. Most of the hurricane-force events occurred during this period. The pattern became more variable in March and April with blocking becoming more frequent. The period from late March through April featured two hurricane-force storms, one in the eastern Pacific in late March and the other in the northwest Pacific and western Bering Sea, with both described in this summary. Tropical cyclones are relatively infrequent this time of year, with activity picking up as the year progresses. One such system, Sudal, occurred in April and is also described below.
Tropical Activity
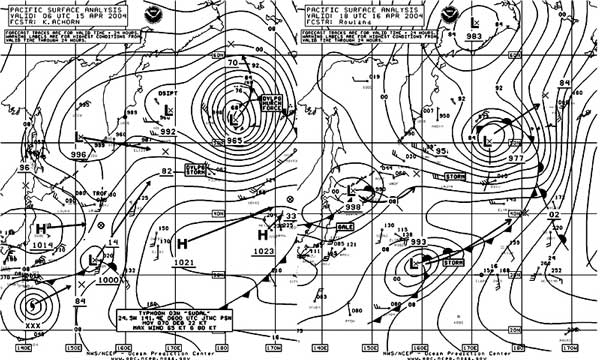 |
Figure 1. OPC North Pacific Surface Analysis charts (Part 2) valid 0600 UTC April 15 and 1800 UTC April 16, 2004. Typhoon Sudal is shown becoming an extratropical storm. |
| Back to Northwest Pacific and Bering Sea Storm of April 8-11 |
Typhoon Sudal: Sudal appeared about 700 nmi south of Japan on OPCs oceanic analysis charts as a typhoon early on April 14 with maximum sustained winds of 105 kt and gusts to 130 kt. By 1200 UTC April 15 Sudal weakened to a tropical storm near 25N 143E with maximum winds of 55 kt and gusts to 70 kt, and then became extratropical six hours later while merging with a frontal zone. Figure 1 depicts Sudal becoming an extratropical storm over a 36-hour period, about to enter OPCs high seas area of responsibility (see Reference.) Ship data was sparse and mainly around the periphery of the storm, but QuikSCAT scatterometer data about the time of the second part of Figure 1 indicated a small area of storm force winds up to 60 kt just north of the center. The cyclone then gradually weakened while tracking northeast, becoming a gale-force low near the dateline at 1800 UTC April 17. A ship, Niitaka Maru (JBGY), reported a southwest wind of 40 kt near 36N 180 at that time. The system re-intensified into a storm twenty-four hours later while crossing 150W, and developed a central pressure down to 973 hPa near 50N 147W at 0000 UTC on the 19th. The cyclone then weakened while turning more southeast, and dissipated near the Oregon coast on the 21st.
Other Significant Events
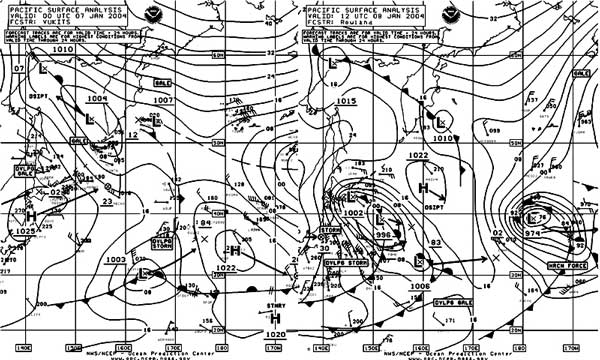
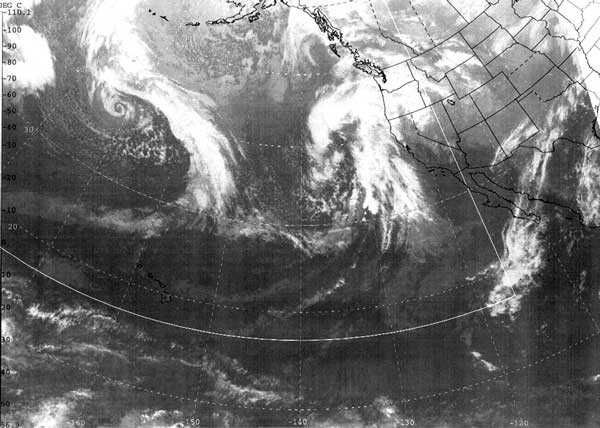
North Pacific Storm, January 79: The first half of January was quite active, with several lows developing hurricane-force winds while moving over the western and central North Pacific, near the latitude of Japan. The first of these is shown in Figure 2, developing rapidly from a frontal wave well southeast of Japan over a thirty-six hour period to become a hurricane-force storm near the dateline. QuikSCAT data available at 1800 UTC January 8 south of the center showed winds to 65 kt, and is not shown here (see Figure 9 for a similar event in mid-March in that same area). Some notable ship reports in this storm are tabulated in Table 1, including multiple reports from the same ship. The central pressure reached 971 hPa near 38N 172W at 0000 UTC January 9 before the system began to weaken, becoming a gale near 40N 147W thirty-six hours later before turning north. Figure 3 is a GOES-9 infrared image showing the storm fully developed and at maximum intensity, with a well-defined cloud spiral marking the center. Western North Pacific Storm of January 811: Another storm immediately following the one above took a more east-southeast track off northern Japan by early on the 8th (second part of Figure 2), and developed hurricane-force winds briefly early on the 10th. The Star Eagle (LAWO2) encountered north winds of 65 kt near 36N 167E at 1200 UTC January 10, while the vessel Port Said Senator (DQVN) reported west winds of 50 kt down near 31N 164E. The lowest central pressure was 976 hPa when the center was at 36N 171E six hours later. The cyclone then turned more northeast and weakened to a gale near 41N 170W early on the 12th, before elongating and turning north into Southeast Alaska on the 14th.
| OBSERVATION | POSITION | DATE/TIME(UTC) | WIND | SEAS(m/ft) |
| Star Eagle
(LAW02) |
35 N 177 E | 08/0000 | N W 55 | 10.0/33 |
| SeaLand Explorer
(WGJF) |
42 N 179 E | 08/0000 | E 50 | 13.0/42 |
| APL Tourmaline | 36 N 178 E | 08/0600 | W 50 | 12.5/41 |
| Star Eagle
(LAW02) |
35 N 177 E | 08/0600 | W 50 | 9.0/30 |
| SeaLand Explorer
(WGJF) |
42 N 175 W | 08/0600 | E 60 | 8.0/27 |
| SeaLand Explorer
(WGJF) |
42 N 179 W | 08/1200 | NE 60 | 15.5/51 |
Table 1. Some notable ship observations in the storm of January 7-9.
|
|
North Pacific Storm of January 1016: This storm developed quickly after moving east of northern Japan on January 10. By 0600 UTC January 11 the center was at 42N 149E with a 993 hPa central pressure. The APL Philippines (WCX8884) encountered northwest winds of 60 kt near 38N 147E at that time. The system tracked initially east-southeast through the 13th, before turning northeast and deepening to 968 hPa near 42N 157W at 0600 UTC January 15. OPC classified the storm as hurricane-force at that time, before the system expanded in area and winds weakened to gale force late on the 16th. The weakening low moved into Alaska on the 18th.
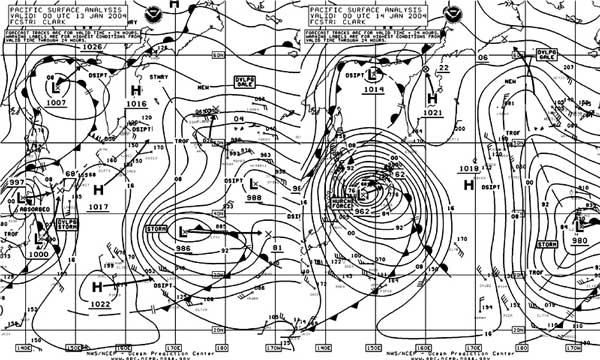 |
Figure 4. OPC North Pacific Surface Analysis charts (Part 2) valid 0000 UTC January 13 and 14, 2004. |
Western North Pacific Storm of January 1317: This cyclone was a rapid deepener with much of the intensification occurring just east of Japan. A warm ocean current, the Kuroshio, often aids the rapid development of lows passing through this area. Figure 4 depicts the development with the merger of two lows with the central pressure dropping 35 hPa in the twenty-four hour period ending at 0000 UTC on the 14th. The Swift Arrow (C6NI7) reported a northwest wind of 65 kt near 42N 146E, just west of the center, at 0000 UTC January 14, while the Ming Dynasty (P3BA7) encountered east winds of 55 kt at 45N 150E. The system then moved east and expanded, with winds weakening to gale force at 0000 UTC January 19 with the center passing 46N 175W. The center then stalled near the dateline, becoming a large gale with central pressure as low as 961 hPa at 1200 UTC on the 19th. The system developed secondary storm centers to the east, passing north into the Gulf of Alaska on the 20th. The system as a whole weakened into multiple centers sprawled across the area north of 50N east of the dateline late on January 21.
North Pacific Storms, February 714: The first storm in the series developed south of a complex area of low pressure in the Aleutians, near 40N 177W at 0000 UTC on the 7th, and tracked northeast toward the eastern Aleutians in the next twenty-four hours before weakening in the Bering Sea late on the 8th. The central pressure was as low as 956 hPa near 53N 162W at 0600 UTC February 8, when OPC analyzed it as a hurricane-force storm. The highest wind report from a ship was a southwest wind of 50 kt from Singapore Bay (MRGU3) near 54N 157W at 1200 UTC on the 8th. Three other storms followed through the 14th, taking similar tracks but not quite as intense, with the second passing south of Kodiak Island early on the 10th before weakening near the southwest Alaska coast at 0000 UTC February 11. The CSX Tacoma (KGTY) reported an east wind of 60 kt near 57N 150W at 0600 UTC on the 10th.
Western North Pacific Storm of February 1419: This system crossed northern Japan as a storm on the 14th and gradually deepened but with its circulation expanding in area. The center deepened from 982 hPa near northern Japan at 0000 UTC on the 15th to 966 hPa near 41N 157E twenty-four hours later. By 0600 UTC February 17 the central pressure bottomed out at 950 hPa near 44N 178E. This was the lowest pressure attained by any low in the North Pacific during the four-month period. The highest winds with the large circulation occurred in secondary lows east of the main center. The Providence Bay (MSTM6) and the Colombo Bay (MTFH5) encountered southwest winds of 60 kt, at 1800 UTC on the 18th near 36N 175W and at 1800 UTC on the 19th near 48N 155W, respectively. These were the highest observed winds. The circulation covered much of the North Pacific by the 18th. The main center then moved south of the Aleutians and dissipated south of the Gulf of Alaska on February 22.
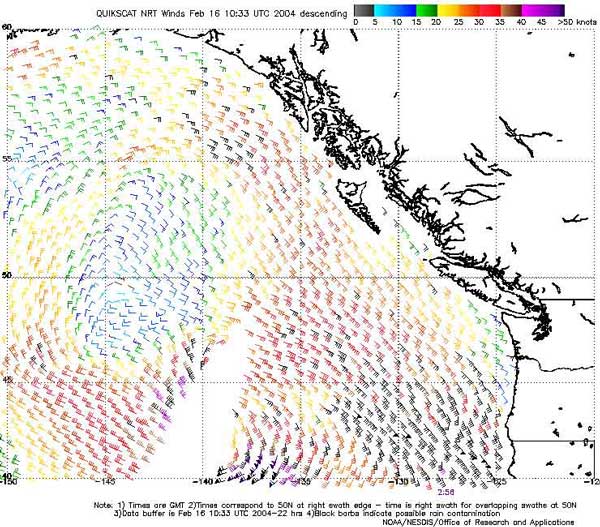
Eastern North Pacific and Offshore Storm of February 1517: The rapid development of this hurricane-force storm is depicted in Figure 5. The central pressure dropped an impressive 39 hPa in the twenty-four hour period ending at 0600 UTC February 16, with the central pressure lowering further to 958 hPa 450 nmi west of Vancouver Island at 0000 UTC on the 17th. The Kauai (WSRH) reported southeast winds of 60 kt near the Oregon Coast at 0600 UTC on the 16th (Figure 5), and the ship CSX Reliance (WFLH) encountered east winds of 50 kt at 49N 127W six hours later. The moored buoy 46006 (40.8N 137.5W) reported a west wind of 60 kt with gusts to 76 kt and 9.0m seas (30 ft) at 0500 UTC February 16. The maximum significant wave height was 11.0 m (36 ft) two hours later. A QuikSCAT image taken near this time (Figure 6) reveals hurricane-force winds southeast of the center, up to 70 kt. This storm was the deepest in this part of the Pacific during the period and had the highest rate of intensification. The storm subsequently weakened, and dissipated over Southeast Alaska on the 18th.
|
|
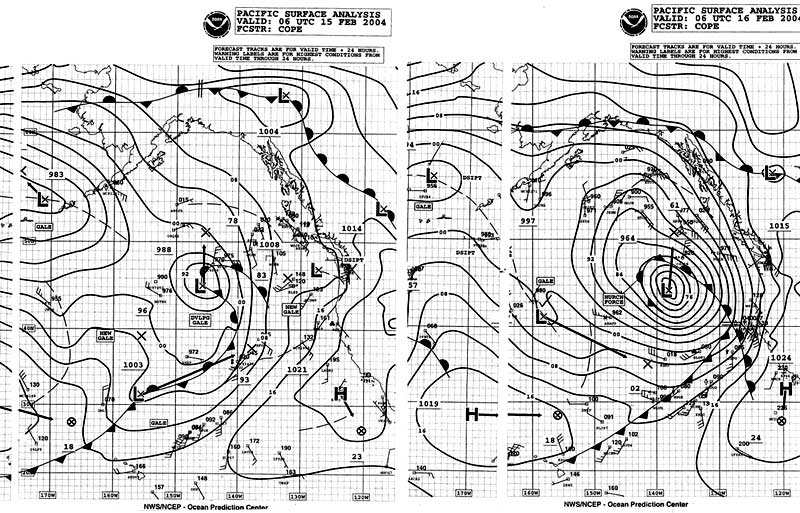
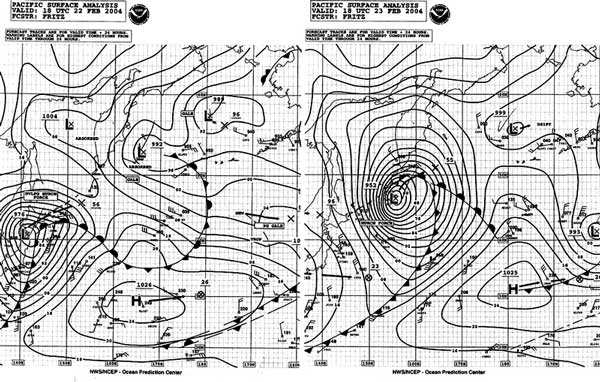 |
Figure 7. OPC North Pacific Surface Analysis charts (Part 2) valid 1800 UTC February 22 and 23, 2004. |
Northwestern North Pacific Storms of February 2228: The storm depicted in Figure 7 was one of the deepest of the period. It developed a tight pressure gradient (close packing of isobars) west of the center similar to the January 1317 storm but farther north, near the Kurile Islands. The central pressure remained in the 950s as the center passed southeast of the Kamchatka Peninsula through the 24th. The Zim Italia (4XGT) reported northwest winds of 60 kt near 47N 153E at 0000 UTC February 24. Six hours later, the SeaLand Endurance (KGJX) and the CSX Liberator (KHRP) encountered northwest winds of 60 kt near 38N 158E and 46N 153E, respectively. The storm later weakened to a gale in the northwest Bering Sea by the 26th. A second storm followed a similar track and was almost as intense, developing a central pressure of 955 hPa near 50N 159E at 1200 UTC February 27. At that time the vessel APL Thailand (WCX8882) reported northeast winds of 60 kt near 51N 157E. At 0000 UTC on the 28th, the OOCL Singapore (VRVL2) experienced northwest winds of 65 kt near 47N 153E. The ship Westwood Columbia (C6SI4) reported 13.5m seas (44 ft) along with northeast winds of 50 kt near 50N 159E at 1800 UTC February 27. The storm then developed multiple centers while weakening to a gale just south of the western Aleutians by the 29th, before moving into the Bering Sea on March 1.
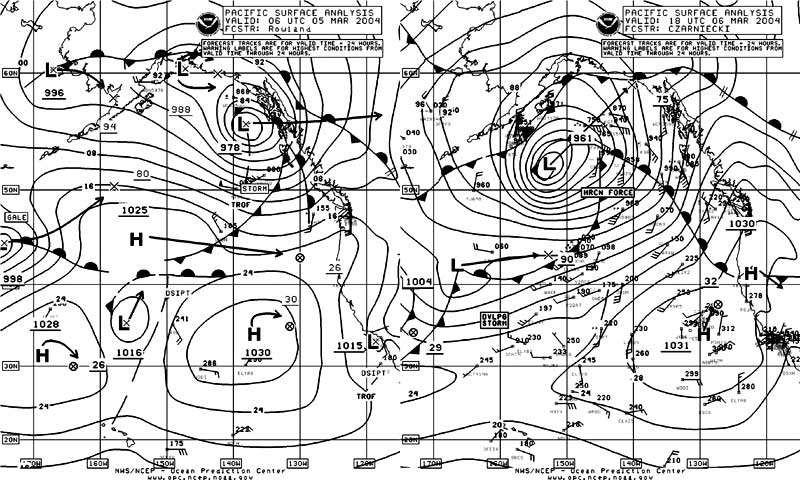 |
Figure 8. OPC North Pacific Surface Analysis charts (Part 1) valid 0600 UTC March 5 and 1800 UTC March 6, 2004 Analysis charts (Part 2) valid 1800 UTC February 22 and 23, 2004. |
Northeast Pacific Storm of March 68: The month of March featured three main events, with the first originating southeast of Japan at 0000 UTC March 4. The deepening low moved rapidly northeast, becoming a storm early on March 6 upon crossing 50N, and then a hurricane-force storm with a central pressure as low as 961 hPa 300 nmi south of Kodiak Island at 1800 UTC March 6. Figure 8 shows the development of this system over a 36-hour period, including a twenty-four hour period ending at 1200 UTC on the 6th when the central pressure dropped 26 hPa. There was a ship observation with hurricane-force winds at 0600 UTC March 7, when the Saga Horizon (VRUZ9) reported west-southwest winds of 65 kt near 52N 143W. The ship A8CN7 to the east encountered 9.5m seas (31 ft) along with south winds of 40 kt near 54N 136W at that time. The same ship six hours later reported southwest winds of 55 kt at 53N 136W. The cyclone then continued on a northeast track and weakened onshore on the Alaska coast as the 24-hour forecast track in Figure 8 indicated.
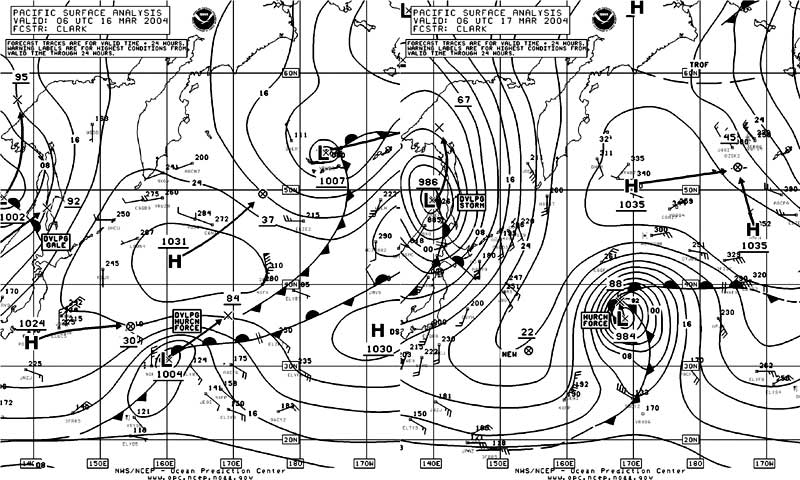
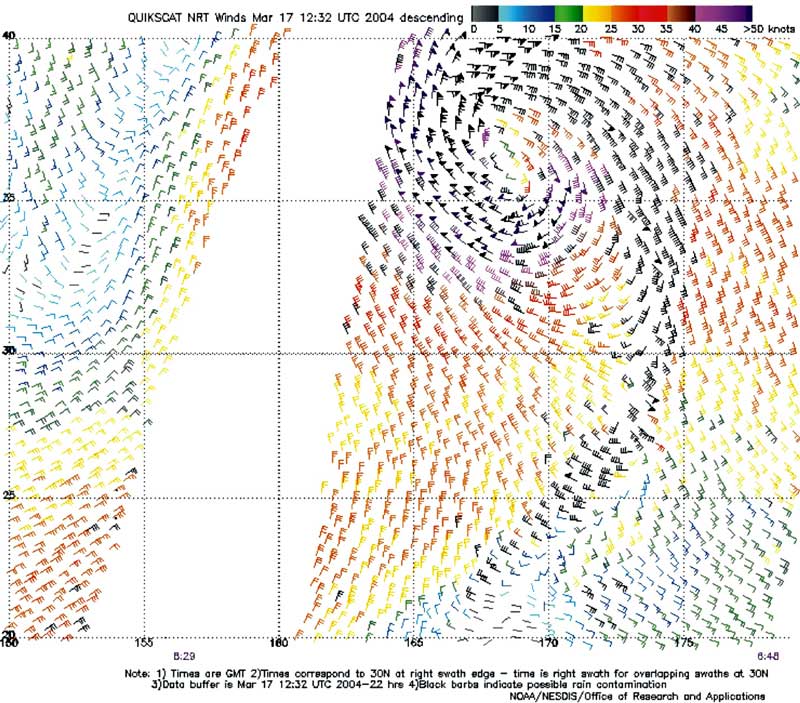
Southwest North Pacific Storm, March 1618: This major storm formed relatively far south, originating from a frontal wave of low pressure southwest of OPCs high seas area of responsibility. The southwest corner of the high seas area is at 30N 160E. Figure 9 displays the period of most rapid development, when the central pressure dropped 20 hPa in twenty-four hours. Forming in a high-pressure environment, the storm developed hurricane-force winds even though the lowest central pressure was only 982 hPa, reached at 1800 UTC March 17. With ship data lacking in this area, the QuikSCAT data in Figure 10 valid close to the time of the second part of Figure 9 reveals numerous 60 kt wind barbs around the north, west and south sides and even a few 65 kt barbs. Building high pressure to the north and east caused the low to stall on the 17th , weaken to a gale-force low on the 18th, and then begin a northwestward drift by March 19.
|
|
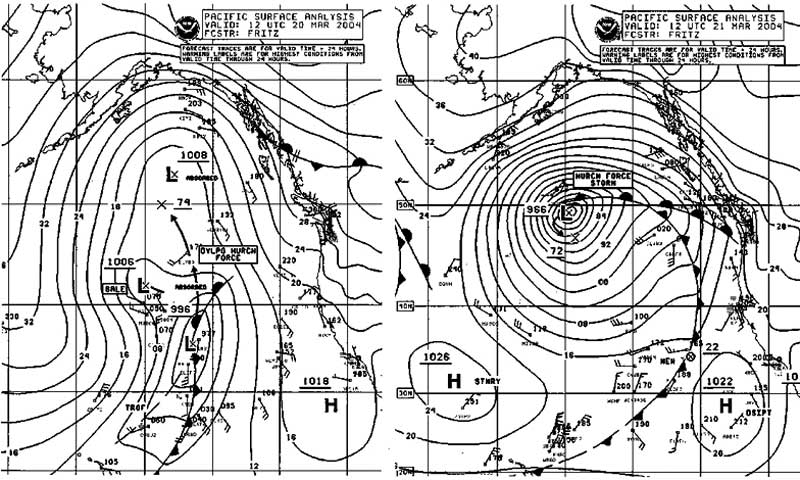
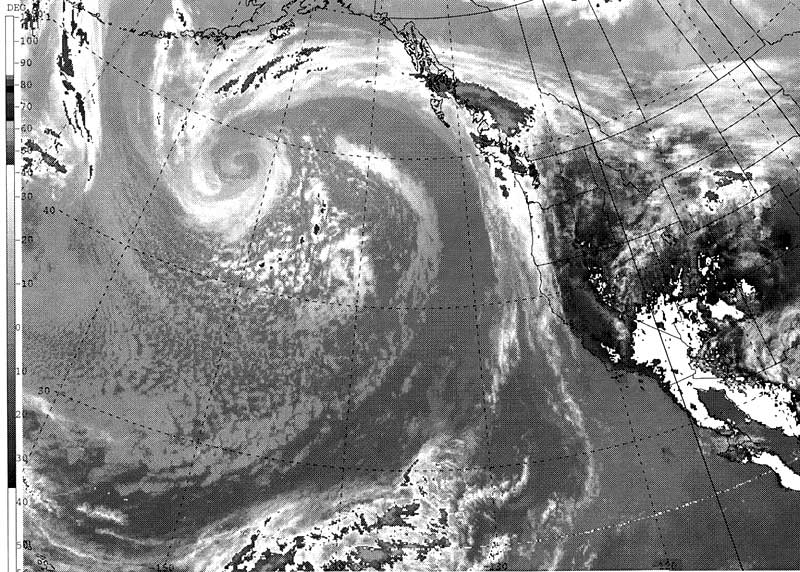
Eastern North Pacific Storm of March 2022: This developing storm originated near Hawaii and rapidly intensified while tracking north on March 20. Figure 11 shows the period of most rapid intensification. The second part of Figure 11 shows the storm at maximum intensity. Strong high pressure to the north blocked the storm, forcing it to slow and make a loop to the southwest and then east. Figure 12 is a GOES-10 infrared satellite image of the storm near maximum intensity. Enhancement of colder temperatures reveals the higher, colder cloud tops in the frontal band, and there is a pronounced cloud spiral around the center. Table 2 lists some notable ship and buoy observations in this storm. The system then weakened while drifting east along 47N and weakened to a gale late on March 22, and became absorbed by another low moving from the south by the 25th.
| OBSERVATION | POSITION | DATE/TIME(UTC) | WIND | SEAS(m/ft) |
| APL China
(WDB3161) |
51 N 152 E | 21/1200 | NE 57 | |
| Westwood Borg
(LAON4) |
54 N 161 E | 21/1200 | NE 54 | |
| Buoy 46066 | 52.7 N 155 E | 21/1600 21/2000 |
NE 43 G52
Peak gust 60 |
10.0/33 12.4/41 |
| Westwood Borg
(LAON4) |
54 N 158 E | 22/0600 | NE 45 | 13.0/43 |
| OOCL France
(A8AV9) |
40 N 154 W | 22/0600 | NW 45 | 10.5/35 |
| APL China
(WDB3161) |
50 N 163 W | 22/1200 | N 40 | 10.5/35 |
Table 2. Some ship and buoy observations taken in the eastern Pacific storm of March 20-22, 2004.
|
|
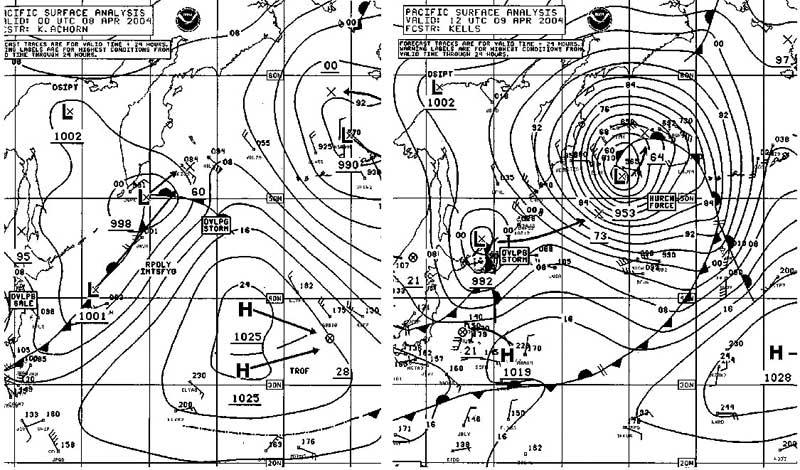 |
Figure 13. OPC North Pacific Surface Analysis charts (Part 2) valid 0000 UTC April 8 and 1200 UTC April 9, 2004. |
Northwest Pacific and Bering Sea Storm of April 811: There was one hurricane-force storm in April, a rapid developer forming from the merger of two lows on a southwest-to-northeast frontal zone as shown in Figure 13. The central pressure dropped 39 hPa in the twenty-four hour period ending at 0000 UTC April 9, the same as in the February 1517 storm in the eastern North Pacific. The storm became the second deepest of the period, attaining a 952 hPa central pressure near 53N 173E at 1800 UTC on the 9th. QuikSCAT remotely-sensed winds available at the time showed winds to 65 kt west and southwest of the center (not shown). The Westwood Borg (LAON4) encountered southeast winds of 45 kt and 10.5 m seas (34 ft) near 56N 177E at 1200 UTC April 9. Six hours later, the ship Hansa Visby (ELWR5) near 53N 164E reported northwest winds of 40 kt and 14.5 m seas (47 ft). Later, the Polar Eagle (ELPT3) near 47N 159E reported west winds of 50 kt at 0600 UTC April 11. The system stalled in the southwest Bering Sea by then and began to weaken. Figure 1 (first part) shows its remnant low dissipating there early on the 15th.
Reference
Bancroft, G. and Sienkiewicz, J., High Seas Text Bulletins Issued by MPC (Mariners Weather Log, Summer 1996).
Page last modified: