An Overwater Relationship Between the Gust Factor and the Exponent of Power-Law Wind Profile
Professor S. A. Hsu, Louisiana State University, email: sahsu@lsu.edu
According to Hsu (2003) the exponent of power-law wind profile (Hsu et al., 1994) and the gust factor during storms at sea are related via the following formulations:
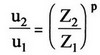 (1)
(1)and
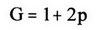 (2)
(2)where u1 and u2 are the wind speeds at elevations Z1 and Z2, respectively, p is the exponent of powerlaw wind profile, and G is the gust factor which is defined as the ratio of wind speed and peak gust related to u1 at Z1.
While Eq.(2) has been verified during storms by Hsu (2006a), it is the purpose of this article to further evaluate Eq.(1).
From 05 UTC 28 November to 16 UTC 29 November 2003 simultaneous measurements of all parameters (except p) needed in Eqs.(1) and (2) were made at the National Data Buoy Center (NDBC) moored buoy 41013 and Coastal Marine Automated Network (C-MAN) station FPSN7 off the North Carolina coast (see www.ndbc.noaa.gov/maps/ Southeast.shml/). The data are listed in Table 1.
In order to ensure that stability was near neutral, measurements of air and sea temperatures were also employed. According to the formulas provided in Hsu and Blanchard (2004, Eqs. (11) and (12) for unstable and stable, respectively), the Monin-Obukhov length (L) was computed for each hour. The results are also listed in Table 1. Since the absolute values of L are larger than 25 (see Hanna et al., 1985, and Hsu, 1992), we can say that during this period the atmospheric stability was near neutral.
Now, setting Z1 = 5 m and Z2 = 44.2 m and the applying the corresponding wind speeds for u1 and u2, the exponent p can be calculated by taking the natural logarithm on both sides of Eq.(1) (Hsu et al., 1994). These values are shown in the last column in Table 1. Since the mean G = 1.25 with corresponding p = 0.126, it is concluded that both Eqs.(1) and (2) are verified. Note that during high winds, the mean value of G is also 1.25 (see Hsu, 2006a). This result further supports the notion that p=0.125 as employed by Hsu (2006b) is a good operational value.
References
Hanna, S. R., Schulman, L. L., et al., 1985. Development and evaluation of the Offshore and Coastal Dispersion Model. J. Air Poll. Contr. Assoc. 35, pp. 1039-1047.
Hsu, S. A., (1992). An overwater stability criterion for the Offshore and Coastal Dispersion Model. Boundary-Layer Meteor. 60, pp. 397-402.
Hsu, S. A., (2003). Estimating overwater friction velocity and exponent of power-law wind profile from gust factor during storms. Journal of Waterway, Port, Coastal, and Ocean Engineering, July/August 2003, 129(4), pp. 174-177.
Hsu, S. A., (2006a). Measurements of overwater gust factor from NDBC buoys during hurricanes. 2006-EJ2, 2006, in www.nwas.org/ef/index.html
Hsu, S. A., (2006b). Estimating the wind speed during a hurricane at sea. Mariners Weather Log, 50(3), December 2006, pp. 8-9.
Hsu, S. A., and Blanchard, B. W., 2004. On the estimation of overwater buoyancy length from routine measurements. Environmental Fluid Mechanics, 4, pp. 443-449.
Hsu, S. A., Meindl, E. A., and Gilhousen, D. B., 1994. Determining the power-law wind profile exponent under near-neutral stability conditions at sea. J. Applied Meteor., 33(6), pp. 757-765.
Table 1. Using simultaneous wind speed measurements at 5 and 44.2 m from NDBC buoy 41013 and C-MAN FPSN7 to validate Eqs. (1) and (2).
| yy | mm | dd | hh | u5 | G5 | Tair | Tsea | u44.2 | L | L | Gust | Exponent |
|---|---|---|---|---|---|---|---|---|---|---|---|---|
| 2003 | 11 | 28 | 5 | 6.8 | 11.6 | 23.7 | 24.3 | 9.2 | -142 | 1.71 | 0.139 | |
| 2003 | 11 | 28 | 6 | 7.3 | 8.5 | 23.5 | 24.3 | 8.9 | -129 | 1.16 | 0.091 | |
| 2003 | 11 | 28 | 7 | 8.2 | 9.6 | 24.3 | 24.3 | 10.6 | neutral | 1.17 | 0.118 | |
| 2003 | 11 | 28 | 8 | 7.7 | 9.3 | 24.2 | 24.2 | 10.3 | neutral | 1.21 | 0.134 | |
| 2003 | 11 | 28 | 9 | 7.8 | 9.3 | 24.2 | 23.8 | 9.6 | 730 | 1.19 | 0.095 | |
| 2003 | 11 | 28 | 10 | 8.3 | 9.5 | 24.2 | 23.7 | 11.3 | 661 | 1.14 | 0.142 | |
| 2003 | 11 | 28 | 11 | 8.5 | 9.6 | 24.2 | 23.8 | 10.9 | 886 | 1.13 | 0.114 | |
| 2003 | 11 | 28 | 12 | 8.2 | 10.2 | 24.3 | 23.8 | 10.4 | 645 | 1.24 | 0.109 | |
| 2003 | 11 | 28 | 13 | 8.7 | 10 | 24.3 | 24.2 | 11.8 | 3632 | 1.15 | 0.14 | |
| 2003 | 11 | 28 | 14 | 10.3 | 12.3 | 24.3 | 24.2 | 14.1 | 5091 | 1.19 | 0.144 | |
| 2003 | 11 | 28 | 15 | 11 | 13 | 24.5 | 24.2 | 15.1 | 1937 | 1.18 | 0.145 | |
| 2003 | 11 | 28 | 16 | 12.2 | 14.3 | 24.5 | 24.2 | 14.7 | 2382 | 1.17 | 0.086 | |
| 2003 | 11 | 28 | 17 | 10.7 | 13 | 24.1 | 24.2 | 13.7 | -1372 | 121 | 0.113 | |
| 2003 | 11 | 28 | 18 | 10.4 | 12.7 | 24.2 | 23.9 | 14.9 | 1729 | 1.22 | 0.165 | |
| 2003 | 11 | 28 | 19 | 11.5 | 13.9 | 24.1 | 23.8 | 13.6 | 2114 | 1.21 | 0.077 | |
| 2003 | 11 | 28 | 20 | 12.2 | 15.3 | 24.5 | 24.2 | 17.5 | 2382 | 1.25 | 0.166 | |
| 2003 | 11 | 28 | 21 | 13.3 | 17.2 | 24.8 | 24.2 | 19.2 | 1417 | 1.29 | 0.169 | |
| 2003 | 11 | 28 | 22 | 13.9 | 18.2 | 24.7 | 24.2 | 19.4 | 1857 | 1.31 | 0.153 | |
| 2003 | 11 | 28 | 23 | 15 | 19.6 | 24.7 | 24.1 | 20.2 | 1802 | 1.31 | 0.137 | |
| 2003 | 11 | 29 | 0 | 16.8 | 22.2 | 25 | 23.8 | 23.2 | 1131 | 1.32 | 0.148 | |
| 2003 | 11 | 29 | 1 | 15.6 | 19.3 | 17.7 | 23.8 | 23.4 | -97 | 1.24 | 0.186 | |
| 2003 | 11 | 29 | 2 | 17.1 | 21.1 | 17.6 | 23.8 | 25 | -115 | 1.23 | 0.174 | |
| 2003 | 11 | 29 | 3 | 16.5 | 20.8 | 14.4 | 23.7 | 21.6 | -73 | 1.26 | 0.124 | |
| 2003 | 11 | 29 | 4 | 15.1 | 19.7 | 14 | 23.7 | 21 | -58 | 1.3 | 0.151 | |
| 2003 | 11 | 29 | 5 | 14.2 | 17.6 | 12.9 | 23.5 | 18.4 | -47 | 1.24 | 0.119 | |
| 2003 | 11 | 29 | 6 | 14.5 | 18.7 | 12.1 | 23.5 | 18.4 | -46 | 1.29 | 0.109 | |
| 2003 | 11 | 29 | 7 | 14.8 | 17.7 | 11.3 | 23.4 | 19.2 | -45 | 1.2 | 0.119 | |
| 2003 | 11 | 29 | 8 | 13.4 | 16.4 | 10.8 | 23.4 | 16.1 | -36 | 1.22 | 0.084 | |
| 2003 | 11 | 29 | 9 | 13.9 | 17.7 | 10.4 | 23 | 16.8 | -38 | 1.27 | 0.087 | |
| 2003 | 11 | 29 | 10 | 13.2 | 16.4 | 9.8 | 22.9 | 18.6 | -33 | 1.24 | 0.157 | |
| 2003 | 11 | 29 | 11 | 13.3 | 17.6 | 8.9 | 22.7 | 18.1 | -32 | 1.32 | 0.141 | |
| 2003 | 11 | 29 | 12 | 14.4 | 19.7 | 8.6 | 22.7 | 19 | -37 | 1.37 | 0.127 | |
| 2003 | 11 | 29 | 13 | 16.1 | 19.5 | 7.9 | 22.7 | 20.7 | -44 | 1.21 | 0.115 | |
| 2003 | 11 | 29 | 14 | 16.5 | 20.5 | 7.4 | 22.7 | 19.4 | -44 | 1.24 | 0.074 | |
| 2003 | 11 | 29 | 15 | 15.2 | 18.8 | 7.3 | 22.7 | 18.5 | -37 | 1.24 | 0.09 | |
| 2003 | 11 | 29 | 16 | 12.8 | 16.2 | 7.2 | 22.7 | 15.5 | -26 | 1.27 | 0.088 | |
| Mean | 1.25 | 0.126 | ||||||||||
| Standard Deviation | 0.10 | 0.030 | ||||||||||
Back to top