MARINE WEATHER REVIEW - North Atlantic Area
March to August 2003
By George P. Bancroft
Introduction
The period from March through the first half of April was quite active with leftover winter storms frequent, originating near the U.S. East Coast and tracking east-northeast, with many turning north toward the Greenland area and becoming storms. All of the hurricane-force storms of the six-month period occurred during this period. The level of activity dropped off sharply late in April and beyond. The month of May produced only two lows with storm-force winds, one near Greenland early in the month and another, described in this article, developing well south of Newfoundland. There was one storm in June, at the beginning of the month near the U.S. East Coast. The tropical season was off to an early start, as the first tropical storm of 2003, Ana, formed in late April and affected OPC's far southern waters, well before the official June 1 start of the Atlantic hurricane season. Other tropical systems, a hurricane and a depression, appeared in OPC's area in July, with the really busy part of the season yet to come.
Tropical Activity
Tropical Storm Ana: Ana originated from a non-tropical low which drifted north into OPC's waters, southwest of Bermuda, early on April 18. At the same time, strong high pressure developed to the north near the Canadian Maritimes, with a large area of east to northeast gales developing between the low and the high by that time. The strongest wind report was as 45KT east-northeast wind from the ship SFIR near 38N 64W at 0000 UTC April 19. The ship ELZZ9 (42N 53W) encountered northeast winds of 40KT and 7.0-meter seas (23 feet) at 1200 UTC April 21. The low center moved northwest to 34N 69W on the 19th before looping back to the south-east and remaining over warm water. The Tropical Prediction Center (TPC) declared the system subtropical as it moved out of OPC's area of marine responsibility and named it "Ana", the first named cyclone of 2003. TPC names both subtropical and tropical cyclones when they develop maximum sustained winds of 34KT or more. Figure 1 shows newly-named Subtropical Storm Ana passing south of 31N with the positionand intensity based on the advisory time (0900 UTC). The cyclone name, position, intensity and motion are given in the box placed near the cyclone in Figure 1. The system became a tropical storm south of 31N in TPC's area about a day later, before turning back into OPC's marine area on April 23.
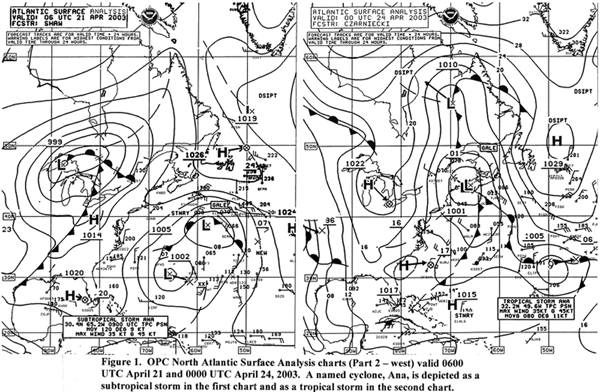 |
Figure 1 - OPC North Atlantic Surface Analysis charts (Part 2 - west) valid 0600 UTC April 21 and 0000 UTC April 24, 2003. A named cyclone, Ana, is depicted as a subtropical storm in the first chart and as a tropical storm in the second chart. |
This was the first named tropical storm to occur in the Atlantic basin in April (Reference 1). The second part of Figure 1 shows Ana as a tropical storm with position and other information (in box) based on the 0300 UTC April 24 advisory.
The system became extratropical as it merged with the stationary front nearby within six hours. The cyclone then drifted east and later northeast before accelerating northeast and redeveloping as a gale over Great Britain with a 983-hPa central pressure at 1200 UTC April 27. The system weakened over Norway on the 30th.
 |
Figure 2 - OPC North Atlantic Surface Analysis chart (Part 2) valid 0000 UTC July 19, 2003, showing Hurricane Danny at maximum intensity. |
Hurricane Danny: Danny, the first hurricane of the 2003 Atlantic hurricane season to affect OPC's waters, originated as Tropical Depression 5 which actually formed outside the tropics in OPC's marine area of responsibility, near 32N 54W, at 1500 UTC July 16. The cyclone moved initially northwest and then curved around the subtropical high centered near 36N 40W while intensifying into a minimal hurricane with maximum sustained winds of 65KT with gusts to 80KT (Figure 2).
Figure 2 shows Danny six hours after attaining hurricane strength. Danny then moved into cooler water and weakened to a tropical storm while turning east on the north side of the subtropical high early on the 20th. The cyclone then weakened to a tropical depression while turning southeast at 2100 UTC July 20. Danny subsequently weakened further and became trapped as a remnant low in the broad subtropical ridge about 700 nm southwest of the Azores, before finally dissipating by the 27th.
Tropical Depression 7: This tropical cyclone had a brief existence over water, forming off the north Florida coast on the afternoon of July 25 and moving northwest, before moving inland over Georgia and the Carolinas on the morning of July 26. Buoy 41004 (32.5N 79.1W) reported a peak wind of southwest 29KT at 1400 UTC July 26 after passage of the cyclone. Buoy 41008 (31.4N 80.9W) reported a peak wind of 27 KT from the east at 0300 UTC July 26 and maximum seas of only 2.0 meters (7 feet) two hours later.
Other Significant Events of the Period
South-Central North Atlantic Storm, March 1-3: The busy month of March began with a low which, after moving off the coast of the Carolinas late on February 27, developed hurricane-force winds at a relatively far-south location late on March 1 while tracking east-northeast just south of 40N.
 |
Figure 3 - OPC North Atlantic Surface Analysis chart (Part 1 - east) valid 0600 UTC March 2, 2003. |
The low is shown near maximum intensity in Figure 3 as a rather compact hurricane-force storm, with the ship C6OL1 plotted southwest of the center near 36N 45W with a 65KT northwest wind. The Chesapeake Bay (WMLH) encountered north winds of 60KT and 11.5-meter seas (37 feet) near 40N 46W at this time. Twelve hours prior, the ship SCFH near 36N 52W reported a northwest wind of 70 kt. The vessel KRPD reported 15-meter seas (49 feet) near 39N 59W a bit earlier, at 1200 UTC on the 1st, although the author is uncertain of the accuracy of the report. Another ship, PDHW near 37N 34W, also encountered 11.5-meter seas (37 feet), along with southwest winds of 45KT, at 1200 UTC March 2. The system maintained hurricane-force winds until early on the 3rd, before weakening to a gale-force low near France early on March 4, and then merging with a low south of Iceland on the 5th.
Intense North Atlantic Storm, March 6-9: Strong high pressure developed behind the departing hurricane-force low above, forcing two following storms on more northward and then northeastward tracks, with the second system becoming absorbed by a much more intense storm late on March 7. The period of most rapid development of this powerful storm is shown in Figure 4. This low emerged off the mid-Atlantic coast of the U.S. as a 1001-hPa low at 1800 UTC March 6 and is shown passing south of Newfoundland twelve hours later (first part of Figure 4), about to absorb the preceding storm system east of Newfoundland (970-hPa). In the twenty-four hour period ending at 1200 UTC March 8, the central pressure dropped a remarkable 55-hPa (1.62 inches), or more than 2-hPa per hour. The system is shown at maximum intensity at 1800 UTC March 8 (second part of Figure 4) with a pressure of 924-hPa (27.29 inches). A search for intense North Atlantic lows in prior issues of Mariners Weather Log done in September 2002 for research turned up a 916-hPa low near the Faeroe Islands on January 11, 1993 as apparently the last low that was deeper than this one (Reference 2).
|
|
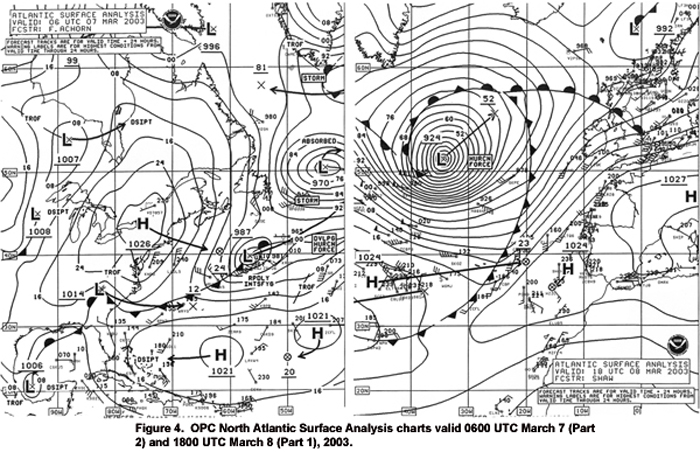

Figure 5 is a 500-hPa analysis for 1200 UTC March 7, when the low was beginning its period of rapid intensification, reveals a strong upper-level low over northeast Canada, a strong jet stream to the south and its associated short-wave trough supporting development.
More information on use of the 500-hPa chart by mariners can be found in Reference 3. A list of ship reports with hurricane-force winds and/or seas 40 ft or higher (greater than 12 meters) from this storm may be found below.
| SHIP | LOCATION | DATE/TIME (UTC) | WIND (kt) | SEAS (m/ft) |
| DPLE | 43N 43W | 7/1800 | W 65 | 14.5/ 47 |
| SKWI | 50N 39W | 8/0600 | S 70 | |
| SKWI | 50N 39W | 8/1200 | W 80 | |
| C6QE7 | 48N 46W | 8/1200 | NW 65 | |
| PIBO | 44N 38W | 8/1200 | W 55 | 17/ 56 |
| Sea-Land Florida | 42N 41W | 8/1200 | W 45 | 14.5/ 47 |
| (KRHX) | ||||
| DPLE | 43N 44W | 8/1800 | NW 50 | 14.5/ 47 |
| SKWI | 49N 40W | 9/0600 | W 70 | |
| Sea-Land Florida | 45N 33W | 9/1200 | W 40 | 13.5/ 44 |
The QuikSCAT image of satellite-sensed winds valid just prior to the storm's reaching maximum intensity (Figure 6) reveals a broad swath of winds in the 65 to 80KT range from south to w of the center. This data supports the 80KT west wind reported by SKWI and listed above, taking into account the time difference and movement of the center. Figure 7 is a visible satellite image of the storm taken less than five hours prior to the valid time of the second surface analysis in Figure 4, near maximum intensity. The well-defined frontal cloud bands spiral around a center that appears to be surrounded by multiple cloud rings, common in very intense systems.
|
|


The storm maintained hurricane-force winds until 1800 UTC March 9 while slowly weakening and moving east-northeast. The low then weakened to a gale northwest of the British Isles on the 10th before moving into Norway late on the 11th.
Northwest Atlantic Storm of March 14-16: This low developed after moving off the mid-Atlantic coast of the U.S. late on March 13 then passed just east of Newfoundland late on the 14th before turning north toward the Greenland area, one of a series to take a similar track in March and early April. The center dropped 36-hPa in central pressure in the 24-hour period ending at 0600 UTC March 15. Figure 8 covers thirty-six hours of development of this low into a hurricane-force storm from its origin over the eastern U.S. The system moved into an area of sparse ship data, but the QuikSCAT data in Figure 9 reveal storm-force winds around the south and west semicircles of the center with one 65KT wind barb southwest of the center. The ship PDHW near 46N 44W reported south winds of 45KT and 10-meter seas (32 feet) at 0000 UTC March 15, while Platform VEP717 near the Grand Banks reported southwest winds of 55KT. The storm center attained a lowest pressure of 962 mb near 56N 48W at 0000 UTC March 16 before weakening west of Greenland on the 17th.
|
|


North Atlantic Storm of March 18-21: This system developed off the mid-Atlantic coast early on March 17 and followed a track similar to that of the previous storm except farther east after passing Newfoundland. Figure 10 depicts the development of this storm to maximum intensity over a 48-hour period. The second part of Figure 10 shows the system stalling east of Greenland. The 952-hPa central pressure made this system the second deepest of the North Atlantic in this period. A QuikSCAT image (Figure 11) taken about nine hours prior to the valid time of the second part of Figure 10 reveals a northeast flow of up to 75KT channeled between the occluded front and the Greenland coast, in an area where ship reports are rare. The storm subsequently weakened to a gale late on March 21 and then moved northwest of Iceland on the 23rd.
|
|


Eastern North Atlantic Storm, April 11-13: During the second week in April a series of weak lows tracked east off the U.S. coast, moving near 40N, until early on April 11 when the last in the series rapidly intensified and developed hurricane-force winds relatively far south, like the early March storm except farther east. Figure 12 shows a 1006-hPa frontal wave of low pressure well south of Greenland intensifying into a 968-hPa hurricane-force storm over a 30-hour period ending at 0600 UTC April 12. This developing low definitely qualifies as a meteorological "bomb", as the central pressure dropped 30-hPa in a 24-hour period ending at 0000 UTC April 12. The ship PDAY near 40N 27W reported southwest winds of 55KT at 0600 UTC April 12. Six hours later, the vessel DEBB encountered northwest winds of 35 kt but seas of 12 meters (40 feet) near 40N 37W. Although the system began to weaken thereafter, at 1800 UTC on the 13th the ships WMBK (34N 14W) and PEBP (45N 17W) reported west winds of 30 kt and 12-meter seas (40 feet), and northwest winds of 40KT accompanied by 12-meter seas (39 feet), respectively. The system then elongated upon encountering high pressure to the east, with one gale center dissipating near Spain on the 15th and another center moving north past Iceland on the 14th.
|
|


Cutoff Storm in South Central North Atlantic, May 22-23: A low-pressure center moved north into OPC's waters near 54W with a central pressure of 1004 hPa at 1800 UTC on the 21st and became a storm six hours later as it drifted northeast. The system stalled near 34N 51W early on the 22nd. Although the central pressure was only as low as 995-hPa, the cyclone encountered high pressure to the north and developed a tight pressure gradient and strongest winds around the north semicircle. At 1800 UTC on May 23, the ship PDHU (40N 54W) encountered north winds of 45KT and 10.5-meter seas (34 feet). The Barrington Island (C6QK) reported southeast winds of 40KT and 10-meter seas (32 feet) near 41N 47W at 0600 UTC May 24. The low began to move north-northeast on the 23rd, reaching 47N 35W at 0000 UTC May 26, when the buoy 44615 (47.5N 39W) reported a north wind of 50 KT. The center then weakened and passed east of Iceland on the 28th.
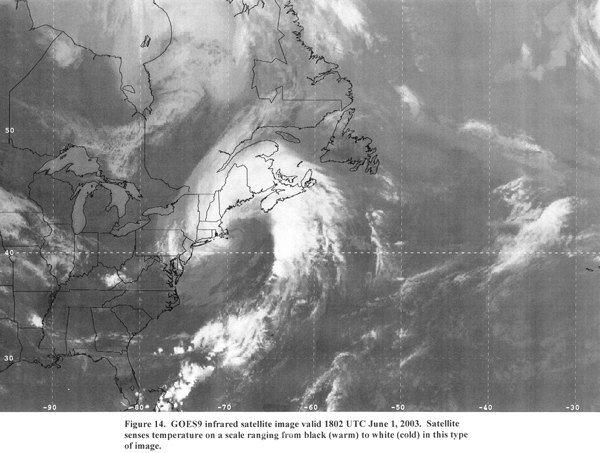
East Coast Storm of June 1-2: Inland low pressure at the start of the month redeveloped as a rapidly intensifying low off the North Carolina coast at 0600 UTC June 1, and dropped 16 mb in central pressure in the following twelve hours (Figure 13). This rapid rate of intensification and the resulting 974-hPa storm center near Cape Cod were quite unseasonable for June, more typical in the winter months. Figure 14 is an infrared satellite image of the storm, revealing a large fully-developed occluded system with a well-defined center near Cape Cod. The ship SFIR reported south winds of 50KT and 7-meter seas (23 feet) near 38N 63W at this time. Twelve hours later, the ship A8BZ6 reported west winds of 60KT near 41N 65W. At 1200 UTC June 2, the vessel ELUX6 (39N 56W) experienced seas of 8 meters (27 feet) along with southwest winds of 35KT. The buoy 44005 in the Gulf of Maine reported winds reaching 35KT with gusts to 54KT from the north-northeast at 1900 UTC June 1, the strongest report from a buoy. The Canadian buoy 44142 (42.5N 64.0W) reported maximum seas of 5.5 meters (18 feet) at 0800 UTC June 2. The storm then moved over the Canadian Maritimes and weakened, before turning more southeast and dissipating off Newfoundland on the 5th.
 |
|
Figure 14 - GOES9 infrared satellite image valid 1802 UTC June 1, 2003. Satellite senses temperature on a scale ranging from black (warm) to white (cold) in this type of image. |
Page last modified: