Application and Use of Volunteer Observing Ship (VOS) Data at the Tropical Prediction Center/National Hurricane Center
Jamie R. Rhome Tropical Analysis and Forecast BranchNOAA/Tropical Prediction Center/National Hurricane Center
Introduction
The Volunteer Observing Ship (VOS) Program is an integral component of the National Weather Service's Marine Program. In addition to providing observations over data-sparse regions for the purposes of initializing numerical weather prediction models and developing baseline climatology, the VOS program provides real-time observations which are used to issue watches/warnings, locate synoptic features such as fronts and lows, define the surface pressure and wind field, and characterize features such as gales and storms.
The purpose of this article is to outline a few of the many operational uses of the VOS data at the Tropical Prediction Center/National Hurricane Center (TPC/NHC). The motivation stems from a VOS program meeting held in Kansas City, MO, during December 2002 where participants commented that a clarification of these applications was desired. While this discussion is not meant to be an exhaustive list of all applications, a broad overview of the most relevant will be briefly presented in the hopes of providing increased awareness on the significant importance of this data to the operations of the National Weather Service (NWS) and more specifically the TPC/NHC.
It should be noted that the main goal of tropical cyclone and marine forecasts is to help mariners avoid hazardous and/or inclement weather. However, sometimes rapidly evolving or developing systems do not allow time for avoidance. In these situations, the data is extremely valuable and may be the only data available to make a watch/warning decision. Hourly or three-hourly observations are requested in these situations.
Overview of Operations at TPC/NHC
The TPC is one of nine national centers within the National Weather Service's National Centers for Environmental Prediction (NCEP). These centers provide a variety of national and international weather products, which generally focus on large-scale areas or regions. The Ocean Prediction Center (formerly known as the Marine Prediction Center) is also one of the nine NCEP centers.
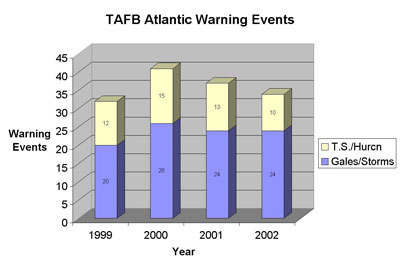 |
Figure 1. Composite of total TAFB warnings by year (1999-2001). |
The TPC's mission is to save lives, mitigate property loss, and improve economic efficiency by issuing the best watches, warnings, forecasts and analyses of hazardous tropical and marine weather, and by increasing understanding of these hazards. In addition to the Hurricane Program, which has responsibility for tropical cyclone analysis and forecasts products, the TPC also has responsibility for issuing marine forecasts for the subtropical and tropical North Atlantic Ocean, Caribbean Sea, Gulf of Mexico, and the eastern subtropical and tropical North Pacific Ocean. In fact, non-tropical related events (gale and storm) constitute over half of the total warnings issued by the Tropical Analysis and Forecast Branch (Figure 1). These forecasts are issued year round regardless of tropical cyclone activity.
The TPC is comprised of three units including the National Hurricane Center (NHC), the Tropical Analysis and Forecast Branch (TAFB), and the Technical Support Branch (TSB). While all three branches work very closely to ensure the overall TPC mission, each branch specializes in select areas.
The NHC maintains a continuous watch on tropical cyclones, from 15 May in the eastern Pacific and 1 June in the Atlantic, through 30 November, including the preparation and issuance of forecasts and watches/warnings within the area of responsibility. During the "off-season," the NHC conducts an extensive outreach and education program, which includes training U.S. emergency managers and representatives from many other countries affected by tropical cyclones.
The TAFB provides year-round marine weather analysis and forecast products over the tropical and subtropical waters of the eastern North and South Pacific and the North Atlantic basin. The branch is comprised of three operational desks (Atlantic Marine Forecast Desk, East Pacific Marine Forecast Desk, and Tropical Analysis and Forecast Desk), as well as a backup desk for other NCEP centers. The branch also produces satellite based weather interpretation and rainfall estimates for the international community. Additionally, the TAFB provides operational and forecast support to the NHC through manpower and satellite analysis of tropical cyclone activity.
The TSB provides technical support for computer and communications systems and maintains a small applied research and techniques development unit which develops tools for hurricane and tropical weather analysis and prediction. TSB also has a storm surge group, which provides information for developing evacuation procedures for coastal areas.
Application of VOS Data
Issuing Watches and Warnings
One of the primary responsibilities of the TPC is the issuance of watches and warnings, which include gale warnings, storm warnings, tropical storm watches/warnings, and hurricane watches/warnings. The timely and accurate issuance of these watches/warnings is dependent upon knowing not only what will happen in the future, but also what is happening now. This task would be difficult without accurate surface reports and would rely primarily on satellite and numerical model output. While both satellite and numerical models are tremendous tools for operational forecasters, they are in no way a replacement for accurate ship observations. Additionally, cases often arise where weather conditions are stronger/weaker than what would be expected by simply evaluating the large-scale pattern or numerical output.
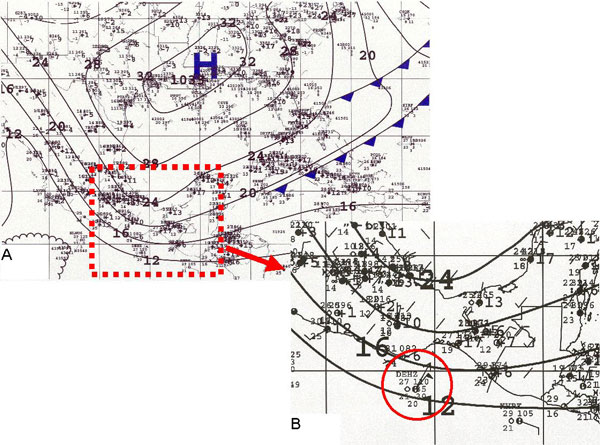 |
Figure 2. Surface Pressure Analysis (Panel A) with boxed location shown in Panel B |
An example is given in Figure 2 for the case of storm force winds within the Gulf of Tehuantepec. Panel A shows a fairly common pattern which occurs over TPC's area of responsibility during the winter months. A strong (1033-hPa) migratory high-pressure center is moving eastward along the southeastern United States behind a cold front over the Western Atlantic. This pattern is typically associated with strong winds over both the Gulf of Tehuantepec and Gulf of Papagayo.
While pattern recognition would alert the forecaster to the possibility of strong winds over both locations, it provides little insight into the relative magnitude of an event. Typically, a high center location over the southwestern Gulf of Mexico or Bay of Campeche produces the strongest winds within the Gulf of Tehuantepec. However, in this case, the high center is located further north along the Gulf Coast. Nonetheless, the relatively high surface pressure (1033 hPa) would likely warrant strong winds and possibly a gale warning for the Gulf of Tehuantepec.
A closer inspection of the area of interest (Panel B) reveals the ship Hanover Express (DEHZ) moving through the Gulf of Tehuantepec region reporting winds of 50 knots (kts). This particular report was the only ground truth observation within the area of interest and the sole indication that storm force conditions were occurring. Without this observation, the decision to issue a gale warning, storm warning, or no warning would have been based on the surface pressure pattern (pattern recognition and experience) as well as numerical model output. Given the unfavorable location of the parent high pressure center, a storm warning would likely not have been issued. This case clearly indicates the importance of a single ship observation in the watch/warning decision making process.
Estimating Tropical Cyclone Intensity and Wind Radii
One of the most important tasks in the hurricane forecast process is estimating the initial position, intensity, and size of the system. Imagine issuing a forecast and/or warning for a system whose location, intensity, and size is unknown. Precise initial conditions are also crucial for the proper initialization of numerical weather forecast models.
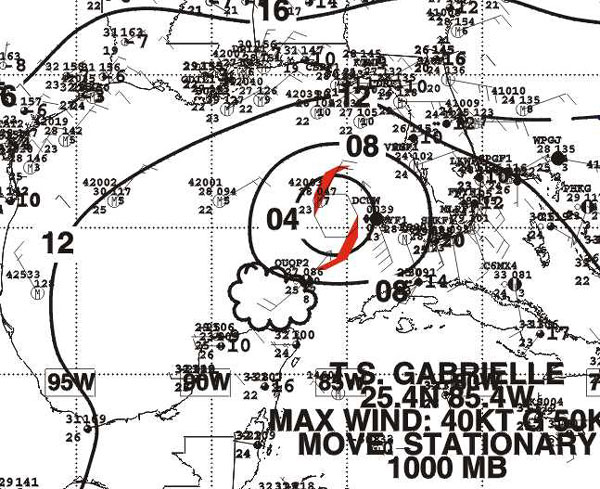
An example of the role ship observations can play in this process is demonstrated in Figure 3 which shows the surface pressure analysis and available surface observations for Tropical Storm Gabrielle on 13 September 2001. Note the ship immediately east of Gabrielle, which is reporting 40 kts wind and 1003.9 hPa surface pressure. This particular ship supplied crucial data, which supported the upgrade of the system from a tropical depression to a tropical storm at 11AM that morning. Additionally, the ship helped locate the center and define the surface pressure field associated with Gabrielle, which are two crucial variables used to initialize numerical guidance.
 |
|
Figure 3. Surface pressure analysis for T.S. Gabrielle on September 13, 2001. |
The following is an excerpt from the 11AM Tropical Cyclone Discussion (TCD): "Two surface observations...from ships with call signs DCUW (Santa Maria) and WCZ5238 ...of 35 and 40 kts winds respectively...support upgrading the cyclone to Tropical Storm Gabrielle." Given the location of Gabrielle over open water away from land observations, the intensity and surface pressure field would have had to have been estimated without the nearby ship observations.
Another good example of the importance of ship observations in tropical cyclone intensity estimation occurred on 19 September 2002. A nearby ship indicated that tropical storm Josephine was much stronger than satellite based intensity estimates. The morning discussion read, "In a bit of a surprise, ship Albatros (C6LV3) reported 50 kts winds about 100 miles southeast of the center at 12Z, so that is the initial intensity for this advisory."
Locating and Defining Synoptic Surface Features
The TPC provides surface analyses every six hours at the synoptic times (00, 06, 12, and 18 UTC). These analyses are among the most widely used products by the marine community, as they provide tremendous amounts of information on current and anticipated weather conditions, including active warnings. Since these analyses focus primarily over open water (another NCEP center provides analyses over the continental United States), ship observations are the main source of information used in the compilation. While the VOS data is supplemented by C-MAN stations, moored buoys, and drifting buoys, ship reports provide the majority of the data used in the assembling of these analyses.
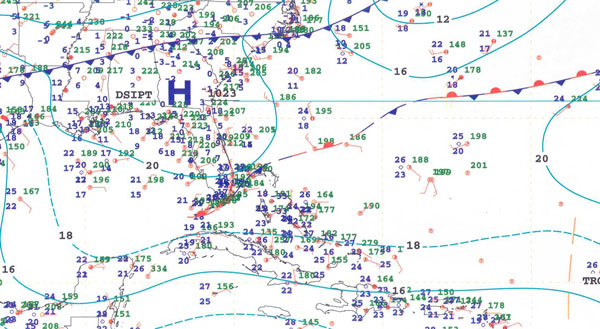
Figure 4 shows a rather common situation where two ship observations indicate the exact location of a frontal boundary. This particular case occurred during the evening hours when visible satellite imagery was no longer available. Additionally, the front was masked by overcast middle to upper level clouds in infrared satellite imagery. Thus, the boundary was particularly difficult to locate, as are many surface features at night or when high clouds are present. However, the two highlighted ships in Figure 4 clearly show the location of the frontal boundary. The front would have been much more difficult to locate without the two ships, and the realm of possible positions may have ranged by as much as several hundred nautical miles based on the next closest ships.
 |
|
Figure 4. Surface pressure analysis showing the application of ship observations in locating frontal boundaries. |
Surface boundaries alone may not seem like an overly significant feature; however, they can have a large impact on the surface wind field and weather. For example, in this case the wind is primarily north to northwest poleward of the boundary and south to southeast equatorward of the boundary. Not knowing the location of this boundary could constitute a possible 180-degree error within the wind field analysis and forecast.
Interpreting and Verifying Numerical Model Output
 |
|
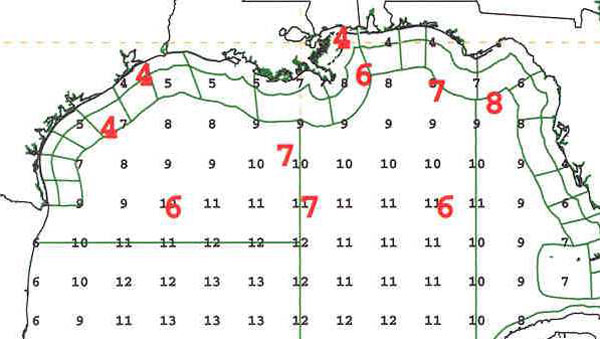
Figure 5. Significant wave heights (feet) from NOAA Wave Watch 3 (NWW3) numerical model (evenly spaced smaller numbers), along with significant wave heights (feet) from available buoys (larger numbers). |
There are many operational numerical models utilized at TPC, each having its own set of strengths and weaknesses as well as biases. The challenge for the operational forecaster is knowing these biases and determining which of the many models is most accurate/applicable for any given situation or weather pattern. This task is even more complicated by the fact that a model may handle one weather feature well and another incorrectly. Additionally, model performance can vary from day to day, year to year, or event to event. Thus, the forecaster must evaluate each model's overall performance and then apply that knowledge to the forecast. This is where the application of the ship data is very important. The VOS data provide ground truth for the verification of the models, which greatly aids in determining how well the model is performing. An example is given in Figure 5, which shows the significant wave height forecast from the NOAA Wave Watch 3 (NWW3) model compared with buoy observations over the Gulf of Mexico. Note that the model significantly overestimated the sea heights over the central Gulf of Mexico by as much as a factor of two. While no ship data is shown in Figure 5, it does highlight that numerical models can have significant biases that can only be evaluated by observations. In areas devoid of observations, the model biases cannot be determined which may lead to significant forecast error.
Verifying Remotely Sensed (Satellite) Data
The last few years have witnessed a wealth of advanced satellite technology and instrumentation, allowing scientists to probe the atmosphere in ways previously impossible. One of the most applicable advances for the marine community is the ability to estimate both wind speed and direction via satellite imagery.
Seawinds/QuikSCAT is a sun-synchronous polar orbiting satellite equipped with an active microwave- sensing instrument (13.4 GHz, 110-watt) that estimates surface wind over the ocean by measuring reflection/scattering off the ocean surface waves. The potential application is far reaching in terms of providing better data coverage over open water. However, there are many limitations to this new data, and the estimations are not always accurate. For example, data is only available at any given location approximately twice per day given the satellite is polar orbiting (circles the earth) rather than geostationary (location remains fixed). Additionally, the wind estimates can often be contaminated by heavy rain. Thus, it is sometimes difficult to know whether satellite-based surface wind observations are accurate or how to apply old data (Quikscat winds are not continuous) to a current analysis/forecast. However, satellite-based data becomes much more useful when used in conjunction with ship observations.
 |
|
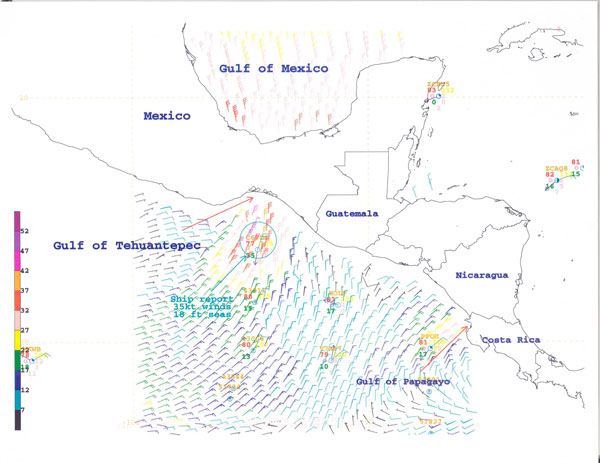
Figure 6. Quikscat satellite based 10-meter wind estimates along with available ship observations for a case of storm force winds over the Gulf of Tehuantepec. |
An example is given in Figure 6, which shows 10-meter wind estimates from Quikscat along with available surface ship observations. There are two areas of interest: the Gulf of Papagayo and the Gulf of Tehuatepec. In this particular case, a ship report is available in each location. A ship moving through the Gulf of Tehuantepec region is reporting 35-kts winds and 5.5-m (18-foot) seas. This alone is extremely valuable information, as it indicates gale force conditions exist and warrants the issuance of a warning (if one is not already issued). However, the question now becomes, how large of an area do gale force winds cover? The ship observation also indicates that the Quikscat surface wind estimates are accurate and allows the forecaster to determine the areal extent of the gale force winds. Additionally, the Quikscat data indicates winds to near-storm force north of the ship observation. Without the ship, the forecaster would have been left guessing how accurate the Quikscat wind estimates were in this case. With the ship observation, however, the forecaster could be reasonably confident that the Quikscat winds were accurate and make appropriate decisions regarding the issuance of a gale versus storm warning.
A similar analysis can be drawn over the Gulf of Papagayo where a ship is reporting 15 kts. Again, the Quikscat wind estimates match up well with the ship report, thus allowing increased confidence in the Quikscat observations.
Conclusions
This article has demonstrated just a few of the many operational applications of VOS observations in an attempt to highlight the importance of the program. While satellite technology and numerical weather prediction models have made tremendous advances during the last several years, ship observations remain the most widely used and accepted ground truth observations. These observations form the very foundation of an accurate marine analysis and forecast. In fact, one could easily draw a parallel between ship observations and weather radar. Both play a pivotal role in the timely and accurate issuance of weather warnings and general surveillance. Without accurate ship observations, the marine program would surely suffer.
Biography
Jamie Rhome has worked as a meteorologist/forecaster for the Tropical Analysis and Forecast Branch of the Tropical Prediction Center since September 1999. He received his B.S. and M.S in Meteorology from North Carolina State University. Previous work experience includes the United States Environmental Protection Agency and the State Climate Office of North Carolina.
Page last modified: