Marine Weather Review - North Pacific Area
September 2002 to February 2003George P. Bancroft, Meteorologist Ocean Prediction Center (OPC)
Introduction
The weather of the period started out more typical of late summer, with high pressure over the mid-latitudes. Three tropical cyclones were present on OPC oceanic analyses, with two of then actually in OPC's high seas area (north of 30N and east of 160E). Nontropical weather systems became more active as the season progressed into autumn. Unlike in the Atlantic, occasional tropical activity continued into January, with some of these becoming significant extratropical lows in OPC's high seas area. The first hurricane-force low of this fall and winter period occurred in late September. Such lows became much more frequent by December, which was the most active month. There was increased high-latitude blocking in January and February, when the stronger cyclones were associated with the southern branch of the jet stream. The blocking high pressure often caused lows to slow or move erratically after turning north.
Tropical Activity
Typhoon Ele: Ele was formerly a central-Pacific hurricane which crossed 180W in August. At the start of September, Ele was near 18N 177E with maximum sustained winds of 115 kt and gusts to 140 kt, moving slowly north, then northwest. A slow weakening trend began on the 3rd. Ele was downgraded to a tropical storm near 34N 170E late on 6 September, and to a depression on the 9th, near 40N 167E. The cyclone later redeveloped as an extratropical gale force low on the 10th near 47N 174E, and moved into Alaska on 12 September.
Typhoon Sinlaku: Sinlaku was about 600 nmi southeast of Tokyo at the start of September, with maximum sustained winds of 115 kt with gusts to 140 kt. The cyclone drifted west with a slow weakening trend, passing west of OPC's oceanic analysis area after 0000 UTC 3 September.
Tropical Depression Fausto: Formerly an eastern-Pacific hurricane (in August), Fausto tracked northwest and, by 1200 UTC 3 September, became absorbed by an extratropical gale-force low in the Bering Sea.
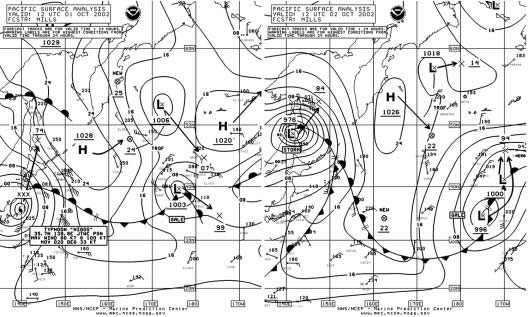 |
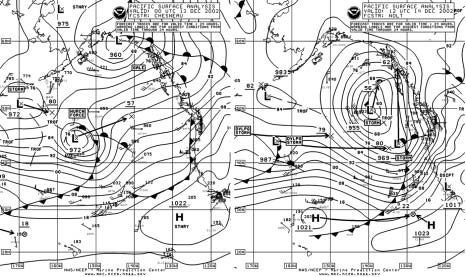
Figure 1. North Pacific Surface Analysis Charts (Part 2) valid 1200 UTC 1 and 2 October 2002. |
Super Typhoon Higos: Higos began as a tropical depression near 16N 155E early on 26 September. Moving northwest, the cyclone quickly intensified to a typhoon on the 27th, and then was a super typhoon on 29 September. It reached maximum intensity at 1200 UTC 29 September with sustained winds of 135 kt and gusts to 165 kt, near 21N 137E. Higos then turned north along 136E and began to weaken. The ship 9MBR (33N 141E) observed southeast winds of 60 kt as Higos passed to the west, near 33N 138E, at 0600 UTC 1 October. Figure 1 depicts Higos near Tokyo six hours later with maximum sustained winds of 80 kt with gusts to 100 kt, and also becoming an extratropical storm 24 hours later with fronts. The system then turned east and weakened before dissipating in the southeast Bering Sea on 6 October.
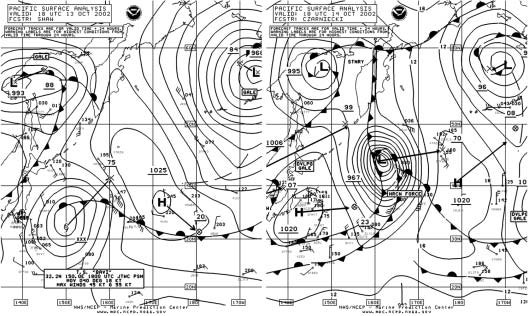 |
Figure 2. OPC North Pacific Surface Analysis charts (Part 2) valid 1800 UTC 13 and 14 October 2002. |
Typhoon Bavi: Bavi entered OPC's oceanic analysis area near 150E early on 10 October with sustained winds of 40 kt and gusts to 50 kt, moving north. Bavi intensified to a minimal typhoon late on the 11th near 25N 147E, and weakened to a tropical storm 24 hours later. Figure 2 shows Tropical Storm Bavi with a large circulation east of Japan, approaching a frontal zone. Bavi became extratropical 12 hours later and re-intensified into a significant extratropical low with hurricane-force winds in the following 12 hours leading to the intense system in the second part of Figure 2 The Tycom Responder (V7CY9) at 43N 166E reported west winds of 65 kt at 0000 UTC and 0600 UTC 15 October. The system then tracked east and weakened slowly, before entering the western Gulf of Alaska as a gale on 19 October.
Tropical Depression 27W: This cyclone formed near 17N 156E at 0600 UTC 17 October and moved west, strengthening slightly in 24 hours before weakening to a remnant low near 16N 148E early on 19 October.
Tropical Depression 28W: This cyclone entered OPC's oceanic analysis area near 176E at 1800 UTC 18 October but weakened to a remnant low near 20N 176E eighteen hours later.
Tropical Storm Maysak: Tropical Depression 29W formed near 20N 162E at 1800 UTC 26 October and moved southwest at first, then turned northwest six hours later. The cyclone became a minimal tropical storm near 22N 159E at 1200 UTC 27 October, continuing to intensify while turning toward the north, then northeast after 0600 UTC 28 October. Tropical Storm Maysak attained maximum strength at 1800 UTC 28 October near 28N 161E with maximum sustained winds of 55 kt and gusts to 70 kt. Maysak was approaching a frontal zone to the north and weakened to an extratropical gale-force low near 34N 174E 24 hours later.
Typhoon Huko: Huko, formerly a hurricane in the Central Pacific, entered OPC's surface chart area near 17N 175E on 3 November with maximum sustained winds of 70 kt with gusts to 85 kt. Tracking northwest, Huko weakened to a tropical storm near 26N 164E at 0600 UTC 6 November, before turning northeast and weakening to a minimal tropical storm 24 hours later. The cyclone became extratropical upon crossing the dateline early on the 7th and then dissipated.
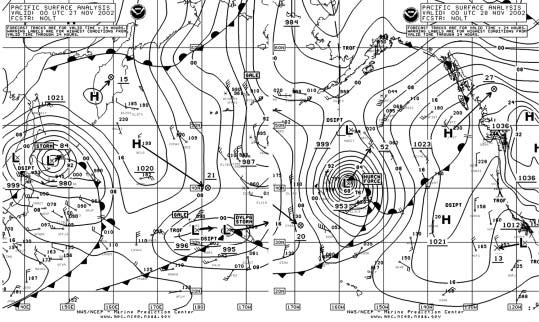 |
Figure 3. OPC North Pacific Surface Analysis charts valid 0000 UTC 27 November (Part 2) and 0000 UTC 28 November (Part 1) |
Typhoon Haishen: Haishen moved northeast into the waters well south of Japan early on 23 November with maximum sustained winds of 85 kt and gusts to 105 kt. The cyclone weakened to a minimal typhoon near 29N 143E at 1800 UTC 24 November before becoming extratropical 6 hours later. The system re-intensified to a small, compact hurricane-force low 24 hours later near 34N 157E, when the ship DEFA encountered southwest winds of 65 kt near 31N 157E. Ex-Haishen then continued east and weakened over the next day, before re-intensifying and turning northeast. Figure 3 captures this second reintensification in which the central pressure dropped an impressive 42 hPa in 24 hours, bottoming out at 953 hPa. The highest wind reported from available ship data was a west wind of 55 kt from the Maren Maersk (OWZU2) (40N 155W) at 1800 UTC 28 November.
Typhoon Pongsona: Formerly a super typhoon south of OPC's map area, Pongsona appeared on OPC analyses near 16N 144E at 0000 UTC 9 December with maximum sustained winds of 125 kt with gusts to 150 kt. The cyclone turned to the north and then northeast and weakened rapidly after 0000 UTC on the 10th, becoming extratropical near 28N 160E at 0000 UTC 11 December and then dissipating by the 12th.
Tropical Storm Yanyan: This cyclone, near 16N 151E with sustained winds of 40 kt with gusts to 50 kt on 19 January, moved northeast and weakened, becoming extratropical 36 hours later. Other Significant Events
North Pacific Bering Sea Storm 22-25 September: This system came from south of Japan at 0000 UTC 22 September when it was already a 988- hPa gale-force low. The center tracked north and intensified after 0000 UTC 23 September. The cyclone reached a maximum intensity of 956 hPa at 0600 UTC 25 September near 53N 180, unseasonably strong for so early in the fall season. OPC analyzed it as a hurricane-force low at 0000 and 0600 UTC 25 September, the first of the season for non-tropical systems. There were several reports of winds 50 kt or higher around this storm from the 23rd to the 25th, the highest being a 55 kt southeast wind from the ship VBN5979 near 56N 166W at 1800 UTC 25 September. The system then weakened and passed inland over Alaska on 28 September.
North Pacific Storm 26-29 October: This storm was one of two systems of similar intensity to affect the central North Pacific during middle to late October. Both attained central pressures as low as 962 hPa. The one with the strongest winds took a more southern track along 40N and rapidly intensified after passing the dateline. By 0000 UTC 27 October, the center was at 41N 168W with a pressure of 973 hPa, down 35 hPa in 24 hours, certainly qualifying this as a meteorological "bomb." The center at 1200 UTC 27 October was down to 962 hPa near 43N 163W. Satellite data (QuikSCAT scatterometer winds) taken about four hours later revealed hurricane-force winds of up to 70 kt around the west and northwest sides of the center. There was little ship data around this system. The storm then moved north along 160W before turning northwest into the Bering Sea and weakening on 29 October.
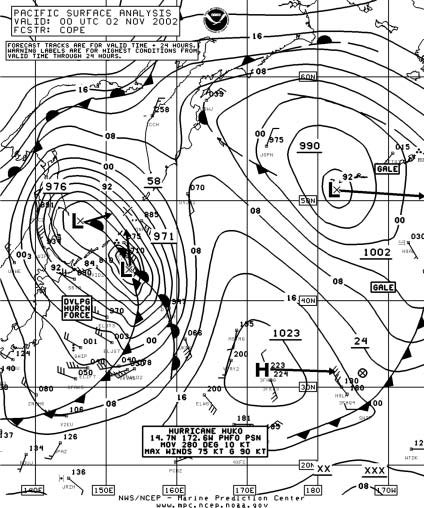
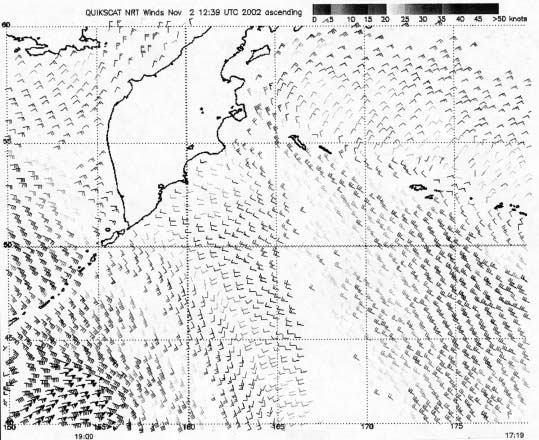
Western Pacific Storms, early November: Low pressure developed just south of Japan at 0000 UTC 1 November and instead of heading east or northeast like preceding October systems, turned north while rapidly deepening, becoming a compact 971- hPa low 24 hours later (Figure 4) Figure 5 is a QuikSCAT pass taken about five hours prior, suggesting hurricane-force winds. The 90 kt wind barbs in Figure 5 may be unreliable, contaminated by heavy rain. At the time of the surface analysis in Figure 4, the Svend Maersk (OYJS2) just north of the center observed a southeast wind of 60 kt. The system then moved to 59N 153E at 1800 UTC 2 November, when it reached a maximum intensity of 958 hPa. The vessel UERK near 47N 141E reported a north wind of 60 kt, while DHOLN (33N 150E) observed south winds of 50 kt and 9.8-m seas (32 ft) at this time. The system then stalled and weakened near the Kurile Islands. Another low-pressure system followed on a similar track about a week later, developing a 956-hPa central pressure over the southeastern Sea of Okhotsk at 0000 UTC 10 November before stalling and weakening. The ship SIWN (47N 154E) reported southwest winds of 60 kt at 0000 UTC 10 November.
|
Eastern Pacific Storm 4-16 November: This low formed about 600 nmi east of Japan early on 4 November and tracked east near 45N with gradual intensification, becoming a hurricane-force low near 46N 145W at 1800 UTC 6 November. The lowest central pressure was 952 hPa when the center was at 47N 142W at 0600 UTC 7 November. Six hours later, NOAA Buoy 46006 near 41N 137W observed west winds of 43 kt with gusts as high as 58 kt and seas as high as 14.0 m (46 ft). To the east, NOAA buoy 46002 near 42N 130W reported southwest winds of 31 kt with gusts to 49 kt and seas of 12.5 m (41 ft) at 2100 UTC 7 November. The storm then drifted north and slowly weakened, before dissipating west of the Queen Charlotte Islands on the 11th. At that time a second low formed to the south near 39N 143W (996 hPa) and moved northeast to 51N 135W at 1200 UTC 12 November (971 hPa), when the Westwood Borg (LAON4) reported a southeast wind of 70 kt near 52N 131W. This system then moved into the Gulf of Alaska and weakened on the 13th. Another low followed on the 15th and 16th, moving into the coast of British Columbia with a 982-hPa central pressure on 16 November.
North Pacific Storm of 15-18 November: A developing low moved northeast from the Kurile Islands on the 15th and developed into a compact hurricane-force storm (968 hPa) near 49N 171E at 0600 UTC November 17. The SeaLand Argentina (DGVN), near 46N 170E, encountered west winds of 65 kt at that time. The system developed a 961-hPa central pressure near the eastern Aleutians early on the 18th before turning north and weakening by 20 November.
North Pacific Storm 21-23 November: This low underwent impressive intensification, starting as a weak 1015-hPa low near 37N 148E at 0000 UTC 21 November and, after absorbing another low to the north, deepened to 972 hPa near 49N 159E at 0000 UTC 22 November. This was a drop of 43 hPa in central pressure in 24 hours. The center reached a maximum intensity of 966 hPa near 49N 161E at 0600 UTC 22 November. QuikSCAT data obtained about 18 hours later showed a swath of 50 to 65 kt winds southwest of the center. The storm then drifted southeast and weakened to a gale by 24 November.
North Pacific Storm 1-5 December: This developing low moved northeast from south of Japan and accomplished much of its intensification in the 24-hour period ending at 0000 UTC 3 December. The system developed into a hurricane-force low near 43N 176E (970 hPa) at 1200 UTC 3 December.
The ship ELXZ9 near 39N 171E reported a west wind of 60 kt at that time. Scatterometer data (QuikSCAT) for 0700 UTC that day showed winds as high as 75 kt south of the center near 38N. The system turned north and weakened rapidly after reaching 48N 171W, with a 963-hPa central pressure at 0000 UTC 5 December.
Western Pacific Storm 10-12 December: Two lows, one near the Kurile islands and the other to the south near 39N at 1200 UTC 10 December, merged to form a compact 970-hPa hurricane-force low near 48N 161E at 1800 UTC 11 December. The ship C6NI7 west of the center near 47N 156E observed west winds of 65 kt. QuikSCAT data taken near that time revealed winds as high as 70 kt south of the center near 45N. The system subsequently moved east and weakened, and dissipated south of the eastern Aleutians on 13 December.
|
Figure 6. OPC North Pacific Surface Analysis charts (Part 1) valid 0000 UTC 13 December and 1200 UTC 14 December 2002. |
Eastern Pacific storms 11-16 December: A series of fast-moving lows and trailing fronts affected the waters off the U.S. Pacific Northwest and British Columbia. The 36-hour period shown in Figure 6 is an example of a portion of this active pattern. The 972-hPa hurricane-force low near 44N 155W had a report from the SeaLand Eagle (V7AZ8) to the south of the center with a west wind at 75 kt. This report appeared reliable and supported by scatterometer data. The low moved northeast and became the 955-hPa low off Vancouver Island in the second part of Figure 6. Meanwhile a secondary storm formed to the southeast (969 hPa) and moved north, and yet another developing storm appeared well to the west, heading east. The secondary low intensified to 952 hPa near 52N 136W at 0600 UTC 15 December before moving north and weakening. The developing storm (987 hPa) in the second part of Figure 6 deepened to 960 hPa near 49N 131W 36 hours later. The Westwood Marianne (C6QD3) near 49N 127W reported a south wind of 65 kt at 0000 UTC 16 December, while SCFH to the south near 36N 133W observed south winds of 60 kt. NOAA Buoy 46022 (40.7N 124.5W) reported the highest wind among buoys, a southeast wind of 49 kt with gusts to 60 kt at 1600 UTC 14 December, with a peak gust of 66 kt. Destruction Island near the Washington coast reported a southeast wind of 53 kt with gusts to 64 kt at 1700 UTC 14 December, and a peak gust of 75 kt one hour later. NOAA Buoy 46002 (42.5N 130.3W) reported seas as high as 11.5 m (38 ft) at 1900 UTC 15 December.
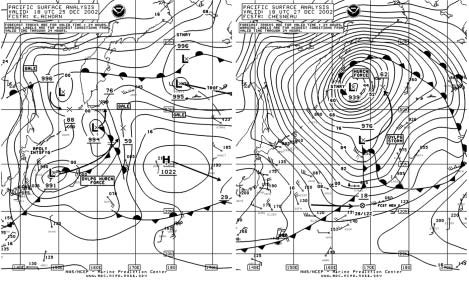 |
Figure 7. OPC North Pacific Analysis charts (Part 2) valid 1800 UTC 25 and 27 December 2002. |
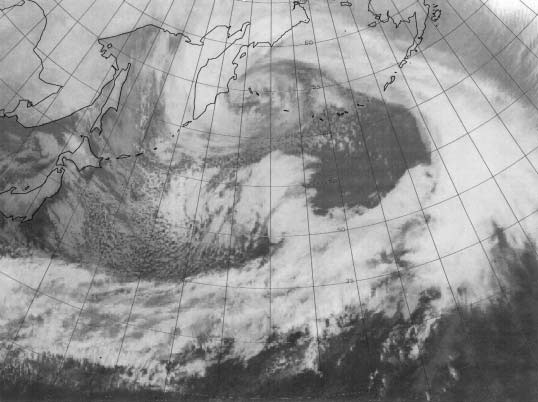
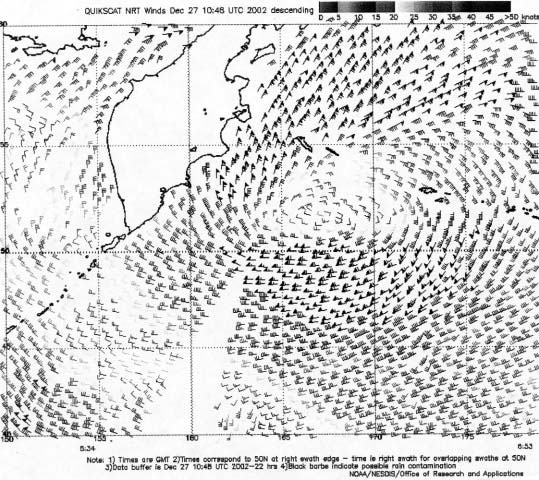
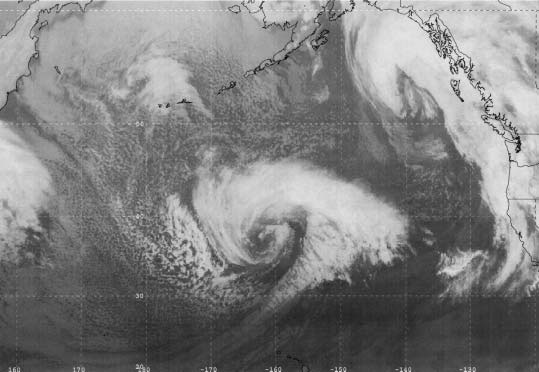
Western Pacific/Bering Sea storms, late December: Two intense lows, both with central pressures below 950 hPa, developed in the western North Pacific and Bering Sea after mid-December. The first formed near Japan on the 16th and moved northeast, developing a lowest pressure of 946 hPa near 54N 175E at 1800 UTC 18 December. The President Grant near 39N 161E reported west winds of 60 kt at 1800 UTC 17 December. At 0600 UTC 19 December, the Polar Eagle (ELPT3) observed west winds of 60 kt near 54N 179W. The low then turned northwest and weakened. The following low was stronger and followed a similar track as shown in Figure 7, over a 48-hour period ending at 1800 UTC 27 December. The period of most rapid intensification was from 0000 UTC 26 December to 0000 UTC 27 December when the central pressure dropped 41 hPa. The second part of Figure 7 shows the low at maximum intensity with a pressure of 939 hPa, the lowest pressure reached by any non-tropical low during the six-month period in either ocean. The satellite image in Figure 8 shows the low at maximum intensity, with high topped clouds wrapping around the center and a cloud system covering much of the North Pacific west of 150W. The ship PCIM at 49N 160E observed a west wind of 50 kt at 0600 UTC 27 December. On the other hand, the QuikSCAT image in Figure 9 taken about at the same time shows numerous wind barbs in the 60 to 70- kt range around the north, northwest and south sides of the center, in an area of sparse ship observations. The low subsequently drifted southwest and weakened.
|
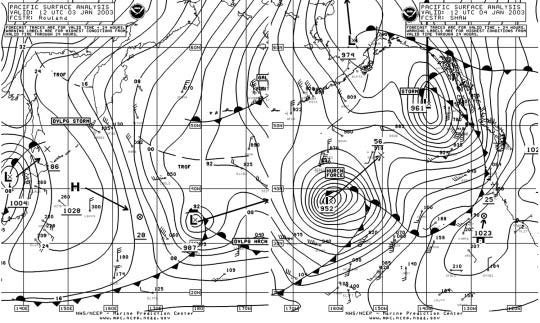 |
Figure 10. OPC North Pacific Surface Analysis charts valid 1200 UTC 3 January (Part 2) and 1200 4 January (Part 1) 2003. |
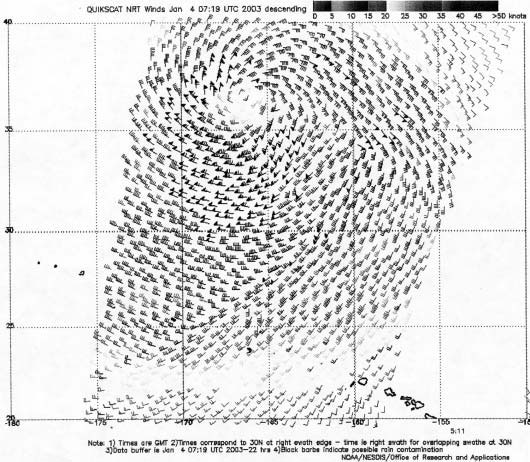
North Pacific Storm of 3-5 January: The southern branch of the jet stream was active from January into the first half of February, contributing to several storms that produced hurricane force winds. The strongest of these tracked east along 35N and developed storm force winds upon reaching the dateline, and then hurricane-force winds by 0600 UTC 4 January as the center reached 37N 166W with a 956-hPa central pressure, down 39 hPa from 24 hours prior. This was an unusually deep low and rapid rate of deepening given the relatively far south location. Figure 10 depicts the low during rapid development. The impressive satellite image in Figure 11 shows a well-defined circulation of cold-topped clouds around the center and general comma-shaped cloud pattern, much more compact than the late December storm. Available ship data were around the periphery of the low and had winds mostly 50 kt or less. The QuikSCAT image in Figure 12 reveals winds as high as 85 kt south of the center near 34N. The cyclone subsequently turned north-northeast with a gradual weakening trend, and moved into mainland Alaska early on 6 January.
|
North Pacific Storm 16-20 February: This system started on a southern track similar to that of the early January storm, but due to increased blocking over the eastern Pacific, was forced to turn north along the dateline (Figure 13). The central pressure bottomed out at 950 hPa near 47N 179W at 1200 UTC 18 February. The highest wind reported by a ship was a west wind of 55 kt from LAJV4 (42N 178W) at 0000 UTC 20 February. A QuikSCAT image taken about four hours after the map time of Figure 13 showed a small area of winds 65 to 70 kt south of the center. The system weakened after 0000 UTC 19 February and then dissipated over the Bering Sea on 22 February.
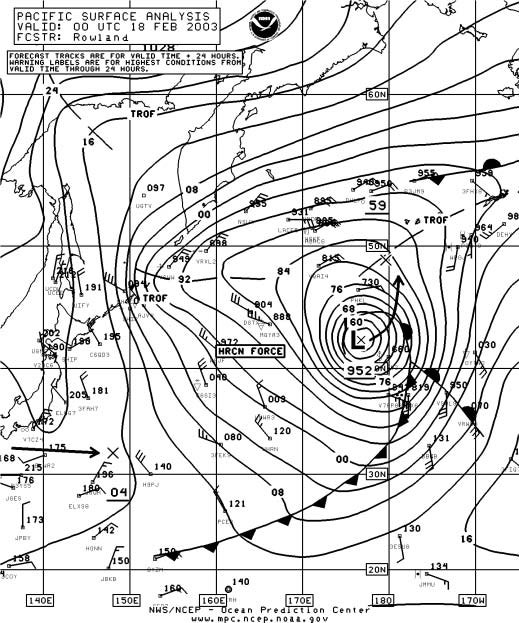 |
Figure 13. OPC North Pacific Surface Analysis chart (Part 2) valid 0000 UTC 18 February 2003. |
Page last modified: