Eastern North Pacific Hurricane Season of 2002
John L. Beven II and James L. Franklin, Hurricane SpecialistsTropical Prediction Center, National Hurricane Center, Miami, Florida
 |
|
Figure 1. - Eastern North Pacific tropical storms and hurricanes of 2002. |
Introduction
Tropical cyclone activity in the eastern North Pacific hurricane basin was below average in the year 2002. There were 12 cyclones of at least tropical storm strength, and 6 of these became hurricanes (Table 1 and Figure 1). The seasonal averages are fifteen named storms and 9 hurricanes. Although the total of six hurricanes was below normal, there were five "major" hurricanes, one above the long-term average of four (a major hurricane has maximum 1-min average winds greater than 95 kt, corresponding to Category Three or higher on the Saffir-Simpson Hurricane Scale). Overall activity was fairly evenly distributed over the nominal 15 May - 30 November season, with tropical cyclones forming in each month. Kenna was the strongest hurricane of the season, with 145-kt peak winds. In addition to the 12 named tropical cyclones, there were 4 depressions that did not reach tropical storm strength.
Table 1. Eastern North Pacific Tropical Storms and Hurricanes of 2002.
| Name | Class* | Dates** | Max.
winds (kt) |
Min.
pressure (mb) |
Direct
deaths |
| Alma | Hurricane | 24 May - 1 June | 100 | 960 | |
| Boris | Tropical Storm | 9 - 16 June | 50 | 997 | |
| Cristina | Tropical Storm | 9 - 16 July | 55 | 994 | |
| Douglas | Hurricane | 20 - 26 July | 90 | 970 | |
| Elida | Hurricane | 23 - 30 July | 140 | 921 | |
| Fausto | Hurricane | 21 Aug. - 3 Sep. | 125 | 936 | |
| Genevieve | Tropical Storm | 26 Aug. - 6 Sep. | 60 | 989 | |
| Hernan | Hurricane | 30 Aug. - 6 Sep. | 140 | 921 | |
| Iselle | Tropical Storm | 15 - 20 Sep. | 60 | 990 | |
| Julio | Tropical Storm | 25 - 26 Sep. | 40 | 1000 | |
| Kenna | Hurricane | 22 - 26 Oct. | 145 | 913 | 4 |
| Lowell | Tropical Storm | 22 - 31 Oct. | 45a | 1002 |
* Tropical Storm: wind speed of 34-63 kt. Hurricane: wind speed of 64 kt or higher.
**Dates begin at 0000 UTC and include tropical depression stage(wind speed less than 34 kt)
aLowell's peak intensity was attained west of 140 ° W Longitude, in the central Pacific
hurricane basin.
Eastern North Pacific tropical cyclones were directly responsible for 4 deaths in 2002; these resulted from Hurricane Kenna, which made landfall north of Puerto Vallarta, Mexico near San Blas in late October. Tropical Storm Julio also made landfall in Mexico, and rains from Tropical Storm Boris caused damage even though the center of Boris remained offshore.
Individual Named Storms
Hurricane Alma originated from a tropical wave that moved across west coast of Africa on 8 May. The system developed into a tropical depression on 24 May about 485 nmi south-southeast of Manzanillo, Mexico (Figure 1), then moved slowly westward and strengthened into a tropical storm two days later. Alma turned west-northwestward and became a hurricane on 28 May about 680 nmi southwest of Manzanillo. Alma then began moving northwestward and northward around the western periphery of a subtropical ridge centered over Mexico. The hurricane reached its peak intensity of 100 kt on 30 May (Figure 2). Alma then began to weaken as it started moving over cooler water and encountered southwesterly wind shear. The cyclone weakened to a tropical storm on 31 May and stalled as its deep convection diminished. The cyclone weakened to a depression and then dissipated on 1 June about 450 nmi southwest of Cabo San Lucas, Mexico.
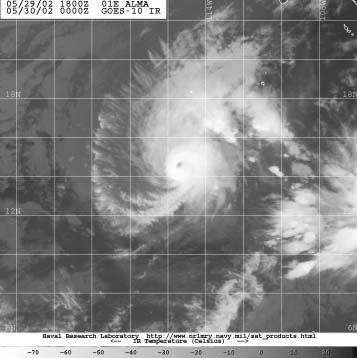 |
Figure 2. GOES-10 infrared image of Hurricane Alma at 0000 UTC 30 May 2002. |
Tropical Storm Boris developed from the interaction of an Atlantic tropical wave with a broad and persistent eastern North Pacific disturbance southwest of Acapulco, Mexico. The system became a tropical depression on 8 June about 150 nmi west-southwest of Acapulco (Figure 1). The depression reached tropical storm status, as well as its peak intensity of 50 kt, on the following day. Boris moved little on 9 June and began to weaken. On 10 June, Boris drifted to the northeast and then east, weakened back to a depression when it was located about 100 nmi south-southeast of Manzanillo. Boris degenerated to a non-convective remnant low on 11 June. The remnant low then moved southeastward and dissipated the following day. The P&O Nedlloyd Amazon (ELYL8) reported 39-kt winds and a 1003.8 hPa pressure at 2100 UTC 9 June. On l, the National Meteorological Service of Mexico and reported storm total rains of 6.43 inches in Michoacan and 5.13 inches in Jalisco. There were media reports that several homes in unspecified locations along the Mexican coast were damaged due to heavy rains from Boris. There are no known casualties.
Tropical Storm Cristina originated from an area of disturbed weather that was first identified near Panama on 6 July. The system became a tropical depression on 9 July about 300 nmi south of Acapulco, and then moved just north of due west for three days (Figure 1). Despite a seemingly hostile environment, the depression and strengthened to a tropical storm on 12 July. Cristina began to turn toward the north-northwest and slowly strengthened, reaching its peak intensity of 55 kt on 14 July. Shortly thereafter, Cristina weakened and turned to the west-northwest. By 16 July, Cristina had degenerated to a remnant low over colder water about 750 nmi west-southwest of Cabo San Lucas.
Hurricane Douglas first became a tropical depression about 395 nmi south of Manzanillo on 20 July (Figure 1). It became a tropical storm later that day. After moving generally northwestward, Douglas turned toward the west late on 21 July and strengthened into a hurricane. It reached its peak intensity of 90 kt on 22 July about 650 nmi south-southeast of Cabo San Lucas. Douglas moved west-northwestward gradually weakened over the next two days. Douglas degenerated into a remnant low about 1000 nmi east of Hawaii on 26 July just before entering the central Pacific hurricane basin.
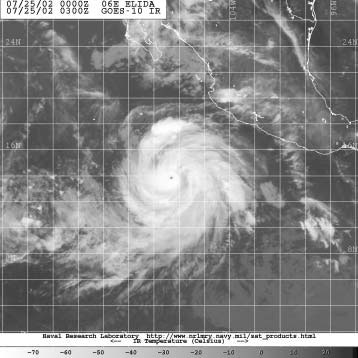 |
Figure 3. GOES-10 infrared image of Hurricane Elida at 0300 UTC 25 July 2002. (Image courtesy of the Naval Research Laboratory, Monterey, CA) |
Hurricane Elida was the first Category five (on the Saffir-Simpson Hurricane Scale) hurricane of the season, forming from a tropical wave that moved westward across the African coast on 13 July. A tropical depression formed on 23 July about 305 nmi south-southeast of Puerto Escondido, Mexico (Figure 1). The cyclone strengthened very rapidly as it moved westward, becoming a tropical storm on 23 July and a hurricane less than 18 hours later. Elida turned west-northwestward on 24 July while continuing to deepen rapidly, and reached its peak intensity of 140 kt on 25 July (Figure 3). The hurricane moved west-northwestward for the next two days, during which time it weakened back to a tropical storm. Elida weakened to a depression on 29 July, then became a non-convective remnant low the next day. The low dissipated late on 31 July about 465 nmi west of Los Angeles, California. A ship with the call sign H9LA reported 36-kt winds and an 1008.5 hPa pressure at 0000 UTC 24 July. While high swells from Elida likely affected portions of the coast of Mexico, the high winds and heavy rains stayed well offshore, there were no reports of damage or casualties.
Hurricane Fausto was a system which tracked from Africa nearly to Alaska. Fausto developed from a tropical wave that crossed the west- African coast on 11 August. Ten days later the system became a tropical depression about 400 nmi south-southwest of Manzanillo (Figure 1). The depression initially moved westward and became a tropical storm on 22 August. Fausto turned to the westnorthwest and steadily strengthened, becoming a hurricane later that day about 565 nmi south-southwest of Cabo San Lucas. Additional strengthening brought Fausto to its peak intensity of 125 kt on 24 August (Figure 4). Weakening began the next day, and Fausto became a tropical storm again on 26 August. Fausto's large circulation was slow to spin down; winds did not fall below tropical storm strength until 28 August, shortly after Fausto crossed 140 W longitude into the central Pacific hurricane basin. Fausto became a remnant low later that day. The low continued westward, passing about 430 nmi north of the Hawaiian Islands on 30 August. During the day the surface circulation passed underneath an upper-level low, redeveloped deep convection, and became a tropical depression again. Fausto moved to the west-northwest on 31 August, strengthened, and became a tropical storm on 1 September. The next day, Fausto turned north and accelerated ahead of a mid-latitude frontal system. Fausto was absorbed by an extra tropical low early on 3 September about 600 nmi south of the Aleutian Islands. The Jon Lonn (PFEW) reported 35-kt winds at 0000 UTC on 24 and 25 August.
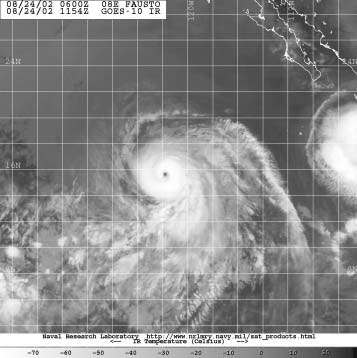 |
Figure 4. GOES-10 infrared image of Hurricane Fausto at 1154 UTC 24 August 2002. |
Tropical Storm Genevieve formed from a tropical wave. It first became a depression on 26 August about 500 nmi south of Cabo San Lucas, and became a tropical storm one day later (Figure 1). Genevieve was approaching hurricane strength on 28 August, with maximum winds of 60 kt when it turned to the northwest passed over cooler waters. Genevieve degenerated to a non-convective remnant low about 960 nmi west-northwest of Cabo San Lucas on 1 September.
Hurricane Hernan, the second of the season's three Category 5 (on the Saffir-Simpson Hurricane Scale) hurricanes, appears to have developed from a weak tropical wave that crossed the African coast on 16 August. The system developed into a tropical depression on 30 August about 340 nmi south-southeast of Manzanillo (Figure 1). Moving west northwestward for five days and northwestward thereafter, Hernan had an uncomplicated life cycle. After genesis, the cyclone strengthened steadily, with maximum winds reaching 140 kt on 1 September, an increase of 110 kt in 54 hours (Figure 5). This was followed by steady decay. By 6 September Hernan degenerated to a remnant low about 780 nmi west of Cabo San Lucas. The remnant low drifted southwestward until it dissipated on 9 September. The Eemsgracht (PDXQ) reported 37-kt winds at 0300 UTC 31 August, while the Zim Europa (4XFN) reported 36-kt winds three hours later. The center of Hernan passed about 90 nmi south of Socorro Island on 1 September while near peak intensity. No reports were received from the island regarding conditions experienced there.
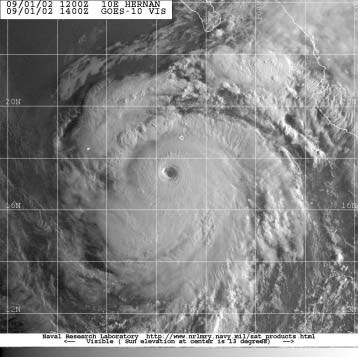 |
Figure 5. GOES-10 visible image of Hurricane Hernan at 1400 UTC 1 September 2002. (Image courtesy of the Naval Research Laboratory, Monterey, CA). |
Tropical Storm Iselle formed from a tropical wave that crossed the west coast of Africa on 31 August. On 15 September the system became a tropical depression about 270 nmi south of Manzanillo (Figure 1). The depression moved west-northwestward and strengthened into a tropical storm on 16 September. Iselle moved northwestward for the next 3 days and gradually strengthened, eventually reaching a peak intensity of 60 kt late on 17 September. Shortly thereafter, the storm made a sharp turn to the northeast. Vertical wind shear increased, and Iselle rapidly weakened, becoming a tropical depression on 19 September while located about 80 nmi southwest of Puerto Cortes, Mexico. Iselle degenerated into a nonconvective low early on 20 September, and the circulation dissipated later that day. There were no ship reports of tropical storm winds from Iselle that were considered reliable. On l, Manzanillo reported a 40-kt sustained wind at 2300 UTC 15 September. Iselle briefly produced locally heavy rainfall across the southern third of the Baja California peninsula on 19 September, but rainfall totals appeared to be generally less than 2 inches. There were no reports of damage or casualties.
Tropical Storm Julio, the first of two landfalling tropical cyclones in 2002, formed from a persistent area of monsoon- like disturbed weather near the west coast of Mexico. The system gradually organized and developed into a tropical depression on 25 September about 175 nmi southwest of Acapulco (Figure 1). The depression moved northward and strengthened into a tropical storm later that day, then reached a peak intensity of 40 kt prior to landfall on the Mexican coast just west-northwest of Lazaro Cardenas early on 26 September. A subsequent northwestward motion took the center over the mountains of southwestern Mexico, where the system dissipated north of Manzanillo. There were no ship reports of tropical storm force winds from Julio. On the coast, Zihuatanejo, Mexico reported a sustained wind of 35 kt with a gust to 45 kt at 2042 UTC 25 September. Julio caused locally heavy rains and gusty winds over portions of the southern coast of Mexico, and there were media reports of damage to homes from flash floods. There were no reports of casualties.
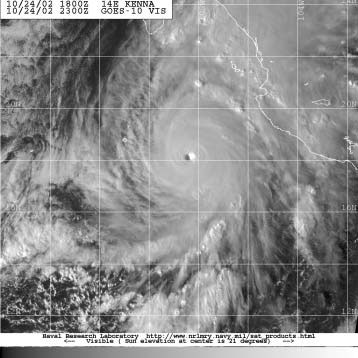 |
Figure 6. GOES-10 visible image of Hurricane Kenna at 2300 UTC 24 October 2002. (Image courtesy of the Naval Research Laboratory, Monterey, CA.) |
Hurricane Kenna, the last and strongest of the eastern North Pacific hurricanes of 2002, developed from a disturbance that moved westward across Central America and entered the eastern North Pacific basin on 19 October (Figure 1). The system became a tropical depression on 22 October about 325 nmi south of Acapulco, moved westward, and quickly reached tropical storm and strength. Kenna became a hurricane about 400 nmi south of Cabo Corrientes, Mexico, late on 23 October. Kenna continued to strengthen on 24 October, with its heading turning to the northwest and then north late in the day and its forward speed slowing. Late that day, roughly 24 hours after reaching hurricane strength, reports from a reconnaissance aircraft indicated that Kenna's winds had reached 140 kt, and its minimum pressure had fallen to 917 hPa (Figure 6). The flow ahead of a large mid- to upper-level trough west of Baja California turned Kenna to the northeast and beginning late on 24 October. As Kenna accelerated toward the coast of Mexico, the cyclone intensified slightly, and early the next day reached its peak intensity of 145 kt. At this time Kenna was only about 125 nmi west-southwest of Cabo Corrientes. Kenna continued to accelerate, and while still over warm waters it began to weaken under increasing shear. Kenna's convective activity increased in the hours just prior to landfall, and a reconnaissance aircraft reported extremely severe turbulence that was among the most intense ever experienced by the flight crew. The hurricane made landfall near San Blas, Mexico with winds near 120 kt at 1630 UTC 25 October. Kenna continued northeastward and weakened very rapidly over the mountains of Mexico; by early on 26 October it was a minimal tropical storm, and the closed surface circulation dissipated a few hours later. The remnants of Kenna moved into the northwestern Gulf of Mexico later that day, which enhanced rainfall in the southeastern United States. There were no ship reports of tropical storm or hurricane winds from Kenna. Few observations were available from the landfall area as well. At Tepic, in the state of Nayarit (located about 15 nmi inl) the highest measured sustained wind was 76 kt, with a storm total rainfall of 3.35 inches. Rainfalls of 4-10 inches occurred elsewhere across portions of the states of Colim and Nayarit. The Meteorological Service of Mexico estimates that the storm surge in San Blas was as high as 16 ft. Storm surge also affected Puerto Vallarta, but no measurements are available. There were reports of 10-ft waves rushing inl from the bay. Mexican authorities report four deaths from Kenna. There were media reports of over 100 injuries in San Blas and Puerto Vallarta from flying glass and other debris. All but roughly 200 of the 9000 residents of San Blas evacuated, likely accounting for the relatively low number of casualties. In Puerto Vallarta, the estimated $5 million of damage was attributed mainly to storm surge. There are no monetary estimates of damage in San Blas. However, media reports indicated that 80 to 90% of the homes were damaged or destroyed, and large commercial shrimp boats were dragged up to 300 yards from their docks. Kenna is the third strongest hurricane of record to have struck the west coast of Mexico. Only an unnamed hurricane in 1959 and Madeline in 1976 are known to have been stronger at the time of landfall.
Tropical Storm Lowell originated from a westward-moving disturbance that entered the eastern North Pacific basin on 12 October. On 22 October the system became a tropical depression about 1380 nmi southwest of Cabo San Lucas (Figure 1). After briefly drifting north, the depression moved westward and strengthened to a 40-kt tropical storm the following day. Southwesterly vertical wind shear caused Lowell to weaken back to a depression on 24 October. Lowell crossed 140 W longitude into the central Pacific hurricane basin on 26 October. On 27 October as the vertical wind shear lessened, Lowell regained tropical storm strength. Lowell reached its peak intensity of 45 kt on 28 October about 700 nmi east-southeast of the Hawaiian Islands. Lowell then turned to the west-southwest began to weaken, becoming a tropical depression again on 29 October, and dissipating two days later.
Tropical Depressions
Four other tropical depressions occurred in the eastern North Pacific during 2002 (Figure 7). Tropical Depression Three-E existed from 27-29 June far away from l. Tropical Depression Seven-E was tracked from 6-8 August, also well away from l. The last cyclone of the season, Tropical Depression Sixteen-E, existed from 14-16 November well south and southwest of Cabo San Lucas. The other cyclone, Tropical Depression Eleven-E, formed on 5 September about 120 nmi southwest of Cabo Corrientes. Watches and warnings were posted along portions of the Mexican coast in anticipation of strengthening that didn't occur. The system weakened to a remnant low on 8 September and dissipated just west of southern Baja California two days later.
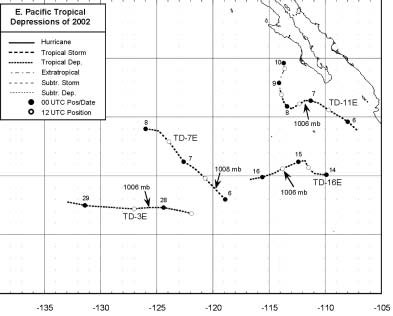 |
Figure 7. Eastern North Pacific Tropical Depressions of 2002. |
Page last modified: