Mean Circulation Highlights and Climate Anomalies September 2002 through February 2003
A. James Wagner
Senior Forecaster, Climate Operations Branch
Climate Prediction Center /NCEP/NWS/NOAA
September - October 2002
The mean mid-tropospheric circulation during the early fall months was characterized by above-normal heights over most of the Arctic Basin, with lobes extending into the northern Gulf of Alaska and the North Atlantic over eastern Greenland and Iceland. Below-normal heights prevailed at middle latitudes over most of the Northern Hemisphere, with troughs located over the western and central Pacific, central North America, eastern Atlantic, and southeastern Europe and the Ukraine. The two-month average map does not adequately reflect the somewhat different patterns that prevailed before and after the circulation changed quite abruptly in the first half of October. Above normal heights were associated with a continuation of summer warmth over eastern and northern Europe and the eastern U.S. during September and the first week of October, but the area of blocking retrograded from Europe to Iceland and eventually Greenland during October, while troughs deepened over the central U.S. and the central Atlantic. This dramatic change, which was reflected in a near-record low value of North Atlantic Oscillation (NAO) Index, occurred at the same time that the nights became noticeably longer than the days, resulted in dramatic changes in the temperature over both the U.S. and Europe. The normal seasonal cooling trends were accentuated by the rapid replacement of well above normal temperatures by significantly below normal values within a period of just a few weeks.
El Nino continued to develop over the Pacific Ocean, and tropical precipitation patterns over the Pacific were typical for this phase of the phenomenon, being abnormally dry over much of Indonesia and Australia and wetter than normal near the date line. Its influence was also becoming evident on the circulation over both the Pacific and Atlantic oceans away from the tropics in the form of stronger than normal subtropical westerlies. Although sea surface temperatures were above normal over much of the subtropical Atlantic, Caribbean and Gulf of Mexico and the number (12) of named tropical storms developing was two more than normal, the number (4) reaching hurricane intensity was two fewer than normal, and only two of these reached major hurricane status (Category 3 or stronger). Stronger than normal subtropical westerlies tended to shear apart or at least weaken most of the storms before they became very intense. Nevertheless, the eight named tropical systems that formed during September was a record for any calendar month, making up for the fact that the first storm of the season reaching hurricane intensity did not occur until Sept. 11, the latest date for this since 1941. Two of the hurricanes, Isidore and Lili, made landfall along the Gulf coast of the U.S. Their size, intensity, and relatively slow motion contributed to the extensive area of below normal sea level pressure over the southern U.S. and the Gulf of Mexico shown on the map. Moisture brought into the U.S. mainland from these and other storms began to provide welcome relief from the long multi-season drought in many areas of the South and Southeast.
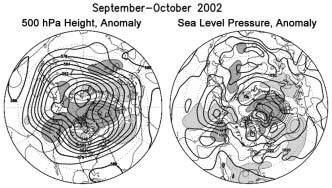 |
The chart on the left shows the seasonal mean sea level pressure at four hPa intervals in heavy solid lines, labeled in hPa. Anomalies of Sea Level Pressure (SLP) are contoured in dashed lines and labeled at two hPa intervals, with heavy shading and light solid lines in areas greater than two hPa above normal, and light shading and light dashed lines in areas more than two hPa below normal. |
November - December 2002
The mean circulation over the Northern Hemisphere during the last two months of 2002 could be described simply as having stronger than normal westerlies south of normal over most of the hemisphere, with widespread blocking at high latitudes. The entire Arctic Basin, North Atlantic, and northwestern Canada had well above normal mid-tropospheric heights, but sea level pressure was above normal at high latitudes, mostly only on the Eurasian side of the Hemisphere. Scandinavia and parts of northern Europe were especially cold and drier than normal. Storms tracked well south of normal all the way across the Atlantic, and continued on into the Mediterranean Sea instead of turning northeastward towards Iceland and northen Europe, as is the norm for the majority of them usually do. The strong negative anomaly centers on both the 500-mb height and the sea level pressure maps just west of the Bay of Biscay were associated with recurrent intense storms, one of which split and eventually sank a large oil tanker early in November.
Below-normal heights and sea level pressure dominated the entire Pacific Basin at middle latitudes, a pattern often observed with El Niño. The strong ridge over northwestern Canada deflected many of the Pacific storms northward toward Alaska, which experienced the beginning of an unusually mild winter. At the same time, this ridge, along with the broad trough across the Atlantic, served to deflect cold air southward from the Canadian Arctic into the eastern part of the United States, which began to experience the first of several consecutive noticeably colder than normal months.
El Niño continued over the equatorial Pacific, and the southward displaced Aleutian Low and strong westerlies and associated active storms were typical atmospheric responses during the cold season that have accompanied El Niño events in the past. However, the ridge over western North America tended to block or deflect many of the storms before they reached California, resulting in less rainfall in the Southwest than had accompanied most past El Niños. Although the cold air from Canada contributed to an early onset to the winter snow season over the central and eastern U.S., it tended to allow less moisture into the U.S., and some parts of the Great Plains and Midwest experienced record and near-record dryness.
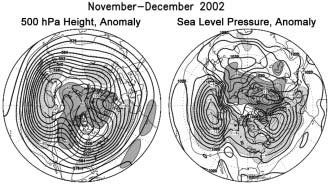 |
The chart on the left shows the seasonal mean sea level pressure at four hPa Pressure (SLP) are contoured in dashed lines and labeled at two hPa intervals, with heavy shading and light solid lines in areas greater than two hPa above normal, and light shading and light dashed lines in areas more than two hPa below normal. |
January - February 2003
Many of the large-scale average features of the circulation during the two mid-winter months did not change much from the previous two months. Stronger than normal westerlies continued across middle latitudes of both the Pacific and the Atlantic, although the Bermuda-Azores ridge strengthened somewhat during the first two months of 2003. Blocking continued over the northeastern Atlantic and northern Europe, although it was not as strong as during the previous period. The ridge near the west coast of North America strengthened, and the broad trough over the Atlantic became somewhat more localized over the western part of the ocean. Above average storminess continued over the Mediterranean Sea.
The average circulation for this two-month period showed a weakening of the North Atlantic and Arctic Oscillation (NAO and AO) patterns, although they were still in a negative phase most of the time. Although El Niño began to noticeably weaken, especially over the eastern equatorial Pacific, the positive phase of the Pacific-North American pattern (PNA) which has been associated with many past El Niño events became more prominent, especially during January, resulting in record high temperatures in much of the West late in the month, while at the same time the eastern U.S. was cold and dry with repeated outbreaks of Arctic air. Unusually mild weather continued in Alaska, resulting in one of the mildest winters on record in that state. The strong ridge along the West Coast also prevented most Pacific storms from approaching the California coast until the middle of February, resulting in an unusually long dry period there, where El Niño winters are characteristically wetter than normal. However, when the ridge weakened in the middle of February, Pacific storms again began to bring heavy rains to California and move inland. One of these systems redeveloped over the central and eastern U.S. and brought record and near-record amounts of snow and sleet to the Northeast as it moved slowly eastward to the south of a massive Arctic High over southeastern Canada. The upper level disturbance associated with this storm could be traced all the way across the Atlantic and the Mediterranean, where it again interacted with abnormally cold air and produced an unusual heavy snowfall in parts of Israel and adjacent countries in the Mideast.
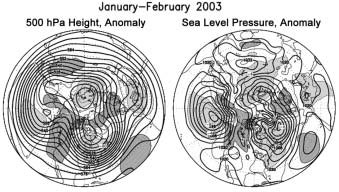 |
The chart on the left shows the seasonal mean sea level pressure at four hPa intervals in heavy solid lines, labeled in hPa. Anomalies of Sea Level Pressure are contoured in dashed lines and labeled at two hPa intervals, with heavy shading and light solid lines in areas greater than two hPa above normal, and light shading and light dashed lines in areas more than two hPa below normal. |
Page last modified: