The Great Waterspout Outbreak of 2003
Wade Szilagyi, Program Manager Meteorologist, Meteorological Service of Canada, TorontoAbstract
|
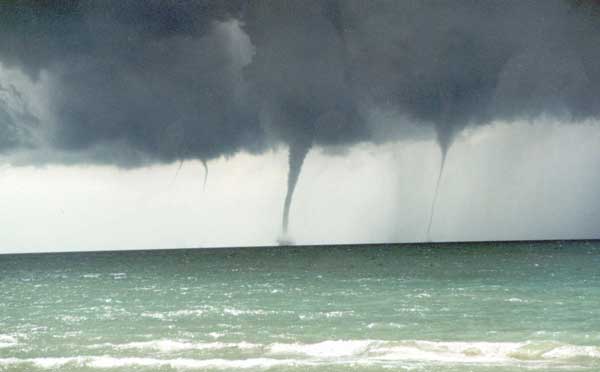
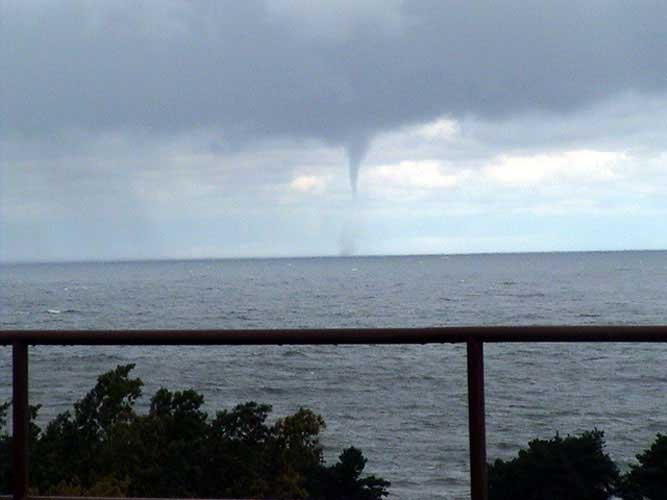
A family of four waterspouts over Lake Huron near
Kincardine, Ontario, Canada on 9 September, 1999. |
The period from 27 September to 3 October 2003 saw the largest waterspout outbreak over the Great Lakes in recorded history. In total, an unbelievable 66+ waterspouts were sighted! On one day alone, 21+ waterspouts were seen over Lake Ontario. One confirmed waterspout even made it to land, causing some shoreline damage. The outbreak period was 7 days, making it the longest lasting event. It was also the most photographed event with 67 photographs and 3 videos taken. The event was recognized well in advance; being forecasted 4 days ahead of time. The event's contribution to the year's total of 82 waterspouts was a record in itself. This was the largest number of waterspouts ever recorded in any year over the Great Lakes. An interesting fact is that if the event had not taken place, the 2003 waterspout season would have turned out to be the lowest on record.
This record-breaking event can be attributed to a cold air mass, with an associated major upper trough, which moved over the Great Lakes, remaining entrenched there for an entire week. Lake temperatures were also well above normal for that time of year. This combination turned the Great Lakes into a "natural laboratory" that generated multiple vortices on a daily basis.
Introduction
 |
Figure 1. Monthly waterspout frequency distribution. |
September is the peak month for waterspout activity over the Great Lakes (Figure 1). During this period an average of 15 waterspouts are usually sighted. However, up until the last few days of September 2003, only 6 sightings were reported. As with the year before, it looked like there would be little in the way of waterspouts.
The water temperatures of the Great Lakes were well above average for that time of year. This was as a result of a warmer than average summer that the region experienced. Interesting enough, warm water temperatures are one of the favourable conditions for waterspout development, yet few occurred. The same pattern was also seen the previous year with water temperatures well above normal, but with waterspout sightings well below the average. The reason for this was that the main jet stream was well to the north of the Great Lakes. As a result, few cold air outbreaks occurred. This meant that conditions were generally stable over the Great Lakes. Stable conditions are not conducive to waterspout development (See section on "Atmospheric stability"). However, things were to change in the last days of September 2003.
Synoptic Situation
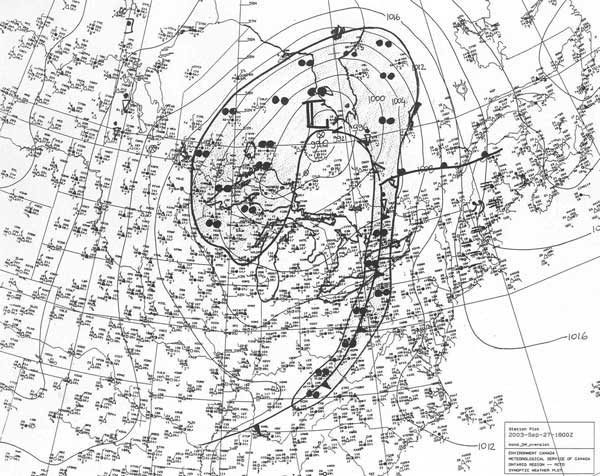
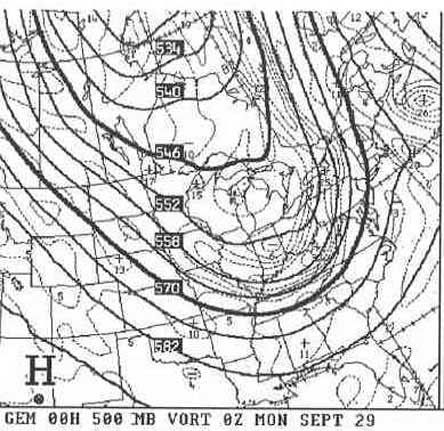
The onset of the outbreak was brought on by the flood of cold air in the wake of the passage of a cold front (Figure 2). This cold front would be the last major surface synoptic feature that the region would see until the end of the outbreak period 7 days later. Also present, was an exiting surface low over northeastern Ontario. Farther to the west, to the lee of the Rockies, a major northwest to southeast ridge was building in. This ridge would be responsible for developing the "Pipeline to the Arctic", which is a stream of cold air whose source is over the Arctic region. In the upper atmosphere, a major trough established itself over the region (Figure 3), remaining there for the next week.
|
|
The outbreak period would also see the set up of several lines of showers and embedded thunderstorms over the Great Lakes (Figure 4). It was along these convergent lines that the majority of waterspouts were sighted. On October 1, one convergent line produced more than 12 waterspouts. Of these, 7 in a row were seen at the same time!
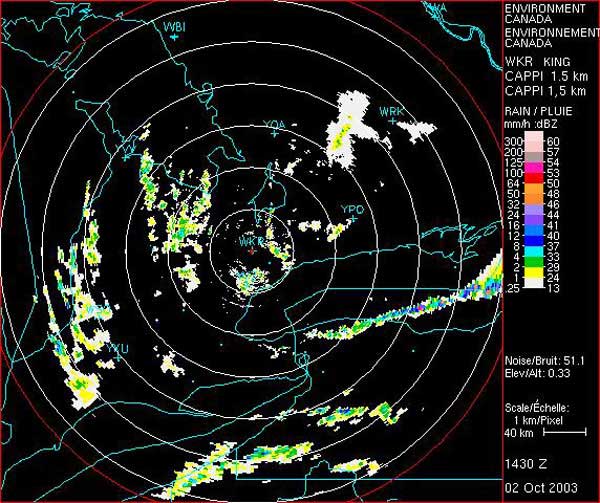 |
Figure 4. CAPPI 1.5 km King radar 1430 UTC 2 October 2003. |
On October 2, an interesting event took place over eastern Lake Ontario. A northeast to southwest convergent line of showers and embedded thunderstorms had set up. At the same time, a northeast to southwest oriented surface trough was moving southward from Ontario over the lake. When the two features interacted, the convergent line intensified on radar (Figure 4). It was during this period that over 21 waterspouts were sighted!
The last day of this historic event occurred on October 3. By this time, the axis of the upper trough had moved off to the east of the Great Lakes. Also, warm air was moving into the region. This was in association with an approaching system from central Ontario. By October 4, conditions stabilized enough over the Great Lakes that no further waterspout sightings were reported.
Atmospheric stability
The passage of the cold front on September 27 resulted in a flood of cold air over the above seasonally warm waters of the Great Lakes. This resulted in unstable atmospheric conditions that would last for a week. The instability increased each day, reaching a peak on the days of October 1 and 2. On October 2, conditions were extremely unstable over Lake Ontario. On that day, clouds generated over the water reached 6,000 metres. A technique to forecast waterspouts, developed by the author, indicated that conditions were extremely favourable for waterspouts. More than 21 waterspouts formed along a convergent line on that day (Figures 4 and 5a)!
|
|
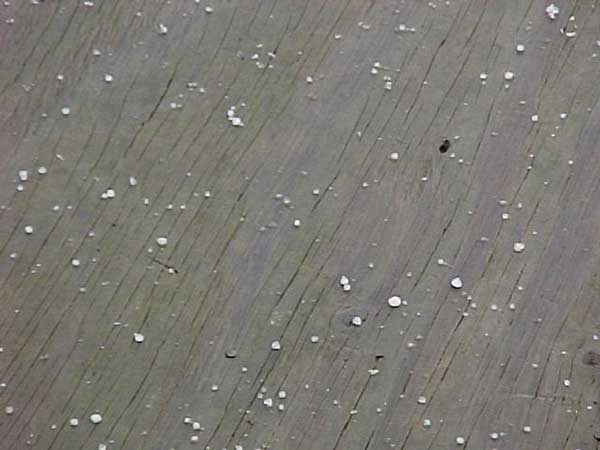
This same line also contained embedded thunderstorms (Figure 5b). Graupel (a form of frozen precipitation consisting of snowflakes or ice crystals and supercooled water droplets frozen together) were also observed from this line as it moved onshore (Figure 5c).
|
Figure 5c. Graupel produced from one of the convective clouds along the convergent line. Photo courtesy of S. Steiger. |
Acquisition of reports
The importance of networking for gathering reports cannot be overstated. Without the networking that took place during the outbreak, the total number of confirmed waterspout sightings would not have resulted in a record-breaking event. With networking, the total number of waterspouts confirmed was 66+. Without networking, the number would have been only 23+!
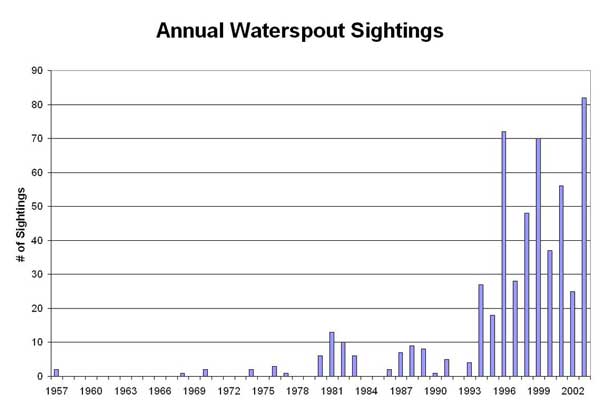 |
Figure 6. Annual confirmed waterspout sightings (1957-2003). |
Meteorologists are usually informed of waterspouts from a variety of sources such as ships, aircraft, weather watchers, Coast Guard, and the general public. Previous to 1994, little communication took place between weather offices with regards to the sighting of waterspouts. In 1994, the author initiated a waterspout research project; this resulted in the establishment of a networking process. This process opened up the lines of communication between weather offices from around the Great Lakes. When a report of a waterspout was received at a weather office, the weather centre in Toronto was notified. All waterspout reports from every weather office from around the Great Lakes were then compiled at this central location. Immediately, there was a dramatic increase in the number of confirmed waterspout sightings (Figure 6).
During the Outbreak of 2003, this networking process was enhanced by actively pursuing reports from secondary and tertiary sources. These new sources of information included students from Oswego College in NY, a helicopter traffic reporter from Cleveland, storm chasers from Ontario, Canada and New York, Ontario Parks staff, and private individuals.
Another enhancement to the networking process was the direct coordination with a storm chaser during the entire event. This individual dedicated each day to seeking out and reporting on any waterspouts. The individual was contacted on a daily basis and directed to the most probable location of waterspout development within his area. It is through these efforts that 7 additional waterspout reports were added to the total for the entire event.
Event Predictability
The first hint that a major waterspout event was to take place was 5 days in advance of the event itself. At that time, the Canadian 120 hour Global Weather Model depiction showed that a major upper trough was to establish itself over the region.
However, before this would occur, a smaller waterspout event was to take place.
On September 23, 4 days before the event, a change in air mass occurred with the passage of a cold front. An associated upper trough also moved over the region. The waterspout technique had predicted 2 days in advance that favourable conditions would exist for the formation of waterspouts. This is indeed what took place, with 2 waterspouts being sighted off of Lake Erie. Still on September 23, the Global Weather Model continued to indicate that a major upper trough was to move into the region starting on September 27. The model also indicated that this air mass would be even colder than the one associated with the waterspout event on September 23. Based on this evidence, it was concluded that a major waterspout outbreak would occur. This was 4 days in advance of the event!
On September 25, 2 days before the event, evidence of a major outbreak was even stronger when the waterspout technique indicated favourable conditions for waterspouts. Finally, on September 26, waterspouts were mentioned in meteorological discussion bulletins and included in the marine forecast for Lake Michigan the next day.
Event Summary
A summary of the record-breaking event as well as a comparison with the last major outbreak is given in Table 1.
| 1996 | 2003 | |
| # of Waterspouts | 41 | 66+ |
| Max. 1-day total | 26 | 21+ |
| Max. sighted at one time | 8 | 7 |
| Lead Time | 0 hours | 4 days |
| Outbreak Period | 6 days | 7 days |
| Pictures | 0 | 67 |
| Video | 0 | 3 |
| Storm Chasers Involved | 0 | 6 |
Table 1. A summary of the record-breaking waterspout outbreak of 2003 and a comparison with the last major outbreak that took place in 1996.
What stands out in the comparison between the two major events is that the lead-time for predicting such events has improved dramatically over the past 7 years. Also, photographic evidence of such events has improved.
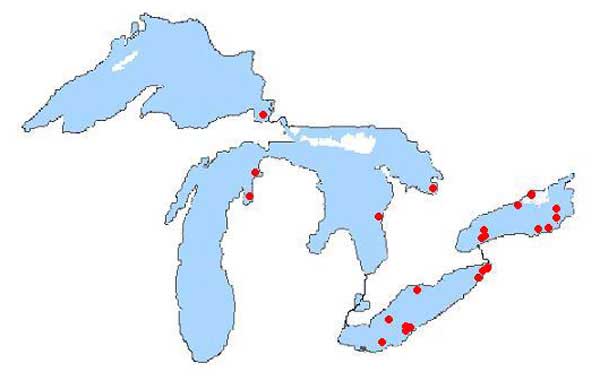
Figure 7 shows the spatial distribution of waterspout sightings over the Great Lakes during the record outbreak. It can be seen that the majority of the sightings occurred over Lakes Erie and Ontario. This was partly due to the geometric shape of each lake that allowed for convergent lines to set up. The other factor was that the events took place in a region where the population density was relatively high. Also, most sightings took place near communities. It should be noted that many convergent lines were observed on radar over Lake Huron and Georgian Bay (Figure 4). However, only 2 sightings were made from these areas during the entire outbreak period. This is an area of low population density. Waterspouts had likely occurred here as well.
 |
|
Figure 7. Location of waterspout sightings during the outbreak (27 September - 3 October 2003). Note that some location points had multiple sightings. |
To understand the scale of this historic event, a comparison must be made with a typical waterspout outbreak. Typically waterspout outbreaks last for about 24 hours with 5 waterspouts being sighted. The Great Outbreak of 2003 lasted almost 7 times longer than an average outbreak period. It also produced just over 13 times the number of waterspouts that would normally occur.
Conclusion
The Great Waterspout Outbreak of 2003 occurred due to a significant change in the upper air pattern that resulted in the movement of a cold air mass over the unseasonably warm waters of the Great Lakes. This created more than favourable conditions for waterspout formation that would last up to a week. The key to the longevity of the event was the entrenched major upper trough over the Great Lakes and the continuous supply of cool air from the Arctic region.
Atmospheric conditions were ideal for a record-breaking waterspout event to take place. However, there was a non-meteorological component that allowed for the confirmation of so many waterspout sightings resulting in such a record. This was the process of networking which took place within and outside the meteorological community. Without this process, which was developed during and after the event, the total number of confirmed waterspout sightings would have been far less. This networking process resulted in at least 43 additional waterspout reports!
Networking was so successful that a program called "The Waterspout Watch Program" will be developed in the near future. The program will consist of establishing a reporting mechanism that will notify various contacts from around the Great Lakes region when the potential for waterspouts will occur. These contacts will try to confirm any waterspouts during this period and report back to a central information managing authority.
Waterspout research has lead to a significant improvement in our understanding and ability to forecast waterspout events since 1994. There is no doubt that this trend will continue in the future. The establishment of the Waterspout Watch Program, improvements to the waterspout technique, and greater weather pattern recognition of waterspout outbreaks will ensure an improved level of skill in forecasting such events in the future.
Acknowledgements
Special thanks to Tom Niziol (Buffalo Weather Office) and Jack Kertzie (U.S. storm chaser) for going out of their way to observe and photograph waterspouts off of Lakes Erie and Ontario. I would also like to thank Rob Kuhn (Ontario Storm Prediction Centre), James Kosarik (Cleveland Weather Office), Steve Rowley (Gaylord Weather Office), David Andersen (The Plain Dealer) and Paul Vanderploeg (WTAM radio Cleveland) for supplying me with additional waterspout sighting information. Finally, special thanks to students Tracey Juda and Lance Glover as well as Prof. Scott Steiger of Oswego College for sending pictures and video.
Glossary
Upper trough - An elongated area of low atmospheric pressure which is generally located above 1500 m.
Surface trough - An elongated area of low atmospheric pressure which is generally located below 1500 m.
Jet stream - A relatively narrow band of high-speed winds, generally greater than 50 KT, found in the upper troposphere above regions of strong horizontal temperature contrasts such as fronts.
Cold air outbreak - An invasion of cold air over an area. Associated air temperatures are usually well below seasonal norms.
Stable conditions - Occurs when a rising air parcel becomes denser than the surrounding air. It will then return to its original position. Unstable conditions-Occurs when a rising air parcel becomes less dense than the surrounding air. Since its temperature will not cool as rapidly as the surrounding environment, it will continue to rise on its own.
Synoptic feature - A meteorological entity such as a high or low pressure system that covers a horizontal area of several hundred nautical miles. Pipeline to the Arctic-A stream of cold air whose source is over the Arctic region.
Convergent line - Wind movement that results in a horizontal net inflow of air into a particular region. Convergent winds at lower levels are associated with upward motion.
Graupel - A form of frozen precipitation consisting of snowflakes or ice crystals and supercooled water droplets frozen together.
Canadian 120 hour Global Weather Model depiction - The forecast weather map valid at 120 hours produced by the Global Weather Model which was developed and is used in Canada.
Meteorological discussion bulletin - An internal weather bulletin intended for meteorologists describing the current and future weather situation.
Page last modified: