Marine Weather Review-North Pacific Area
May through August 2004
By George P. Bancroft, National Center for Environmental Prediction
Introduction
The most active part of the North Pacific during this period was the west portion, both for tropical cyclones and non-tropical systems. Unlike in the North Atlantic, tropical activity in the western North Pacific was well distributed through the four-month period, with many of these cyclones recurving in the vicinity of Japan before entering the westerlies and becoming extratropical. Some of the tropical cyclones re-intensified into storm-force lows after becoming extratropical. Also, some of the non-tropical low-pressure systems of this period developed storm-force winds, primarily early in May and in August, in the western waters. The four-month period covered in this article, being the warm season, is the least active period for non-tropical low-pressure systems.
Tropical Activity
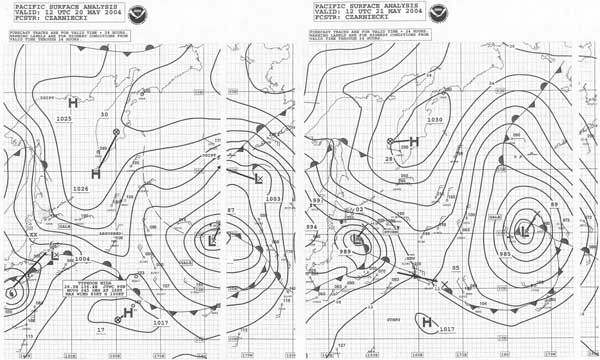 |
Figure 1. OPC North Pacific Surface Analysis charts (Part 2) valid 1200 UTC May 20 and 21, 2004. Typhoon Nida is shown becoming an extratropical storm. |
Typhoon Nida: Nida entered OPC's oceanic area for (Mercator) radiofacsimile charts near 29N 136E at 1200 UTC May 20 with maximum sustained winds of 80 KT and gusts to 100 KT. The cyclone moved northeast and weakened to a tropical storm six hours later. By 0600 UTC on the 21st Nida was about 250 nmi northeast of Tokyo with maximum winds 45 KT with gusts to 55 KT, about to become extratropical. Figure 1 shows Typhoon Nida approaching a frontal zone and becoming an extratropical storm at 1200 UTC May 21 east of Japan. While Nida was still a typhoon, the Mokihanai (WNRD) encountered southwest winds of 50 KT and 10.5 m seas (35 ft) near 22N 132E at 0000 UTC May 20. The vessel CMA CGM Alabama (DGGV) (24N 137E) reported south winds of 40 KT and 6.5 m seas (21 ft) six hours later. The Sea-Land Reliance (WFLH) reported east winds of 45 KT near 39N 149E at 0000 UTC on the 21st, and east winds at 50 KT near 41N 153E twelve hours later. The extratropical storm attained a central pressure of 988 hPa near 40N 148E at 1800 UTC May 21, when the President Jackson (WRYC) encountered east winds of 50 KT 60 nmi to the north. After that, the system that was Nida continued to move northeast and weakened.
Tropical Storm Omais: Omais followed Nida on a similar track south of Japan as a minimal tropical storm on May 21, with maximum sustained winds of 35 KT with gusts to 45 KT. The cyclone then weakened to a tropical depression near 21N 136E at 0600 UTC May 22, before becoming extratropical and merging with a frontal zone near 40N 150E two days later. By 0000 UTC May 27 the low-pressure area that was Omais redeveloped into a gale with a central pressure of 985 hPa just south of the western Aleutians. The system then tracked east-northeast, stalled and weakened in the central Gulf of Alaska late on May 29.
Super Typhoon Dianmu: Dianmu appeared on OPC's Mercator oceanic analysis area near 16N 135E, or 1000 nmi south of Japan, at 1800 UTC June 16 with maximum sustained winds of 155 KT with gusts to 190 KT, the strongest typhoon of the period. The cyclone then tracked west-northwest, west of the area while gradually weakening, before recurving to the northeast on the 20th and weakening to a tropical storm near the southwest coast of Japan at 1800 UTC on June 20. The President Trumani (WNDP) encountered southeast winds of 40 KT near 33N 136E six hours later. Dianmu then moved northeast into the Sea of Japan near 39N 138E at 1200 UTC on the 21st with maximum winds of 40 KT with gusts to 50 KT. The cyclone became an extratropical gale over northern Japan later on the 21st, followed by weakening in the Sea of Okhotsk on June 23.
The remains of Dianmu then dissipated over the northwest Bering Sea late on June 25.
Tropical Storm Mindulle: Tropical Depression 10W formed near 16N 144E at 0600 UTC June 23 and moved west-northwest, becoming Tropical Storm Mindulle six hours later with maximum sustained winds of 35 KT with gusts to 45 KT. The cyclone reached 17N 140E at 0000 UTC on the 24th before turning more southwest and passing west of 135E late on June 24, with maximum sustained winds of 55 KT with gusts to 70 KT.
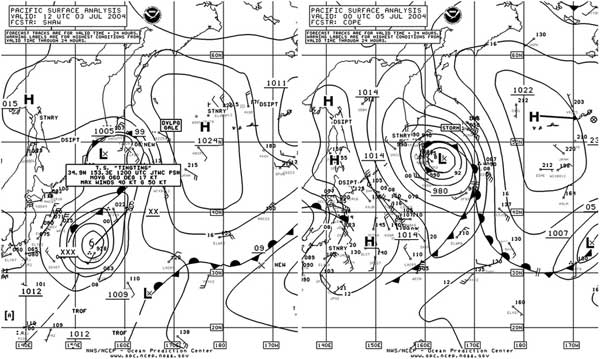
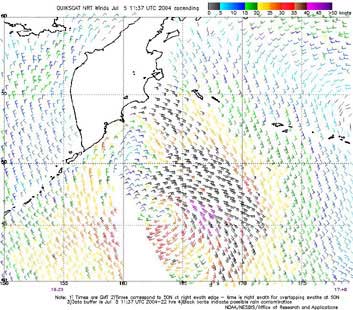
Typhoon Tingting: Tingting entered OPC's map area near 16N 146E as a minimal typhoon while moving northwest, and developed maximum sustained winds as high as 80 KT with gusts to 100 KT when the center was near 19N 144E at 1800 UTC June 28. By month's end an approaching cold front from the northwest turned Tingting more to the north. By 1200 UTC July 1 the cyclone weakened to a tropical storm near 30N 144E with maximum winds of 55 KT with gusts to 70 KT, and began a turn toward the northeast. Tingting weakened to an extratropical gale (990 hPa) near 38N 156E at 0000 UTC July 4, and then re-intensified into a storm-force low with a central pressure as low as 980 hPa (Figure 2) near 48N 164E, where it stalled. Some ship observations taken during the passage of Tingting are listed in Table 1. The second part of Figure 2 shows only some ship reports of gale-force winds east of the front associated with extratropical Tingting, but the QuikSCAT image in Figure 3 has a 50 KT wind barb near 45N 167E, supporting the classification of the system as a storm.
|
| OBSERVATION | POSITION | DATA/TIME (UTC) | WIND | SEAS (M/FT) |
| Sea-Land Trader
(KIRH) |
35N 143E | 02/0000 | NE 40 | 8.0/26 |
| Brooklyn Bridge
(3EZJ9) |
36N 143E | 02/000 | N 40 | 6.0/20 |
| Aichi Maru
(JEGI) |
29N 149E | 02/0900 | S 35 | |
| Century Leader No. 3
(JADY) |
33N 154E | 03/0600 | S 47 | 6.5/22 |
| 33.5N 154E | 03/1200 | SW 50 |
Table 1. Some notable ship observations taken during Tropical Storm Tingting.
The strong low that was Tingting then remained stationary and weakened to below gale strength early on July 6, before becoming absorbed by a developing low passing to the south late on the same day.
Typhoon Namtheun: Tropical Depression 13W formed near 23N 150E at 0600 UTC July 25 and moved northwest while rapidly intensifying, becoming Typhoon Namtheun only eighteen hours later near 25N 148E with maximum sustained winds of 65 KT with gusts to 80 KT. Namtheun attained a peak intensity of 115 KT sustained winds with gusts to 140 KT at 1800 UTC on the 26th when the center reached 27N 147E. Gradual weakening followed while the cyclone continued to move northwest, and Namtheun passed west of 135E, about 100 nmi south of Japan, as a strong tropical storm by month's end, implying maximum sustained winds of 60 KT with gusts to 75 KT. The Bishu Marui (JGAC) encountered southeast winds of 40 KT near 30N 140E and 31N 140E at 1800 UTC July 29 and 0000 UTC July 30, respectively. Namtheun later recurved northeast into the Sea of Japan and became extratropical west of northern Japan early on August 2, before becoming absorbed by a larger low inland over Asia on the 3rd.
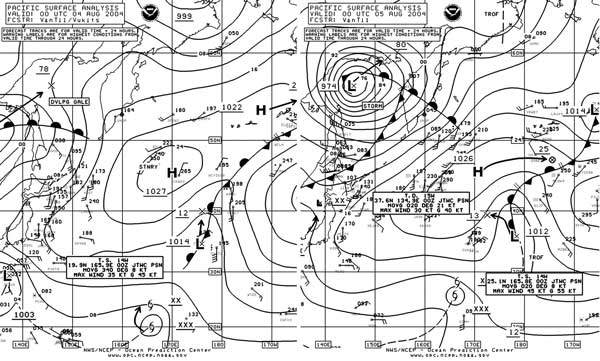 |
Figure 4. OPC North Pacific Surface Analysis charts (Part 2) valid 0000 UTC August 4 and 5, 2004. |
Typhoon Meranti: Tropical Depression 14W formed near 19N 166E at 1800 UTC August 3 and intensified to a tropical storm six hours later while moving north. Tropical Storm 14W appears in the lower part of Figure 4. The cyclone was named Meranti near 26N 166E at 0600 UTC August 5 and it continued to strengthen, becoming a typhoon six hours later near 27N 167E with maximum winds of 65 KT with gusts to 80 KT. The peak intensity came at 1800 UTC August 5 near 28N 167E, with maximum sustained winds of 90 KT and gusts to 110 KT. The cyclone then weakened to a tropical storm twenty-four hours later while turning more northeast into OPC's high seas area (Reference 2), near 32N 170E. Meranti then continued to weaken and became extratropical near 38N 172E early on August 8, where it stalled and later became absorbed by a larger Bering Sea low by the 13th.
Tropical Depression 15W: This cyclone made a brief appearance, moving from west of the area into the Sea of Japan near 38N 135E at 0000 UTC August 5 (Figure 4) with maximum winds of 30 KT with gusts to 40 KT. The cyclone moved northeast and became extratropical, and was absorbed by a frontal system over northern Japan on the 5th.
Tropical Storm Malakas: A northeastward-moving weak low developed into Tropical Depression 17W at 1800 UTC August 10 near 25N 156E, and Tropical Storm Malakas six hours later near 27N 158E. Following a track similar to that of Meranti, Malakas remained a minimal tropical storm with maximum sustained winds of 35 KT and gusts to 45 KT, until becoming an extratropical gale near 33N 167E early on August 12. The low that was Malakas then moved north into the Bering Sea and became absorbed by a larger Bering Sea system by the 15th.
Tropical Depression 18W: This cyclone moved northwest to near 16N 143E at 0600 UTC August 14 with maximum winds 25 KT with gusts to 35 KT, and later passed west of 135E as a tropical depression early on the 15th.
Tropical Storm Megi: Megi moved northeast into the Sea of Japan early on August 19, to near 40N 136E at 1200 UTC on the 19th with maximum winds of 50 KT and gusts to 65 KT. Megi then became an extratropical storm six hours later in the northern Sea of Japan with a central pressure of 985 hPa. Figure 5 shows extratropical Megi as the 986 hPa compact storm crossing northern Japan. The Humber Bridgei (JKRK) reported a southwest wind of 50 KT near 40N 150E at 1200 UTC August 20 while the storm center passed 150 nmi to the northwest. The system then tracked east-northeast and weakened to a gale about 400 nmi south of the western Aleutians late on the 21st, and later ended up near the Queen Charlotte Islands on August 24.
|
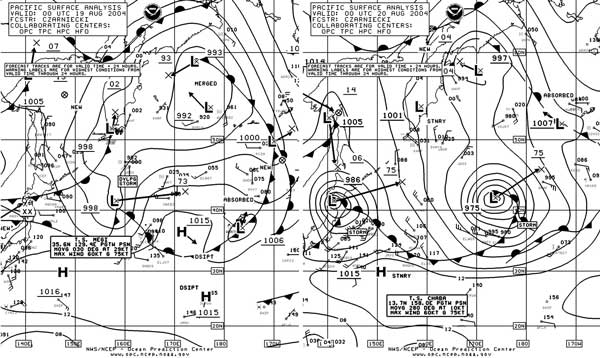
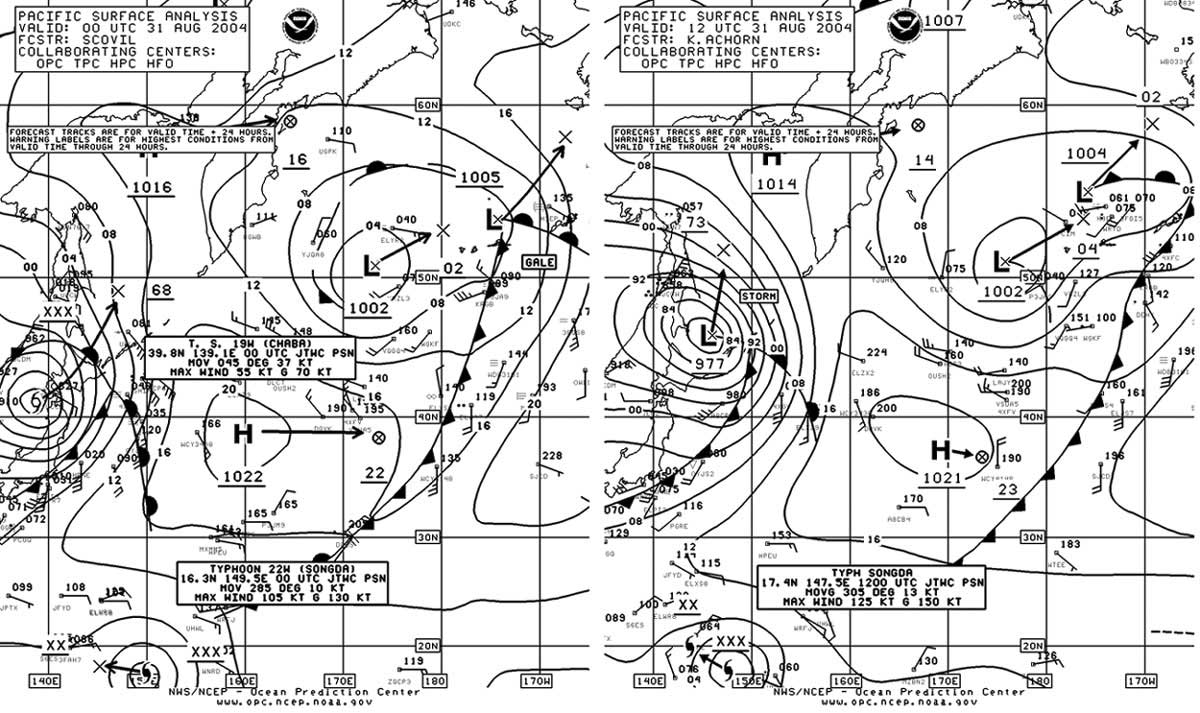
Super Typhoon Chaba: Chaba moved northwest into OPC's oceanic surface map area near 16N 141E early on August 23 as a super typhoon with maximum sustained winds of 155 KT and gusts to 190 KT, matching the intensity of Dianmu in June. Slow weakening followed, but the cyclone remained a super typhoon through 1200 UTC on the 25th, when the center was at 22N 137E. Typhoon Chaba then passed west of 135W, about 500 nmi south of Japan, at 1800 UTC August 26 with maximum winds of 110 KT and gusts to 135 KT. Chaba then passed over western Japan early on the 30th as a minimal typhoon before turning north into the Sea of Japan as a tropical storm. Figure 6 shows Tropical Storm Chaba losing tropical characteristics and becoming the extratropical storm (977 hPa) in the second part of the figure, only twelve hours later. Table 2 has a listing of some notable reports, mostly from ships, taken during the passage of Chaba.
| OBSERVATION | POSITION | DATE/TIME(UTC) | WIND | SEAS(m/ft) |
| Northwest Shearwater
(ZCAO7) |
28N 139E | 28/1800 | S 40 | |
| Cho Yang Atlas
(DQVH) |
33N 134E | 30/1200 | S 50 | 12.0/39 |
| OOCL Fedelity
(VRWG5) |
34N 139E | 30/1800 | S 45 | |
| Polar Eagle
(ELPT3) |
34N 140E | 31/0000 | S 45 | |
| Martorell
(HPNE) |
36N 143E | 31/0000 | S 40 | 5.0/16 |
| Hanjin Pretoria
(A8CP6) |
41N 147E | 31/1200 | SW 35 | 7.5/25 |
| Buoy 21600 | 33.5N 136.8E | 30/1500 | 8.0/26 |
Table 2. List of selected observations taken during passage of Tropical Cyclone Chaba.
Typhoon Songda: Rapidly intensifying Typhoon Songda appeared near 16N 150E at 1800 UTC August 30 while moving northwest, with maximum sustained winds of 95 KT and gusts to 115 KT. By month's end the cyclone was near 18N 147E with maximum winds up to 130 KT and gusts up to 160 KT. See Figure 6. Also see the next issue of MWL (April 2005) for more information on this typhoon which persisted into September.
Other Significant Events
Western North Pacific Storm, May 2-3: A low-pressure area moved east from near northern Japan early on May 1 and intensified into a storm near 45N 165E with a 981 hPa central pressure at 1200 UTC May 2, before looping to the southeast. The central pressure reached 979 hPa as the center crossed 43N 167E at 0600 UTC on the 3rd. The ship Sea-Land Racer (MCDW2) (40N 162E) encountered northwest winds xi of 45 KT at that time. The system then drifted east and weakened.
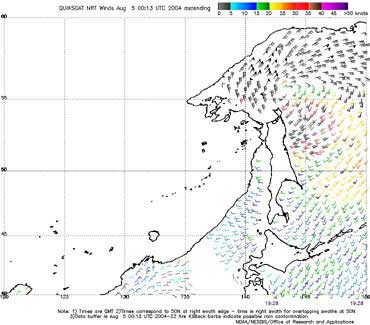 |
Figure 7. QuikSCAT scatterometer image of satellite-sensed winds around the storm shown in Figure 5. The valid time of the pass is 1928 UTC August 4, 2004, or about four and one-half hours prior to the valid time of the second part of Figure 5. Image is courtesy of NOAA/NESDIS/Office of Research and Applications. |
Northwest Pacific Storm of August 4-5: This system developed from a frontal wave of low pressure inland over northeast China late on August 3 and rapidly intensified into the 974 hPa storm shown in the Sea of Okhotsk (Figure 4). The cyclone was deepest six hours later when the center was analyzed with a 973 hPa central pressure, unusually intense for early August. The QuikSCAT image of the storm in Figure 7 was even more impressive, showing winds of 50 to as high as 80 KT north and northwest of the center at a time several hours before the valid time of the second part of Figure 4. It is very unusual to get hurricane-force winds in a non-tropical system in summer. The Sioux (WBN7617) reported west winds of 52 KT near 51N 144E at 2100 UTC August 4. Another ship, UCEF, encountered south winds of 50 KT near 57N 156E fifteen hours later. This storm was short-lived, and moved quickly into eastern Russia and weakened rapidly by August 6.
Western North Pacific Storm of August 19-20: Figure 5 depicts this development which was relatively far south for late summer, at the latitude of Japan. The 998 hPa low near 41N 158E deepened 23 hPa in 24 hours, resulting in the relatively compact 975 hPa storm in the second part of Figure 5. Ship reports were sparse in the area. The cyclone then deepened slightly to 973 hPa in the following twenty-four hours while turning northeast, but winds decreased to gale force as the circulation of the low expanded in area. The system then stalled near the central Aleutians and weakened late on August 21.
References
1. From Tropical Prediction Center website, www.nhc.noaa.gov/; and also Pasch, Richard J. and Lawrence, Miles B., Atlantic Hurricanes (Weatherwise, March/April 2003).
2. Bancroft, G. and Sienkiewicz, J., High Seas Text Bulletins Issued by MPC (Mariners Weather Log, Summer 1996).
Page last modified: