Tropical Atlantic and Tropical East Pacific Areas
January through April 2008
John Cangialosi and Hugh Cobb, Tropical Analysis and Forecast Branch,
National Hurricane Center, Miami, Florida
Atlantic, Caribbean, and Gulf of Mexico
Twenty gale warnings were issued by the Tropical Analysis and Forecast Branch (TAFB) between January and April of 2008 over the tropical and subtropical Atlantic Ocean. Many of these warnings were associated with strong cold fronts; however, there were several directly associated with low pressure systems and tight pressure patterns. Nine of these warnings were issued for the open Atlantic, eight for the Gulf of Mexico and three for the Caribbean Sea. Only one of the events neared storm force, and a couple of other events were difficult to verify due to lack of observations.
Atlantic
The winter and early spring months proved to be consistently active with two gale events occurring in January, three in February, two in March, and two in April. The longest event actually began before the New Year and persisted into early January lasting 4 ½ days. Table 1 shows the list of gale events occurring over the tropical and subtropical Atlantic waters from January through April.
The last gale of 2007 and the first of 2008 was a significant and long lasting one. The forcing was a large meandering low pressure system in the eastern Atlantic in the vicinity of 25 N 35 W. This low began but did not finish transitioning to a subtropical storm as it deepened to 1004 hPa on 31 Dec 2007. Figure 1 is a Metosat-9 infrared satellite image of the storm near peak intensity with ASCAT scatterometer and JASON-1 altimeter data overlaid from around 0000 UTC 31 Dec 2007. This ASCAT pass and several other scatterometer passes from surrounding days revealed winds to 45 kts within the northwestern semicircle. The very fortuitous JASON-1 overpass indicated seas as high as 7.9 m (26 ft) and 3.7 m (12 ft) seas extending 300 nmi north of the low center. This low pressure system weakened on 1 Jan 2008 and winds were finally analyzed to be below gale force by 0600 UTC 2 Jan.
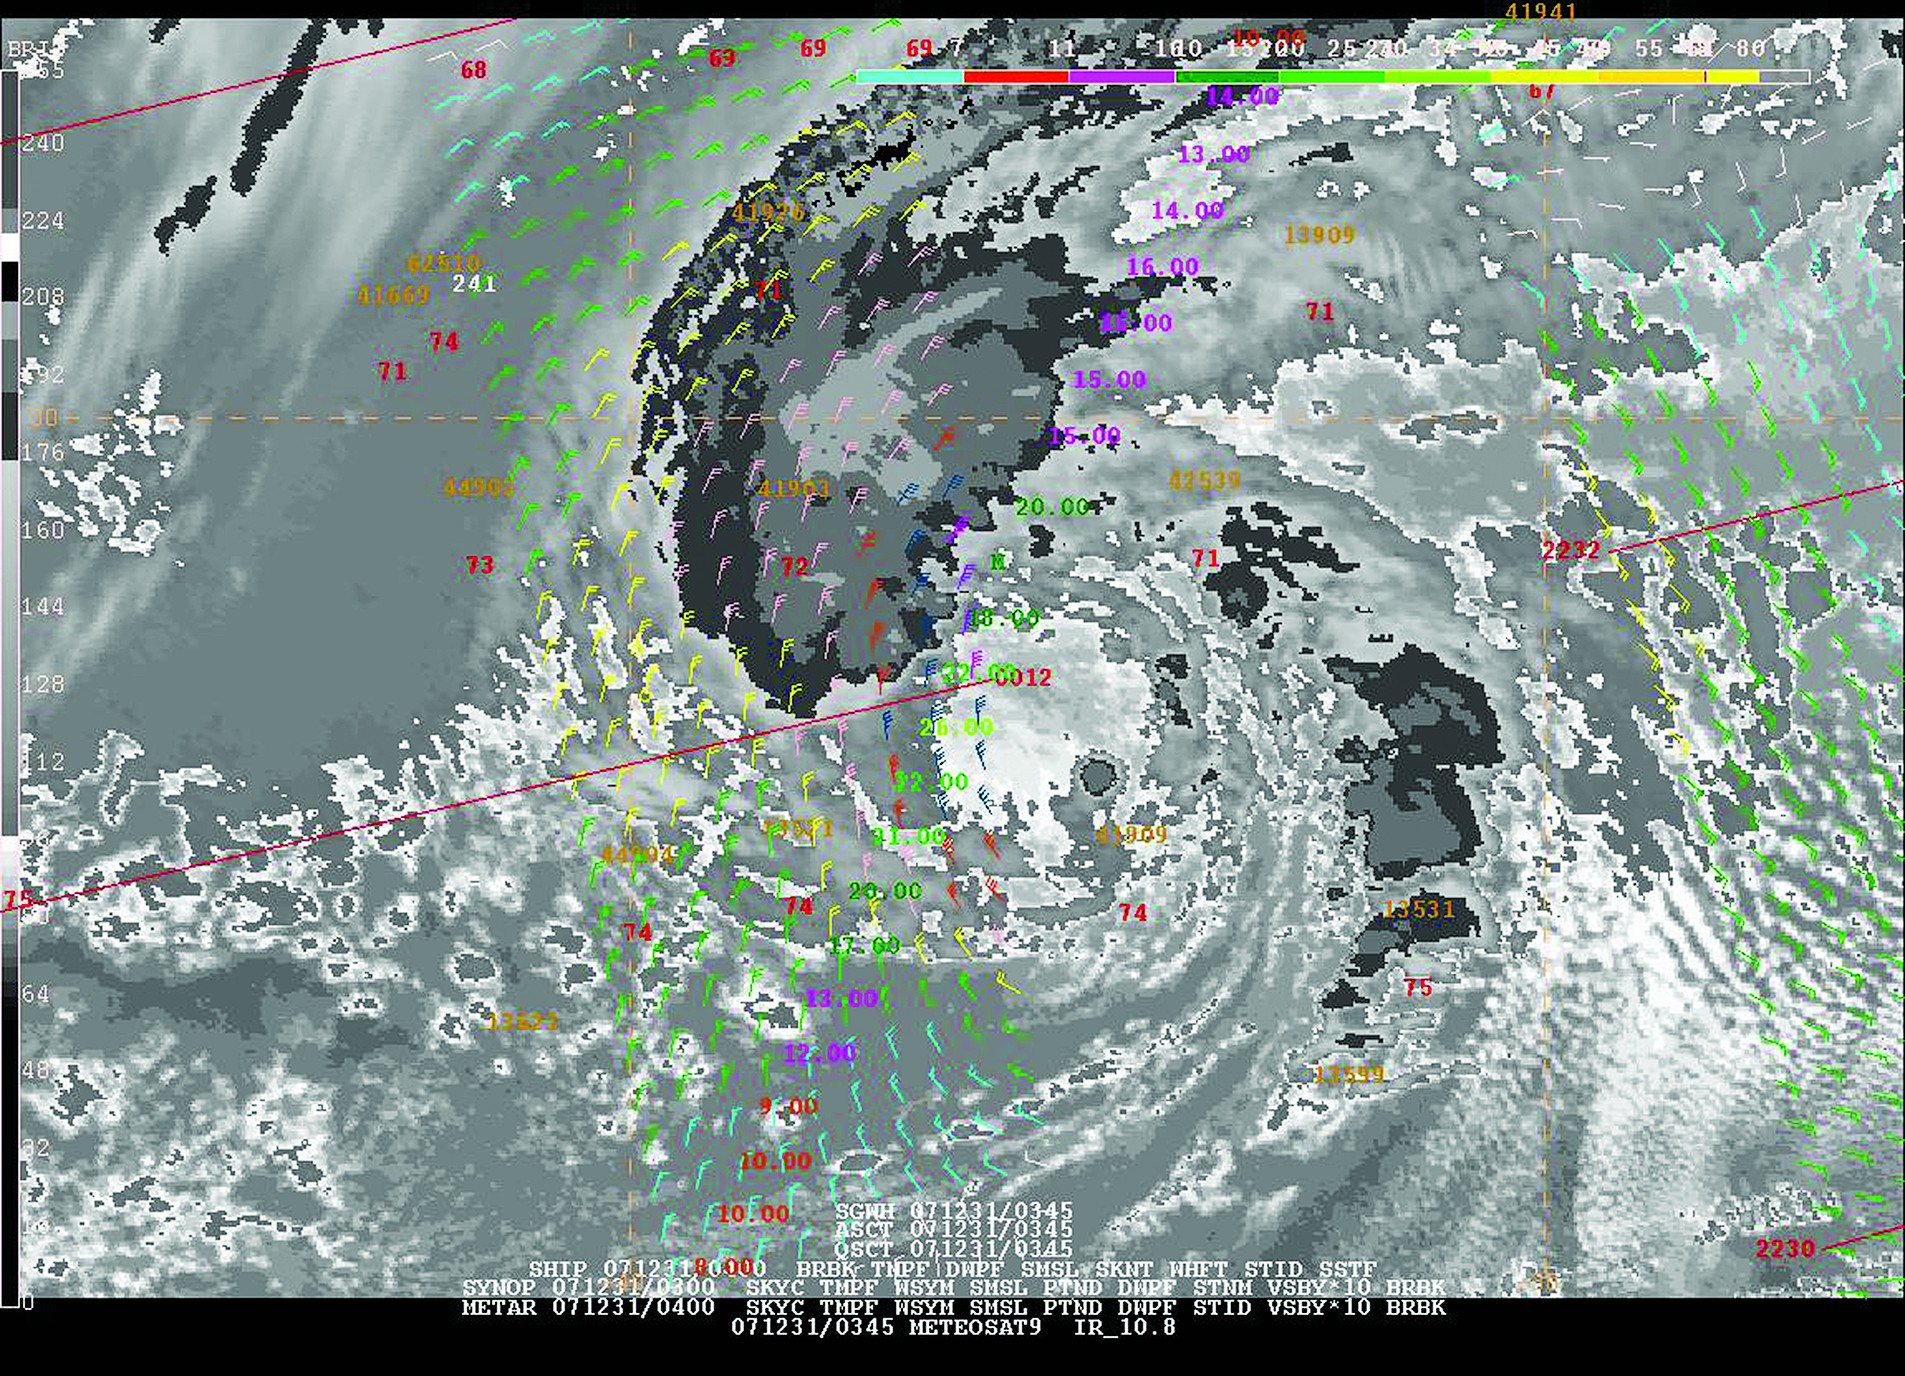
Figure 1. A Metosat-9 infrared satellite image of a 1004 hPa low pressure system in the eastern Atlantic at 0345 UTC 31 Dec 2007. A 0012 UTC 31 Dec ASCAT pass is overlaid along with a JASON-1 altimeter pass around 0000 UTC 31 Dec indicating winds to 45 kts and a maximum significant wave height of 7.9 m (26 ft). (Click to enlarge)
The first event to begin in 2008 began at 1200 UTC 4 Jan and lasted for only 12 hours. The synoptic weather pattern consisted of a potent 1040 hPa high pressure center over southeastern North Carolina and a frontal boundary over the Central Atlantic and Caribbean. The tightest pressure gradient between these features was evident near the central and eastern Bahamas, and that is the location where ships indicated winds to gale force. The Westerdam (PINX) and the Carnival Freedom (3EBL5) cruise ship both reported northeast winds near 35 kts, and El Yunque (WGJT) reported northeast winds near 40 kts. A high resolution QuikScat pass around 1200 UTC 4 Jan revealed 30-35 kts winds in this region, all verifying the warnings.
There was nearly a six week lull before the next event began at 0600 13 Feb. This event affected an area only slightly north of the previous gale near the northern Bahamas and open waters between the Bahamas to near 65W. The initial trigger was somewhat complex with a dissipating stationary boundary draped nearly east-west over the subtropical western Atlantic, a deepening low pressure area over the southeast U.S. with an associated cold front extending into the Gulf of Mexico, and a 1031 hPa high positioned over the mid-latitude central Atlantic Figure 2. Winds to gale force extended along and to the north of the weakening stationary front and off the northeast Florida coast ahead of the approaching cold front. Over time, the cold front became the main culprit with southwesterly gale force winds occurring ahead of the boundary and possible stronger gusts in the squall lines racing east of the front. There were several reports of 35 kts winds during this 36 hour event including: Freeport in the Bahamas, NOAA Buoy 41010, and ships Unknown Ship (WCOB9), Unknown Ship (BATFR28) and Jeppensen Maersk (OWTW2).
| Event Start and End Dates | Location | Duration (hrs) | Comments |
|---|---|---|---|
| 28 Dec 1800 UTC 02 Jan 0600 UTC |
Eastern Atlantic | 108 | Large Extratropical Low |
| 04 Jan 1200 UTC 05 Jan 0000 UTC |
Western Atlantic | 12 | Pressure gradient: High to front |
| 13 Feb 0600 UTC 14 Feb 1800 UTC |
Western Atlantic | 36 | Cold front |
| 14 Feb 1800 UTC 16 Feb 0000 UTC |
Eastern Atlantic | 30 | Occluded Low |
| 27 Feb 0600 UTC 28 Feb 0600 UTC |
Western Atlantic | 24 | Cold front |
| 17 Mar 0000 UTC 20 Mar 1200 UTC |
Western Atlantic | 84 | Occluded Low |
| 25 Mar 1200 UTC 26 Mar 0000 UTC |
Western Atlantic | 12 | Cold front |
| 06 Apr 1800 UTC 08 Apr 0000 UTC |
Eastern Atlantic | 30 | Occluded Low |
| 15 Apr 1800 UTC 18 Apr 1200 UTC |
Western Atlantic | 66 | Extratropical Low |
| Event Start and End Dates | Location | Duration (hrs) | Comments |
|---|---|---|---|
| 02 Jan 1800 UTC 03 Jan 1200 UTC |
Northwest Caribbean | 18 | Cold front |
| 29 Feb 1800 UTC 01 Mar 1800 UTC |
South Central Caribbean | 24 | Pressure gradient: High to Low |
| 18 Mar 1200 UTC 20 Mar 1200 UTC |
South Central Caribbean | 48 | Pressure gradient: High to Low |
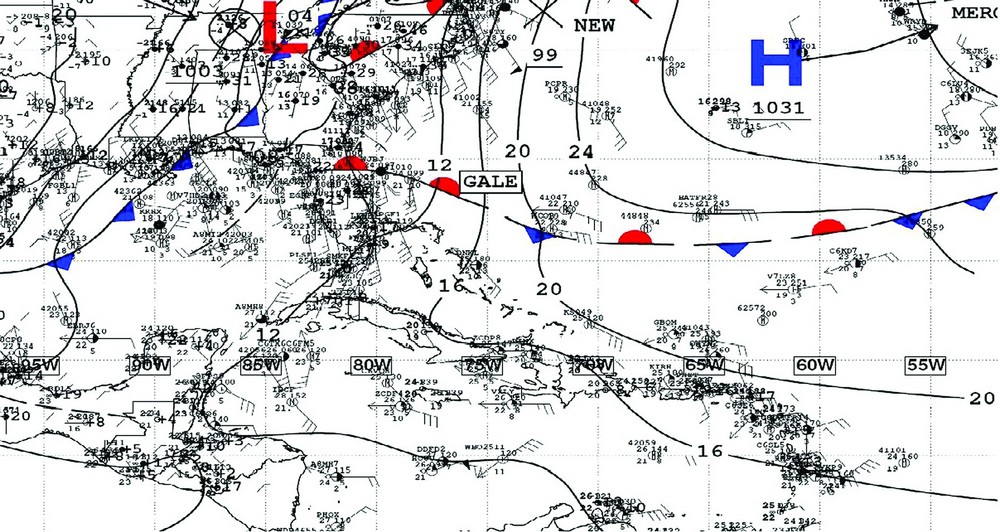
Figure 2. The 1200 UTC 13 Feb 2008 National Weather Service Unified Surface Analysis showing the synoptic weather pattern leading to gale conditions in the western Atlantic and Gulf of Mexico. (Click to enlarge)
Meanwhile as the gale in the western Atlantic was winding down an eastern Atlantic gale was developing on Valentines Day. This high wind event was associated with an occluded 996 hPa storm force low pressure center situated just northeast of the TAFB high seas domain near 33 N 30 W. A high resolution QuikScat pass at 0826 UTC 15 Feb showed north to northwest 30-35 kts winds on the west side of the low spreading as far south as 26 N mainly east of 41 W. It is possible that winds reached 40 kts over the far northeast waters just prior to the scatterometer pass when the storm was closer. The NOAA Wave Watch III guidance suggested combined seas as high as 6.1 - 6.7 m (20 - 22 ft) in northerly swell over this region, but unfortunately there was not a altimeter pass to confirm. The gale force winds moved east of the region by 0000 UTC 16 Feb, making this a 30 h event.
The next gale event occurred again over the western Atlantic beginning at 0600 UTC 27 Feb ahead of a strong cold front. South to southwest gale force winds only affected a small portion of our waters north of 29 N within 300 nmi east of the front. This event lasted for 24 hours. While gale conditions were not reported, ships The Horizon Navigator (WPGK) and Overseas New Orleans (WFKW) both reported 30 kts winds, and a QuikScat pass just prior to the expected onset also showed 30 kts core winds.
Nearly three weeks lapsed before the next event occurred on 17 Mar. This event was one of the most significant of the period, lasting for 84 hours. The trigger was an intense extratropical low pressure system over the central-western Atlantic that deepened to 962 hPa. Unlike many rapidly deepening systems in this region, this one moved slowly at times and actually retrograded for a short while. This fact allowed the gale winds to persist and created very hazardous marine conditions. Figure 3 is a high resolution QuikScat pass around 2200 UTC 18 Mar which shows 40-45 kts northwest winds over the northern waters roughly between 53 W and 65 W. These winds and a large northerly swell, produced from the hurricane force winds in the Ocean Prediction Center area of responsibility, generated extremely high seas. A JASON-1 altimeter pass revealed seas as high as 8.5 m (28 ft) in the TAFB area of resonsibility and up to 11.6 m (38 ft) north of the region Figure 4. This pass also marks the leading edge of the swell train with seas ramping up from 0.9 m to 6.4m (3 ft to 21 ft) over less than 5 degrees of latitude. In light of the approach of this large swell, the San Juan Weather Forecast Office (WFO) issued their first ever High Surf Warning. This warning was defined locally to be issued when over 6.1 m (20 ft) breaking waves are expected. Figure 5 shows a picture of the sea conditions from shore near San Juan, Puerto Rico.
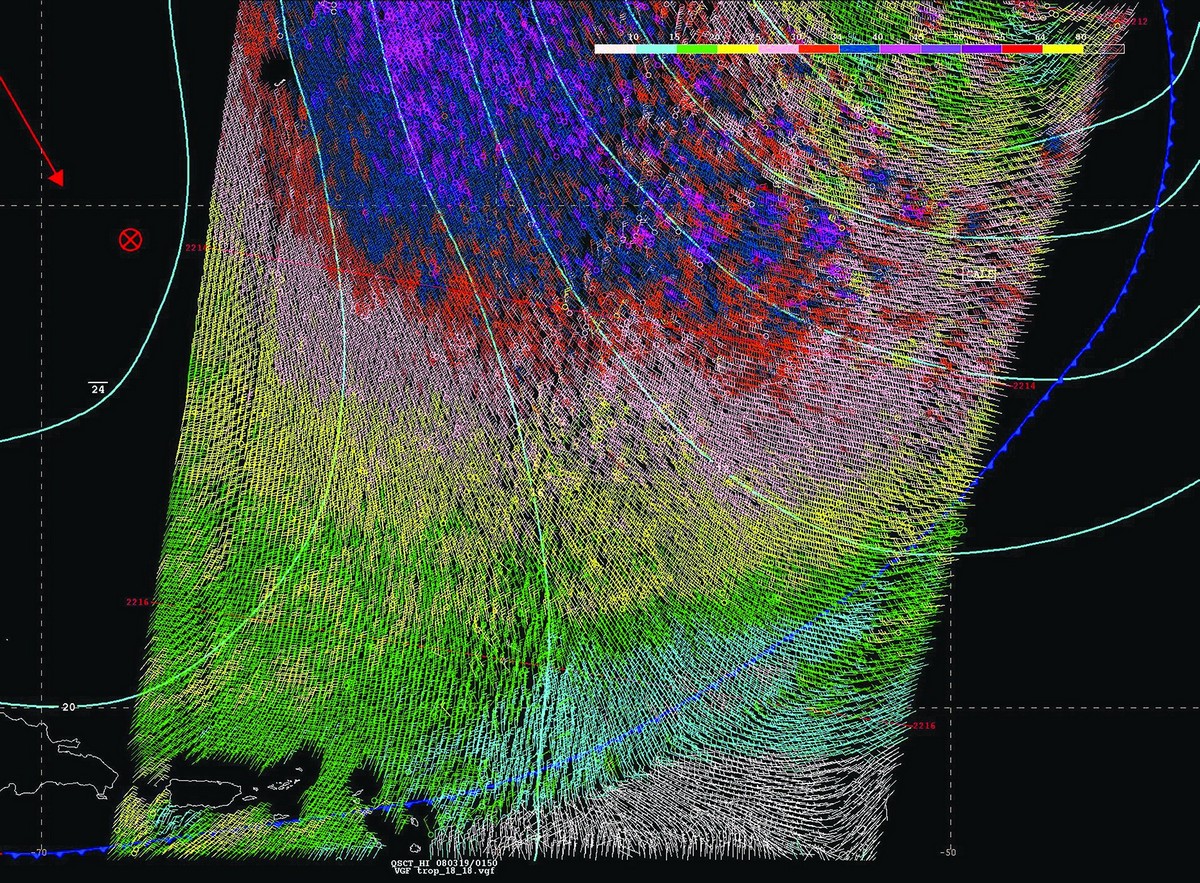
Figure 3. A 12.5 km high resolution QuikSCAT image from 2214 UTC 18 Mar 2008 showing gale force winds to the west of the strong cold front over the subtropical Atlantic. (Click to enlarge)
Figure 4. A GOES-E infrared satellite image and a JASON-1 altimeter pass from around 0000 UTC 19 Mar 2008 depicting the large low pressure system over the North Atlantic and associated seas (ft). The JASON-1 pass also depicts well the leading edge of the northerly swell train. (Click to enlarge)
A week or so later, a short-lived gale event occurred over the western Atlantic associated with another strong cold front. However, unlike the previous couple of fronts, gale winds were confined to the cold sector (west of the front) and the warnings were issued for a very small portion of our area, north of 29 N. Several ship and buoy observations reported winds of gale force along and north of our border.
The final two gales occurred in the month of April. The first of the month began at 1800 UTC 6 Apr over the eastern Atlantic. This event very much mirrored the Valentines Day eastern Atlantic occluded low pressure system in terms of location and duration; however, this one was likely slightly weaker. The last gale in the subtropical and tropical Atlantic for the January through April 2008 period was the third longest of the set, lasting 66 h. The culprit was a complex area of low pressure with several boundaries quickly developing into a storm force low well off the Carolina coast. Figure 6 is a pair of surface weather maps 18 hours apart that show this evolution. This gale affected much of the central and western subtropical Atlantic within the cold sector. Several ship observations and a couple of scatterometer passes confirmed the gale.
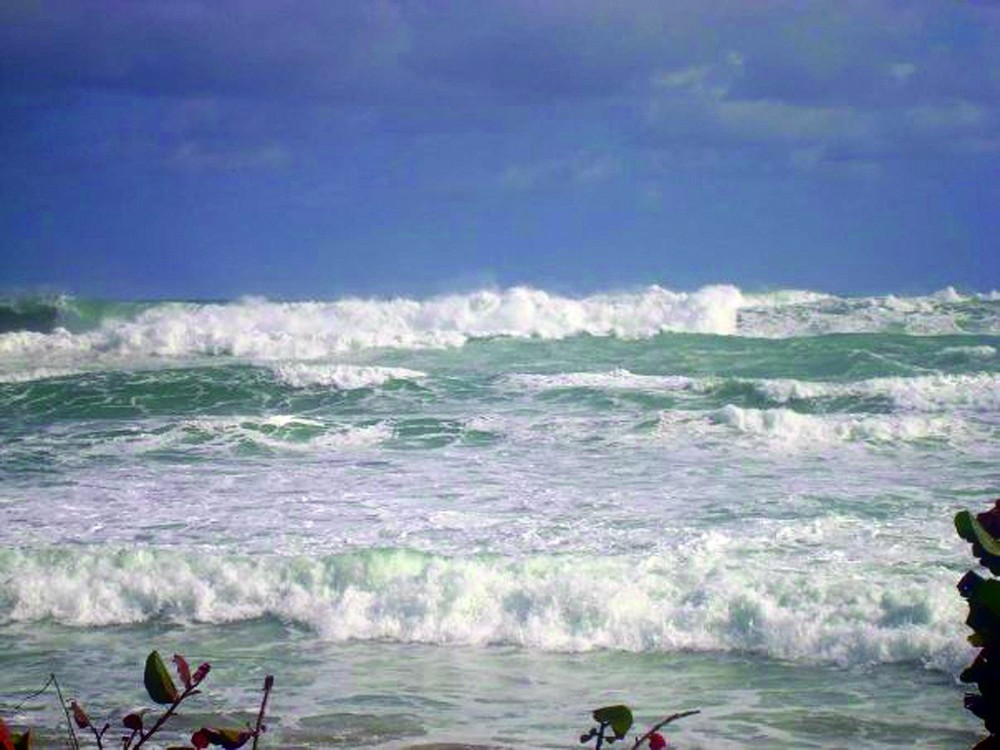
Figure 5. A photo of the near shore sea conditions taken from a beach near San
Juan, Puerto Rico on 19 Mar 2008 (courtesy of Roham Abtahi of the San Juan
Weather Forecast Office).(Click to enlarge)
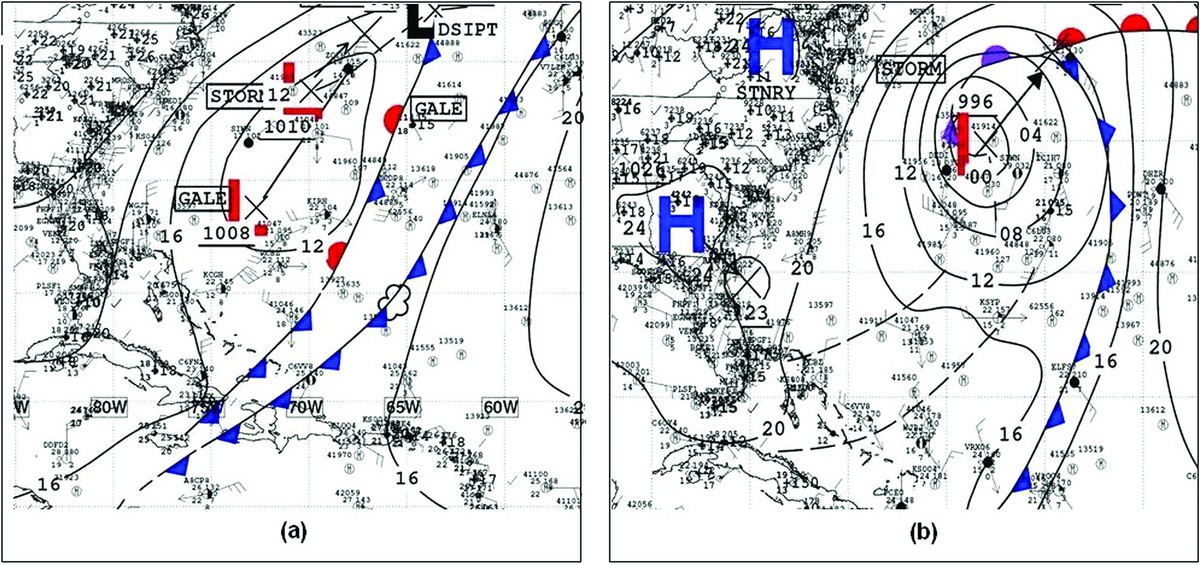
Figure 6. (a) The 1800 UTC 6 Apr 2008 National Weather Service Unified Surface Analysis of the western Atlantic and (b) the same source analysis 18 hours later at 1200 UTC 7 Apr 2008. This set of maps shows the rapid evolution of a complex low into a storm force low center. (Click to enlarge)
Caribbean
Three gale events occurred in the Caribbean between early January and late March. Table 2 shows the list of gale events occurring between January and April over the Caribbean Sea. The first event was the shortest but the strongest of the three, beginning at 1800 UTC 2 Jan and lasting for 18 hours. The associated weather pattern consisted of a very strong cold front moving through the western Caribbean Sea and a 1050 hPa Canadian high pressure system building behind the front over the southeast U.S. (Figure 11 and 12). While the core of this event affected the Gulf of Mexico and especially the Gulf of Tehuantepec, very strong northerly winds were also noted in the northwest Caribbean behind the front. Several ships reported winds in the 35-45 kts range including the Carnival Victory (3FFL8), M/V Asphalt Commander (WFJN), and Norwegian Spirit (C6TQ6). The Carnival Liberty (HPYE) and Liberty of the Seas (C6VQ8) reported 50 and 55 kts respectively, but these were suspected to be an overestimate based on surrounding observations. A high resolution QuikScat pass around 2330 UTC 2 Jan revealed 30-40 kts winds over this region Figure 7.
The second and third gale events occurred over the south central Caribbean in the climatologically higher wind regime off the Colombian coast. These conditions were caused by an increase in pressure gradient over the Caribbean due to strong high pressure over the western Atlantic and low pressure over Colombia. The second gale began at 1800 UTC 29 Feb and lasted for 24 hours. While there were not any ships reports of gale force winds, a QuikScat pass around 1200 UTC 1 Mar did indicate a narrow region of 35 kts winds near the coast of Colombia. The third and last gale event of the winter/early spring began on 18 Mar and persisted for 2 days, making it the longest of the period. The ship Coral Princess (ZCDF4) reported 35 kts on a couple of occasions and a couple of scatterometer passes were suggestive of similar magnitude winds.
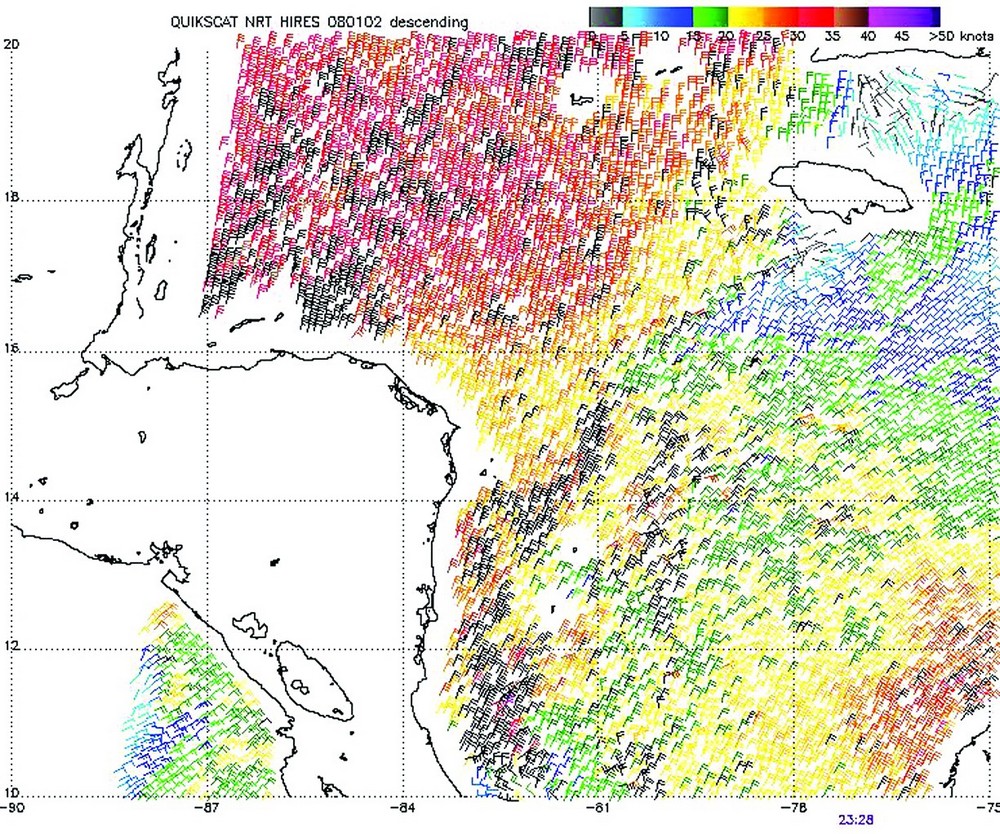
Figure 7. A 12.5 km high resolution QuikSCAT image from 2330 UTC 2 Jan 2008
showing a gale event over the northwest Caribbean Sea. (Click to enlarge)
Gulf of Mexico
The mid-winter and early spring season started off active in the Gulf of Mexico due to a strong cold front sweeping through the region with cold Canadian 1050+ hPa high pressure building southeastward toward the northern Gulf coast (Figure 11 and 12). Several reports of 35-40 kts northerly winds were reported west of the cold front during this 48 h gale event, from 1200 UTC 1 Jan through 1200 UTC 3 Jan. Sample lists of the reports include NOAA buoys 42362 and 42003 and the following ships: Deep Water Millennium (V7HD2), Unknown Ship (PHPQ), Grandeur of the Seas (C6SE3), Fantasy (H3GS), and oil rig FGBL1. While gale force winds affected nearly the entire area, the longest lasting and likely the strongest were over the southwest waters where the greatest wind funneling exists near the coast. Ship and buoy observations suggest that seas built as high as 6.1 m (20 ft) for a short time.
| Event Start and End Dates | Location | Duration (hrs) | Comments |
|---|---|---|---|
| 01 Jan 1200 UTC 03 Jan 1200 UTC |
Most of the area | 48 | Cold front |
| 16 Jan 0600 UTC 17 Jan 0000 UTC |
North Gulf | 18 | Extratropical Low |
| 19 Jan 0600 UTC 20 Jan 1800 UTC |
North Gulf | 36 | Extratropical Low |
| 06 Feb 1200 UTC 06 Feb 1800 UTC |
West Gulf | 6 | Cold front |
| 26 Feb 1800 UTC 27 Feb 1800 UTC |
Most of the area | 24 | Cold front |
| 18 Mar 0600 UTC 20 Mar 0600 UTC |
Most of the area | 48 | Pressure gradient: High to front |
| 13 Apr 1200 UTC 14 Apr 0600 UTC |
West Gulf | 18 | Cold front |
| 28 Apr 1800 UTC 29 Apr 1800 UTC |
West Gulf | 24 | Cold front |
(The bold entries denote storm force winds or greater)
| Event Start and End Dates | Location | Duration (hrs) | Comments |
|---|---|---|---|
| 02 Jan 0000 UTC 05 Jan 1800 UTC |
Gulf of Tehuantepec | 90 | Hurricane Force Winds |
| 17 Jan 0600 UTC 18 Jan 0000 UTC |
Gulf of California | 18 | |
| 20 Jan 0000 UTC 21 Jan 1800 UTC |
Gulf of Tehuantepec | 42 | Storm |
| 25 Jan 1200 UTC 27 Jan 1800 UTC |
NW portion East Pacific | 54 | Gale force winds associated with a cold front |
| 27 Jan 1200 UTC 28 Jan 0600 UTC |
Gulf of Tehuantepec | 18 | |
| 23 Feb 0000 UTC 24 Feb 0600 UTC |
NW portion East Pacific | 30 | Gale force winds associated with a cold front |
| 27 Feb 1200 UTC 29 Feb 0000 UTC |
Gulf of Tehuantepec | 36 | Storm |
| 05 Mar 0000 UTC 05 Mar 0600 UTC |
Gulf of Tehuantepec | 6 | |
| 08 Mar 0000 UTC 09 Mar 1200 UTC |
Gulf of Tehuantepec | 36 | Storm |
| 20 Mar 0000 UTC 21 Mar 1800 UTC |
Gulf of Tehuantepec | 42 | Storm |
| 24 Mar 1200 UTC 26 Mar 1200 UTC |
Gulf of Tehuantepec | 48 | Storm |
| 14 Apr 0000 UTC 16 Apr 1200 UTC |
Gulf of Tehuantepec | 60 | Storm |
| 29 Apr 0000 UTC 29 Apr 1800 UTC |
Gulf of Tehuantepec | 18 |
The second gale event occurred about two weeks later originating over the northwest waters at 0600 UTC 16 Jan. The forcing for this event was a vigorous baroclinic low pressure system that formed in the region and deepened to 1002 hPa. The tight pressure gradient between the low and a 1028 hPa high over the Carolinas produced a large enhanced wind field over the northern half of the Gulf. Figure 8 is a high resolution QuikScat pass around 1200 UTC 16 Jan which clearly shows a welldefined surface circulation with an area of winds near or in excess of 50 kts north and northeast of the center; however, several of these were rain flagged. TAFB was predicting winds to 45 kts at that time, which is close to the observed reports. The possible storm force event only lasted 18 hours as the low tracked east-northeastward and weakened.
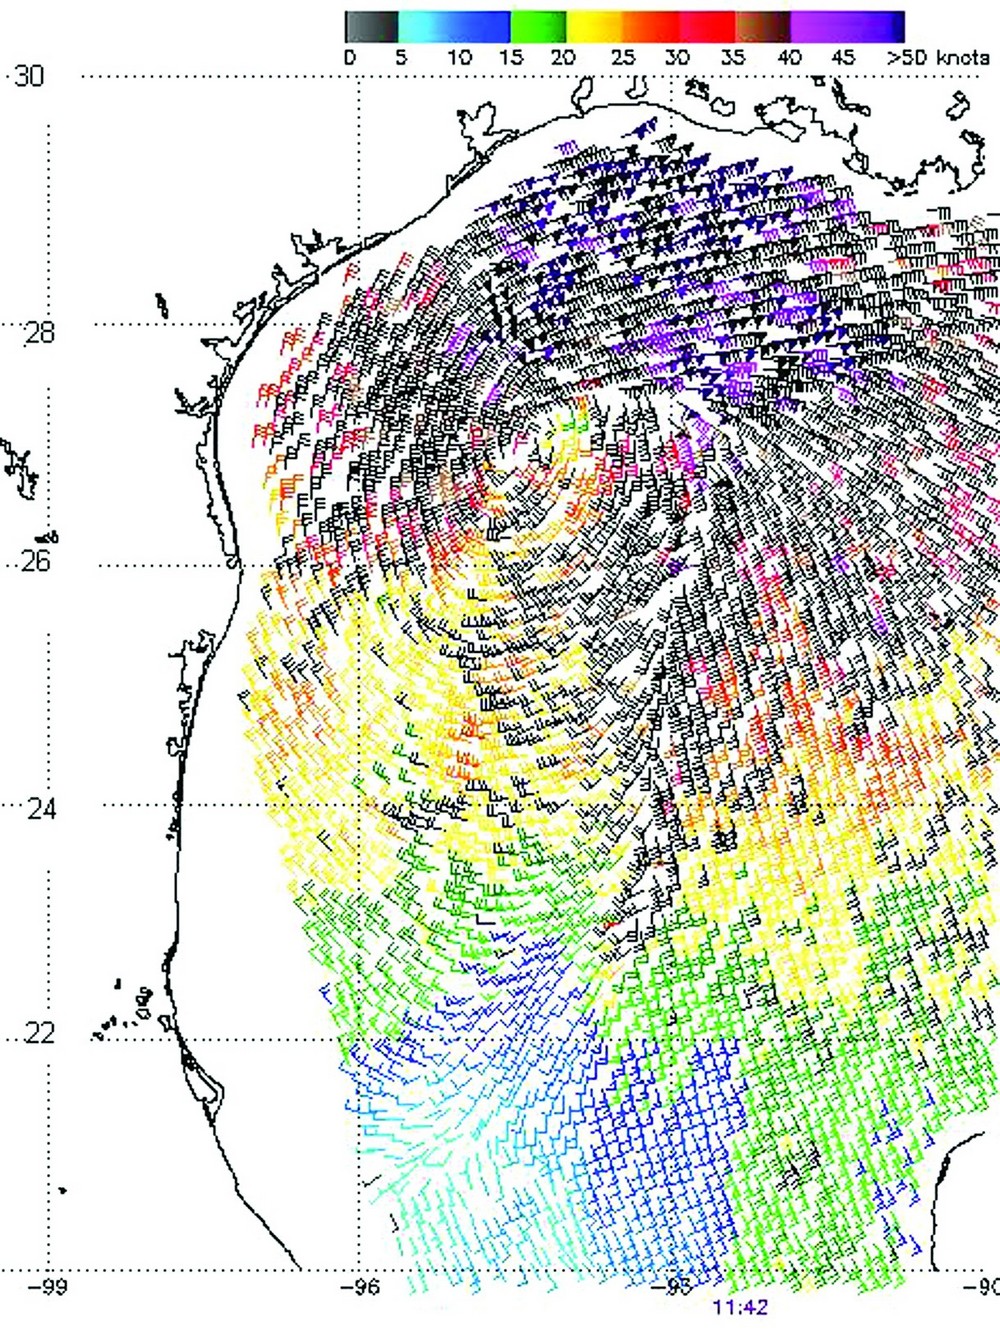
Figure 8. A 12.5 km high resolution QuikSCAT image from 1142 UTC 16 Jan 2008 revealing a closed surface circulation over the northwestern Gulf of Mexico and the strongest winds to the north of the low center. Although several wind vectors are rain flagged, near storm conditions likely occurred north of the center.
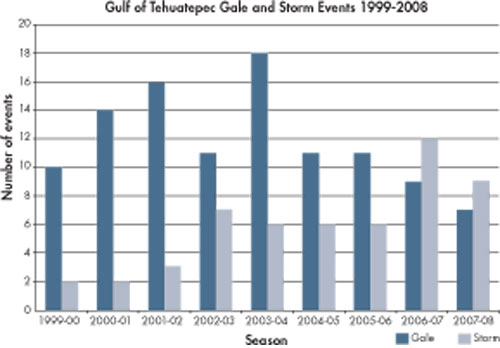
Figure 9. Number of Gale and Storm force wind events in the Gulf of Tehuantepec
The third gale event occurred only two days later on 19 Jan and was nearly a repeat of the second in terms of the synoptic weather pattern. However, the low in the Gulf and high pressure northeast of the region were both weaker for this event leading to a minimal gale rather than a marginal storm. Nonetheless, this gale actually persisted longer (36 h) due to the slower movement of the low.
Two gale occurred during the month of February, both produced by cold fronts. The first lasted for only six hours on 6 Feb over the southwest waters. A strong cold front surged southward into the Bay of Campeche rapidly increasing north winds behind it. Unknown Ship(BATFR28) reported 40 kts at 1200 UTC. However, the combination of rapid weakening of the front, due to limited upper level support, and weak high pressure settling over the area allowed the winds to relax quickly. The other gale event in Feb began at 1800 UTC 26 Feb and lasted for 24 hours. The cold front that set off this gale event was stronger and was maintained by upper support the entire time it was in the Gulf of Mexico. North winds of 30-35 kts occurred across much of the waters west of the front confirmed by ships Bona Farm (C6CL6), Ecstasy (H3GR) and shell oil rig Brutus (42362). Similar magnitude winds are evident in a 1012 UTC 27 Feb QuikScat pass over the region.
The next gale event began on 18 Mar and lasted for 48 hours. Like the February gales, this event was also associated with a cold front; however, this situation was more unique for the region. Southeast gale force winds began at 0600 UTC due to the tight pressure gradient between the front over Texas and Mexico and a 1033 hPa high pressure system over and off the North Carolina coast. As the front moved into the Gulf, northerly gale winds filtered into the region. Several ships reported 35 kts southeast and north winds including: Carnival Conquest (3FPQ9), Ecstasy (H3GR), Inspiration (C6FM5).
A pair of late season strong cold fronts helped spawn off two gale events in the early spring. The first one began at 1200 UTC 13 Apr and lasted for 18 hours and the second one occurred about two weeks later on 28 Apr and persisted for 24 hours. In both cases, high pressure surged southward over Mexico tightening the pressure gradient resulting in gale force north winds west of the front, especially over the southwest waters.
Eastern North Pacific
Gulf of Tehuantepec Gale Events
There were 16 gale and storm force wind events in the Gulf of Tehuantepec during the cool season from October 2007 through April 2008, which is climatologically average for the number of gale force or greater wind events for the Gulf of Tehuantepec in a given cool season (Cobb et al, 2003). Of the 16 wind events, there were eight events with storm force or greater winds. This number is slightly above the average of six storm force wind events per season, but less than the record breaking total of 12 storm force wind events in the 2006-2007 season Figure 9.
The first significant wind event of 2008 commenced at 0000 UTC 2 January and lasted about 90 hours and ended around 1800 UTC 5 January, the longest wind event of the 2007-08 cool season. This was also the strongest wind event of the season as well with a 1240 UTC 3 January high resolution (12.5 km) QuikSCAT pass Figure 10 indicating storm force winds of 60 kts with an isolated 65 kts wind barb. This event was triggered by a strong high pressure (1054 hPa) located over the central Rockies which built southward over the southern United States and into the Gulf of Mexico and the Chivela Pass (Figures 11 and 12). Gale force winds occurred in the Gulf of Mexico and the Caribbean as well. Only one ship report of gale force winds was noted in association with this well advertised event. The MSC Geneva (DDJH2) located near 14N95.5W reported north-northeast winds of 45 kts and 5 m (16 ft) seas at the start of the wind event around 0000 UTC 2 January.
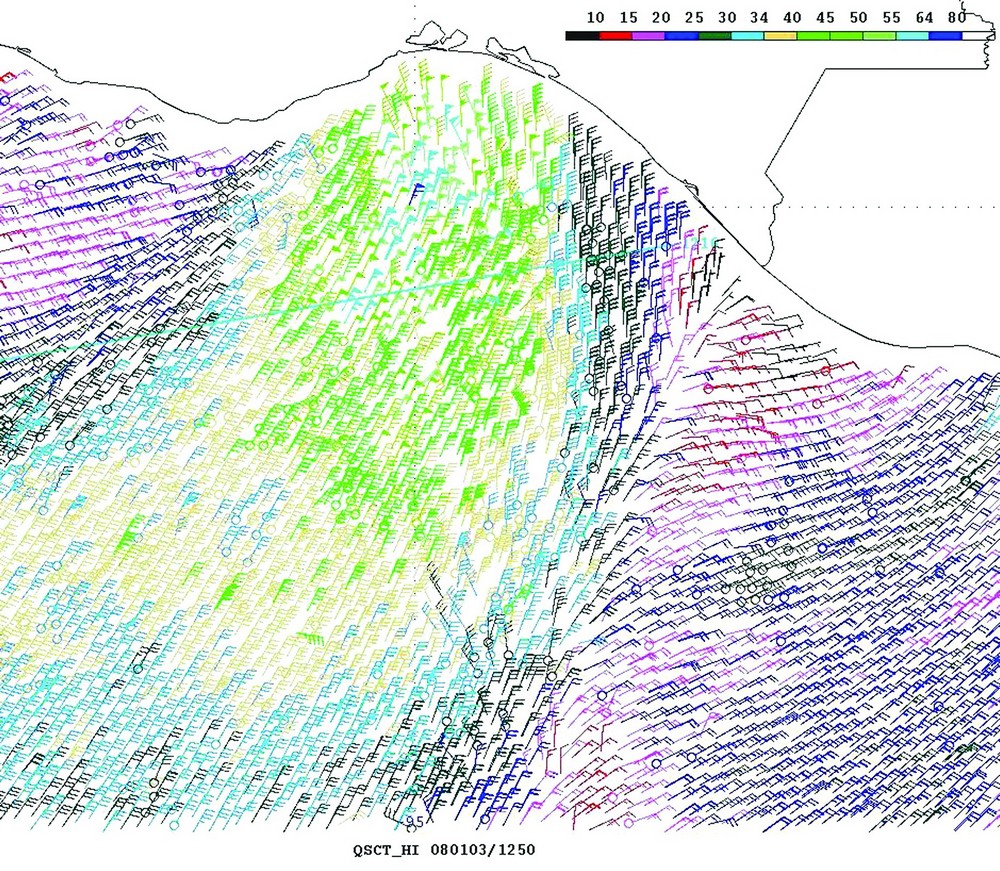
Figure 10. High resolution (12.5 km) QuikSCAT pass from 1250 UTC 3 January 2008 indicating a large area of 50-60 kts storm force winds with an isolated 65 kts wind in the Gulf of Tehuantepec. (Click to enlarge)
The next wind event, also of storm force intensity began around 0000 UTC 20 January and lasted until 1800 UTC 21 January, or about 42 hours. There were no ship reports of gale force winds or greater in association with this event. This event was followed up a week later by a marginal gale event. This event began around 1200 UTC 27 January and lasted a brief 18 hours.
The fourth wind event of 2008 began around 1200 UTC 27 February, nearly a month after the previous event. This wind event lasted 36 hours and ended around 0000 UTC 29 February. Winds reached storm force in this event with a high resolution QuikSCAT pass indicating 55 kts winds in the Gulf of Tehuantepec Figure 13. The only ship report of gale force winds in this event came from the ship Cala Pacuare (V2HZ) located near 14.5N 95.7W at 1800 UTC 27 February. The ship reported northnortheast winds of 35 kts and 4 m seas (13 ft). This event was flowed up by another brief marginal gale event which lasted from 0000 to 1200 UTC 5 March.
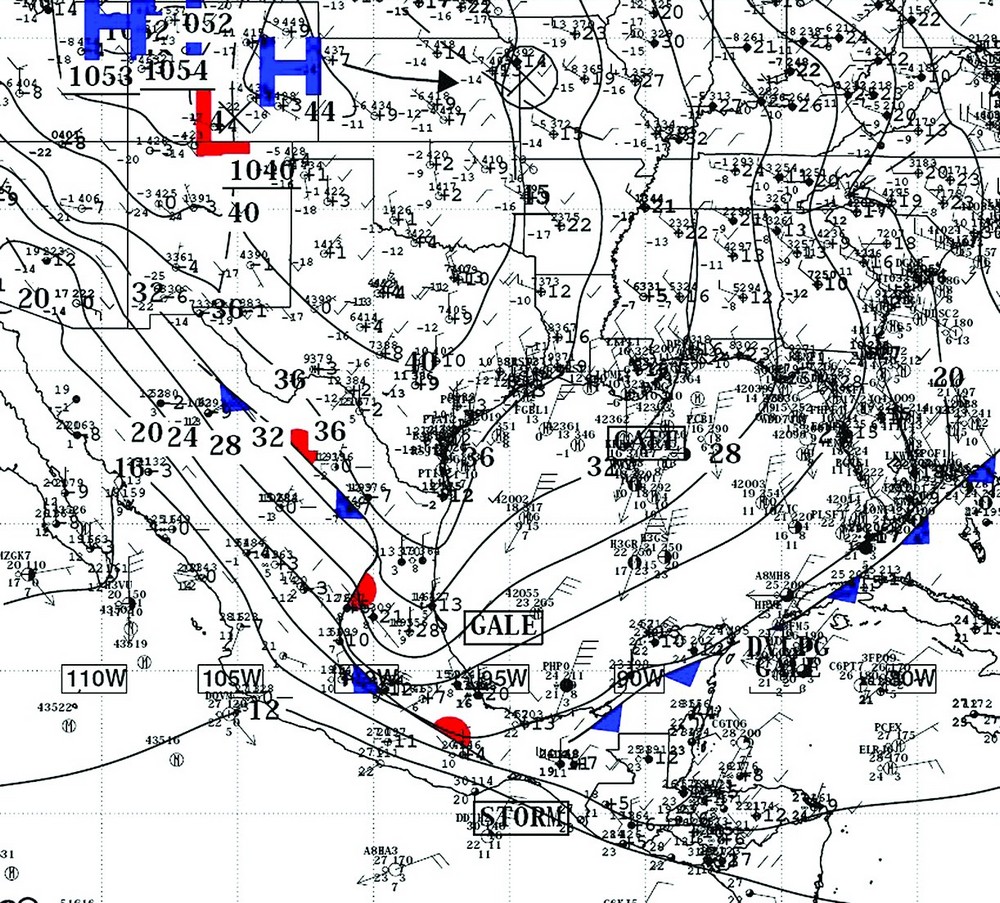
Figure 11. TPC Surface Analysis from 0000 UTC 2 January 2008 depicting the large 1054 hPa anticyclone over the central Rockies and the large swath of gale force winds over the Gulf of Mexico.(Click to enlarge)
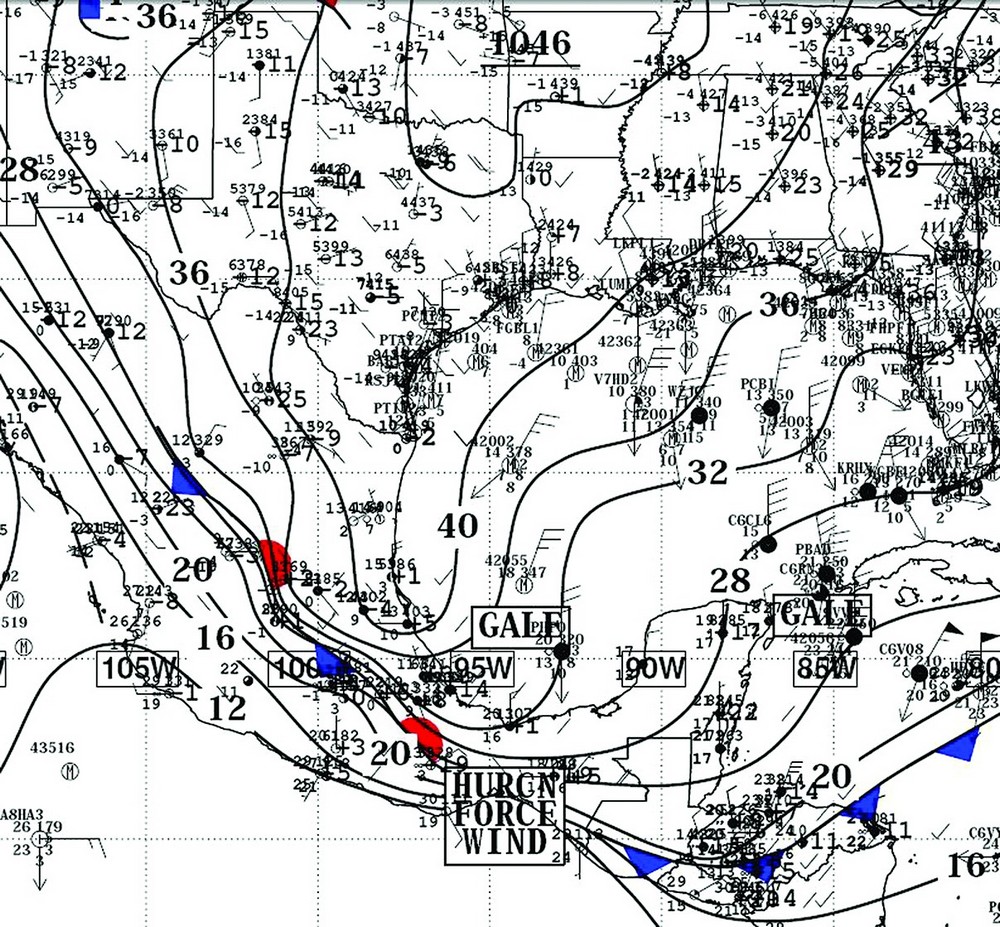
Figure 12. TPC Surface Analysis from 0000 UTC 3 January 2008 indicating the large anticyclone had migrated eastward over the south-central United States with swath of gale force winds continuing over the Gulf of Mexico. Note the Hurricane Force wind warning in the Gulf of Tehuantepec.(Click to enlarge)
The next wind event commenced at 0000 UTC 8 March and continued until 1200 UTC 9 March. A 1215 UTC 8 March high resolution QuikSCAT pass confirmed winds had reached 50 kts in this event. In addition the ship Kiel Express (DEHZ) located near 14N94.8W reported north-northeast winds of 50 kts and 4.5 m seas (15 ft) at 1800 UTC 8 March. This storm event was followed by another event which began 0000 UTC 20 March and lasted until 1800 UTC 21 March. A high resolution QuikSCAT pass from 1215 UTC 20 March indicated 55 kts winds. There were no ship reports of gale force winds or greater in association with this wind event.
The next wind event began around 1200 UTC 24 March and lasted 48 hours. Numerical models suggested winds would only reach gale force in this event and the High Seas forecasts issued up until the time of the event indicated gale force winds were expected for this event. A 1215 UTC 24 March high resolution QuikSCAT pass indicated winds had significantly exceeded forecasts and reached 55 kts. There were no ship reports of gale force winds or greater noted in association with this particular wind event. The final storm force wind event of the season began around 0000 UTC 14 April and continued through 1200 UTC 16 April. High resolution QuikSCAT passes arriving after the peak of the wind event from 2357 UTC 14 April and 1245 UTC 15 April indicated winds had dropped off to 40-45 kts in the Gulf of Tehuantepec. The ship Ever Refine (3FSB4) located near 13.8N94.5W reported northnortheast winds of 37 kts and 4 m (13 ft) seas at 1800 UTC 14 April also after the peak of the wind event.
Gulf of Tehuantepec cold season wind events typically end by the first week of April. However in this past cool season (2007-2008) there was a late season marginal gale event that was captured in the high resolution (12.5 km) QuikSCAT data. This last gale event commenced around 0000 UTC 29 April and lasted for only 18 hours. This is approximately three weeks after the climatologically average ending date for the Gulf of Tehuantepec wind events. QuikSCAT data missed the peak winds during this brief event with the 0007 UTC 15 April QuikSCAT pass noting 30 kts winds in the Gulf of Tehuantepec. There were also no ship reports of gale force winds associated with this brief event as well.
Other Wind Events
Gulf of California Gale 17-18 January 2008
Strong high pressure building into the Pacific northwest and the Great basin of the U.S. pushed a strong cold front southward into the southwestern U.S. and northern Mexico.
The surge of cold air resulted in strong northwest winds over the northern portions of the Gulf of California beginning during the overnight hours of 17 January. A 1259 UTC 17 January high resolution QuikSCAT pass Figure 14 identified a rare, brief gale force wind event in the Gulf of California. Winds of 35 to 40 kts were noted over the extreme northern portions of the Gulf of California. There were no verifying ship reports. The event ended around 0000 UTC 18 January.
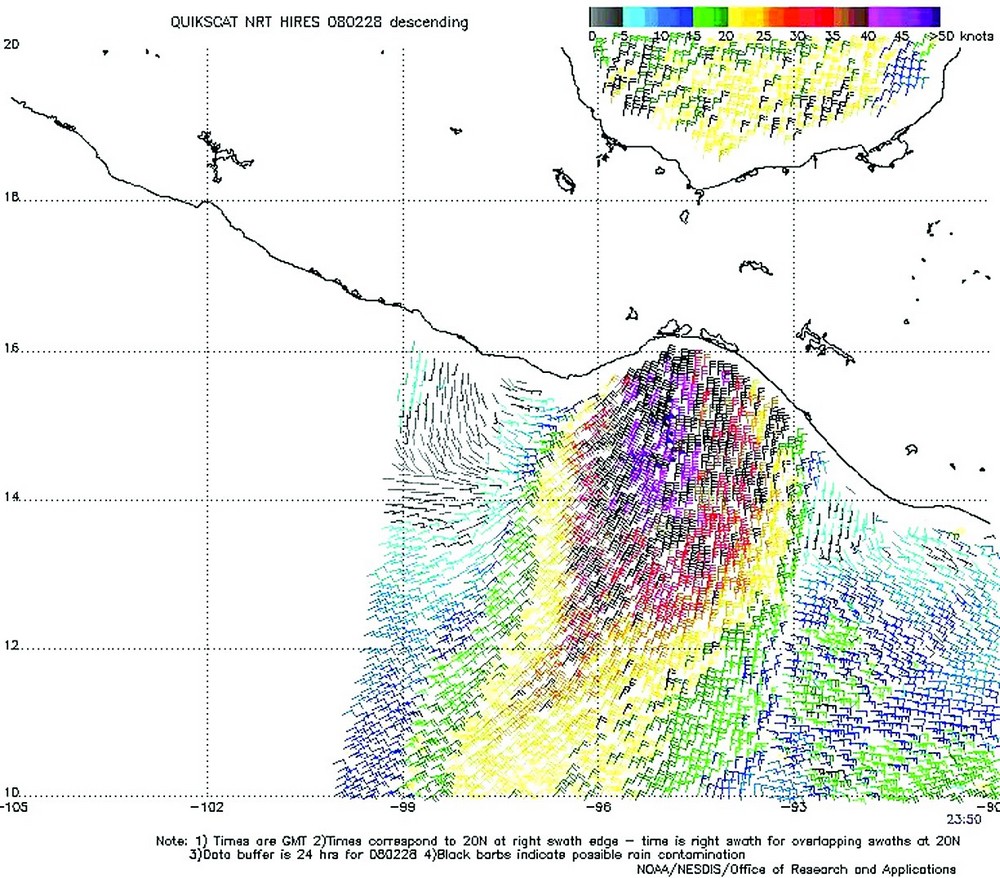
Figure 13. High resolution (12.5 km) QuikSCAT pass from 2350 UTC 27 February 2008 indicating 50-55 kts storm force winds in the Gulf of Tehuantepec.(Click to enlarge)
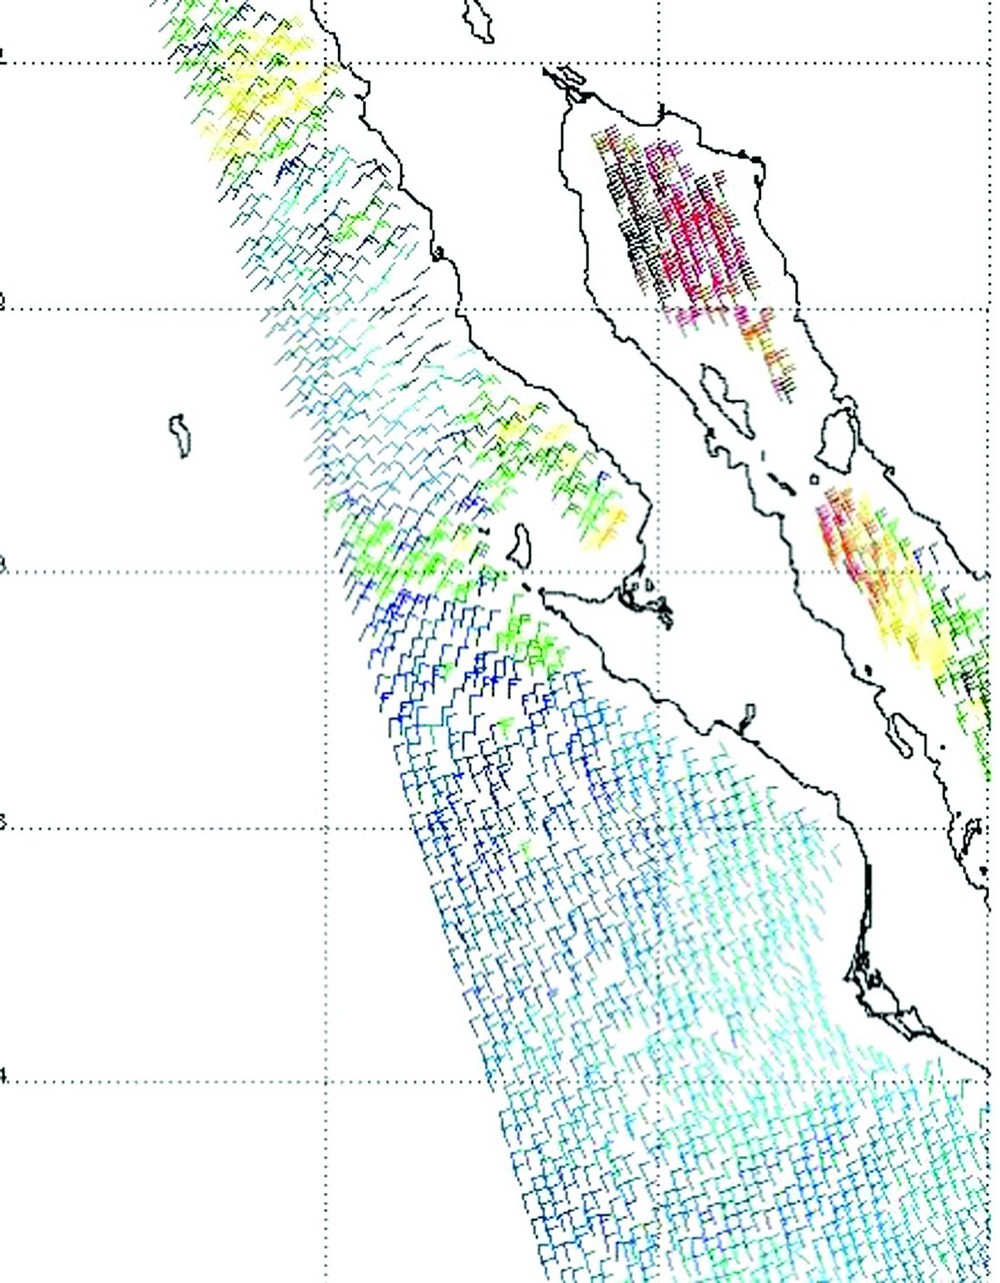
Figure 14. High resolution (12.5 km) QuikSCAT pass from 1259 UTC 17 January 2008 indicating rare 35 kts gale force winds in the northern Gulf of California.(Click to enlarge)
Cold front northwest Pacific 25-26 January 2008
A sharp mid to upper level trough was digging southward along the west coast of the U.S. with the associated surface gale center moving southward from near 39N128W at 0000 UTC 25 January to near 37N128W by 1200 UTC 25 January. A trailing cold front moved into the northwest portions of the marine forecast area just after 0600 UTC 25 January ushering in northwesterly gale force winds of 35 to 40 kts. A 1431 UTC 25 January high resolution QuikSCAT pass indicated a large swath of northwest winds of 30 to 35 kts over the East Pacific north of 28N between 135W and 140W behind the front.
The ship Green Point (WCY4148) located near 28N136.2W reported west-northwest winds of 35 kts at 1200 UTC 25 January. Other ships reporting gale force winds included the Jean Anne (WDC3786) located near 25N140W with north-northwest winds of 40 kts and 4 m seas (13 ft) and the USL Condor (9VKY3) located near 26.3N126W with southwest winds of 40 kts and 4 m seas (13 ft). Both reports were from 0000 UTC 26 January. The gale center continued moving southward over the next 36 hours and skirted the northwest portion of the forecast area just before 0000 UTC 27 January then turned to the northeast away from the area by 1200 UTC 27 January carrying the area of gales to the north of the area.
Cold front northwest Pacific 23-24 February 2008
Low pressure over the central Pacific near 32N144W 1004 hPa at 1800 UTC 22 February rapidly intensified with the central pressure falling 32 hPa to 972 hPa within 12 hours. The low moved to a position near 36.5N138.5W by 0600 UTC 23 February and dragged a cold front into the far northwest portion of the area. Winds increased rapidly to gale force ahead of and also behind the front. A high resolution QuikSCAT pass 1518 UTC 23 February showed strong 40 to 45 kts gale force winds along the northern periphery of the forecast area mainly to the west of the cold front. There were a few ships reporting gale force winds during this event. The ship Horizon Enterprise (KRGB) located near 30.5N138.5W reported southerly winds of 45 kts but no seas at 0000 UTC 23 February.
Six hours later this same ship crossed through the front and reported northwest winds of 35 kts while located near 29.5N140.5W. Unknown Ship (AH8N) located near 29N133W reported west-southwest winds of 45 kts and 8 m seas (26 ft) at 1200 UTC 23 February. Six hours later the same ship reported west-southwest winds of 40 kts and 5 m (16 ft) seas while located near 28N130.5W.
References
Berg, R. and J. Cangialosi, Tropical Atlantic and Tropical East Pacific Areas September through December 2007. Mariners Weather Log, Vol. 52, No. 1, April 2008.
Cobb III, H.D., D.P. Brown, and R. Molleda, 2003. Use of QuikSCAT imagery in the diagnosis and detection of Gulf of Tehuantepec wind events 1999-2002. Preprints, 83rd Annual Meeting/12th Conference on Satellite Meteorology and Oceanography, Long Beach, CA, Amer. Meteor. Soc.
Back to top