Tropical Atlantic and Tropical East Pacific Areas
January to April 2004
Daniel P. Brown and Robbie Berg, Tropical Analysis and Forecast Branch, Tropical Prediction Center Miami, Florida
How accurate are TPCs Possible Tropical Cyclone Forecasts?
Hurricane specialists at the Tropical Prediction Center (TPC)/National Hurricane Center (NHC) routinely issue the Atlantic and Eastern Pacific Tropical Weather Outlooks (TWO) (National Weather Service, 2002). The TWO describes areas of disturbed weather and the potential for tropical cyclone (TC) development in each basin within the next 48 hours. In 2001, the Tropical Analysis and Forecast Branch (TAFB) of the TPC began issuing TC genesis forecasts in graphical and textual marine forecasts. These forecasts are intended to provide additional lead time to mariners in order to help them avoid the hazards posed by TCs.
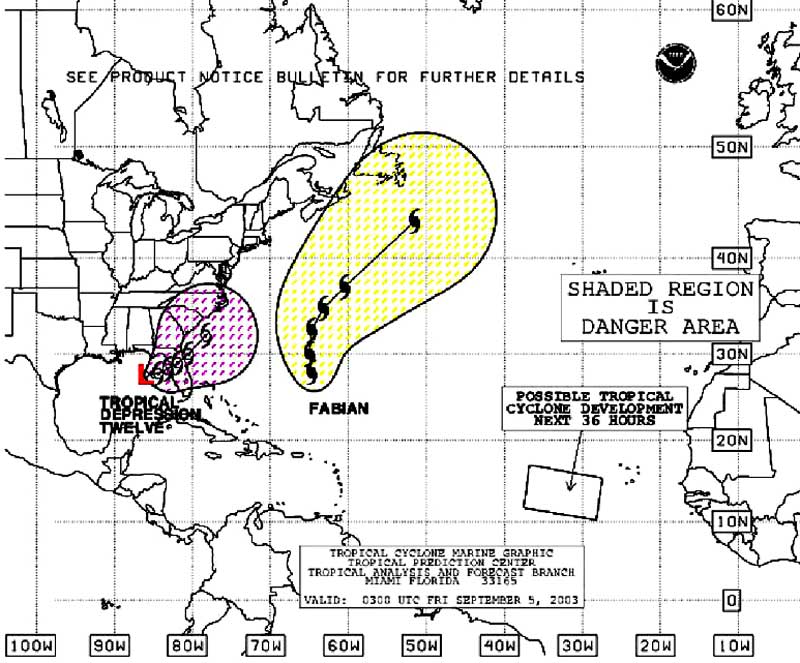 |
Figure 1. Example of a Tropical Cyclone Danger Graphic. Note, the area of "possible" tropical cyclone development in the eastern Atlantic. This weather system developed into Tropical Storm Isabel 34 hours after the issuance of this TCDG. A few days later, Isabel became a Category 5 hurricane over the tropical Atlantic. |
Beginning in 2002, the TC genesis forecasts were included on TAFBs Tropical Cyclone Danger Graphic (TCDG) (Figure 1). The TCDG is available on marine radiofax and the NHC internet homepage (www.nhc.noaa.gov). This graphic depicts areas of possible danger surrounding tropical cyclones by adding 100, 200, and 300 nmi plus the 34-kt wind radii to the 24, 48, and 72 hour NHC forecast positions. This is commonly referred to by mariners as the 123 Rule (Holweg, 2000).
To determine areas of TC genesis, forecasters in TAFB routinely collaborate with the NHC duty hurricane specialist. TAFB forecasters and the hurricane specialist use several tools to help determine the potential for development. Forecasters use satellite intensity estimates to determine the organization of the system and will use numerical model forecast to help ascertain the likelihood of future development. When a weather system is determined to be a candidate for development within 36 hours, an area of possible development is then depicted graphically on the TCDG. The region depicted typically encompasses a horizontal area of about 300,000 km2.
The TC genesis forecasts from the TCDG were verified based on the development of a tropical cyclone (tropical depression or greater) (Brown et al., 2004). The probability of detection (POD), false alarm rate (FAR) and average lead time were computed. The POD is defined as the percentage of TCs that were correctly forecast to develop. The FAR is defined as the percentage of incorrect TC genesis events out of the total number of events forecast. The average lead time is defined as the time between the first possible TC forecast and the time of the first NHC forecast/advisory.
The POD for the Atlantic Basin was 79% in 2002 and 83% in 2003 (Table 1). The FAR for the Atlantic Basin was 32% in 2002 and remained at 32% in 2003. Therefore, in about one-third of the cases in which genesis was forecast, the weather system in question did not develop. The average lead time in the Atlantic Basin increased from 14 hrs in 2002 to 28 hrs in 2003.
| Atlantic | 2002 | 2003 |
| Probability of Detection (POD) | 79% (11/14) | 83% (15/18) |
| False Alarm Rate (FAR) | 32% (6/19) | 32% (7/22) |
| Avg. Lead Time | 14 hrs | 28 hrs |
| Table 1. Atlantic Basin results of TC genesis forecasts during the 2002\03 tropical seasons. Note, the 2003 forecasts do not include forecasts for Tropical Storms Ana, Odettee, and Peter, since they developed outside of the hurricane season. |
The POD for the Eastern Pacific Basin is better than for the Atlantic (Table 2). In 2002, 94% of the tropical cyclones that formed in the Eastern Pacific were detectedearly. In 2003, 100% were detected early. The FAR for the eastern Pacific was 21% in 2002 and increased to 43% in 2003. The average East Pacific lead time was 34 hrs in 2002 and 27 hrs in 2003.
| East Pacific | 2002 | 2003 |
| Probability of Detection (POD) | 94% (15/16) | 100% (16/16) |
| False Alarm Rate (FAR) | 21% (4/19) | 43% (12/28) |
| Avg. Lead Time | 34 hrs | 27 hrs |
| Table 2. East Pacific Basin results of TC genesis forecasts during the 2002-03 tropical seasons. |
Combining the results for both basins for both years provides a good overall indication of accuracy of these forecasts. The combined POD is 89% (57/64), the FAR is 33% (29/88), and the average lead time is 26 hrs (a lead time of 0 hr was assigned to the 7 undetected cases). For mariners using these forecasts, the combined results conclude that in about 9 out of 10 cases TC genesis was correctly forecast with an average lead time of slightly more than 24 hrs. In about a third of the cases the system in question did not develop.
These results indicate that TPCs TC genesis forecasts can provide increased lead times for mariners in most cases. The forecasts are being provided with a low number of false alarms. With improvements in numerical model forecasts it is believed that more accurate forecasts can be produced in the future.
Changes to the Atlantic and East Pacific Tropical Weather Discussions
At 1605 UTC (12:05 pm EDT) on Tuesday, July 6, 2004, the Tropical Analysis and Forecast Branch (TAFB) of the National Hurricane Center/Tropical Prediction Center (NHC/TPC) will modify the format of the Atlantic and East Pacific Tropical Weather Discussions. Both products will become more user-friendly, with improvements in the discussion content and layout. A National Weather Service product survey was conducted on the proposed changes between January and April, and the user responses have largely applauded these modifications.
The current version of the Atlantic Tropical Weather Discussion (MIATWDAT) is divided into five sections that address specific features within separate levels of the atmosphere over the tropical and subtropical area. The new version of the TWDAT aims to simplify this disconnection of weather features at several atmospheric layers and combine the features into a more complete and comprehensive manner. The new format will only contain four sections-special features, tropical waves, ITCZ, and discussion. Unlike the older format, the special features and tropical waves sections will only be included in the discussion when these features actually exist in the Atlantic basin. However, the ITCZ and discussion sections will be included year-round. The core of the TWDAT changes lies within the purpose of the discussion section. Essentially, this section now incorporates all features from the middle/upper level features, surface synoptic features, and significant clouds/convection sections in the current version to form a coherent discussion in which features from all layers of the atmosphere and associated convection are included. Also, the discussion will be divided into several geographical regions according to the current weather pattern. These regions may include-but are not limited to-Gulf of Mexico, Caribbean, West Atlantic, Central Atlantic, East Atlantic, Subtropical Atlantic, and Tropical Atlantic.
The East Pacific Tropical Weather Discussion (MIATWDEP) will be modified in a similar fashion to the changes to the TWDAT. The TWDEP will include the same four headings as the new Atlantic discussion and will abide by the same rules for including certain sections. This is a major deviation from the current version since middle and upper level features are not currently included in the product. The TWDEP will also contain regional sections according to the weather pattern (i.e. East of 110 W, West of 125 W, Mexican Coast, and Central American Coast).
Significant Weather of the Period
Atlantic, Caribbean and Gulf of Mexico:
A total of 13 gale events occurred over the tropical and subtropical Atlantic, Caribbean and Gulf of Mexico from January through May 2004 (Table 3). The majority of the gale events were associated with either low pressure centers or strong cold fronts that moved southeast across the Gulf of Mexico and western Atlantic. These gale events generally lasted about 24 to 48 hours.
| Gales Events in the Tropical Atlantic, Caribbean and Gulf of Mexico
January Through May 2004 | |||
| Event | Area | Beginning | Ending |
| 1 | S. Caribbean Gale Area | 1200 UTC 1 January | 1800 UTC 4 January |
| 2 | Atlantic Cold Front | 1800 UTC 15 January | 0000 UTC 19 January |
| 3 | W. Atlantic Cold Front | 1800 UTC 18 January | 0600 UTC 20 January |
| 4 | Central Atlc. Cold Front | 1200 UTC 1 February | 0000 UTC 2 February |
| 5 | W. Atlantic Cold Front | 0600 UTC 19 February | 1800 UTC 19 February |
| 6 | W. Atlantic Cold Front | 0000 UTC 26 February | 1200 UTC 26 February |
| 7 | W. Atlantic Low | 0600 UTC 28 February | 1200 UTC 29 February |
| 8 | S. Caribbean Gale Area | 0000 UTC 2 March | 1200 UTC 6 March |
| 9 | W. Atlantic Cold Front | 1200 UTC 10 March | 1200 UTC 11 March |
| 10 | Strong W. Atlantic High Pressure | 0000 UTC 25 March | 1800 UTC 26 March |
| 11 | E. Atlantic Low | 1200 UTC UTC 1 April | 1800 UTC 2 April |
| 12 | Central Atlantic Low | 1800 UTC 11 April | 1800 UTC 14 April |
| 13 | SW Gulf of Mexico Cold Front | 1200 UTC 2 May | 1200 UTC 3 May |
| Table 3. Estimated beginning and ending times of gale events in the tropical Atlantic, Carribean, and Gulf of Mexico from January to May 2004. |
Two somewhat unusual gale events occurred during the period across the southern Caribbean Sea along the coast of Colombia. These events were produced when strong high pressure built over the western Atlantic and lower pressures remained over Colombia. The first of the southern Caribbean gale event of the period occurred from the 1st to the 4th of January. On the 1st, two ships, the Gen. Hoyt S. Vandenberg (call sign NBBP) and the Comoros Stream (PBBW) both observed 35 kt winds just north of the Colombian Coast. On the 2nd and 3rd several ships, including the Star Dover (LAEP4), Timmar III (H3QA), Polar Uruguay (ELTH2), and Duncan Island (C6JS) observed 35 to 40 kt winds in the southern Caribbean. It is fairly common for ships to encounter strong winds in the southern Caribbean. However, it is unusual that so many ship observations of gale force winds were received during this event. The second southern Caribbean gale event occurred between the 2nd and 6th of March. During this event the South Hampton Star (3FWT9) and the P&O Nedlloyd Houston (PGEB) reported gale force winds in the southern Caribbean.
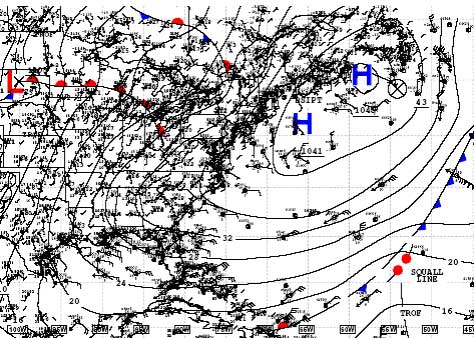 |
Figure 2. TPC Surface Analysis at 1200 UTC 25 March 2004. Note the strong 1045 hPa high off the coast of Nova Scotia. This high produced an area of gale force winds over the southwest North Atlantic. |
In late March, a high pressure center strengthened off the northeastern United States coast. This high produced strong northeast winds over the southwestern north Atlantic for several days. This included a period of gale force winds on the 24-26 March. Late on the 24th, a 15-17 mb pressure gradient was noted between 32°N and the coast of eastern Cuba. This gradient produced gale force winds from the central and southern Bahamas northeastward to southeast of Bermuda. Several ships in the area including the Explorer of the Seas (ELWX5), Green Lake (WDDI), and V2JZ (name unknown) reported 35 to 40 kt winds between the Bahamas and 65°W at 0000 UTC 25 March. At 1200 UTC the high was centered just off the coast of Nova Scotia (Figure 2). At this time the high had strengthened to 1045 hPa and it continued to produce gale force winds well to its south. Because of the long duration and fetch of the strong winds, seas built to 4 to 5.5 m (14 to 18 ft) east of the Bahamas. Late on the 26th, the high began to weaken as it moved east-northeastward across the north Atlantic. At this time the winds decreased below gale force.
An unusually late season cold front produced gale force winds over the southwest Gulf of Mexico on the 2nd and 3rd of May. During this event, strong high pressure built southward behind the front over northern Mexico. QuikSCAT detected the presence of gale force winds along the coast of Mexico and the southwest Bay of Campeche. The event lasted about 24 hours and ended at 1200 UTC 3 May. This high event also produced a late-season gale event in the Gulf of Tehuantepec.
Eastern North Pacific
The 2003-2004 Gulf of Tehuantepec gale season was rather active with a total of 25 gale events between early November and early May. Fourteen of these events occurred between January 1st and May 5th. Storm force winds occurred during two of these events. Table 4 is a list of the estimated beginning and ending times of Gulf of Tehuantepec gale and storm events between January and May 2004. These events were verified by either a reliable ship observation or QuikSCAT data. The majority of the events lasted about 24 to 48 hours while two events continued for about 4 days.
| Gulf of Tehuantepec Gale and Storm Events
January Through May 2004 | ||
| Event | Beginning | Ending |
| 1 | 0000 UTC 7 January | 1800 UTC 8 January |
| 2* | 0600 UTC 10 January | 1800 UTC 13 January |
| 3 | 1800 UTC 19 January | 1800 UTC 20 January |
| 4 | 1800 UTC 27 January | 0000 UTC 29 January |
| 5 | 1800 UTC 3 February | 0000 UTC 4 February |
| 6 | 0600 UTC 7 February | 0600 UTC 9 February |
| 7* | 1800 UTC 16 February | 1800 UTC 19 February |
| 8 | 1800 UTC 26 February | 1200 UTC 28 February |
| 9 | 1200 UTC 8 March | 1200 UTC 12 March |
| 10 | 0600 UTC 21 March | 0000 UTC 25 March |
| 11 | 1800 UTC UTC 13 April | 1800 UTC 15 April |
| 12 | 1800 UTC UTC 18 April | 1800 UTC 19 April |
| 13 | 0000 UTC 28 April | 1200 UTC 28 April |
| 14 | 0000 UTC 3 May | 1200 UTC 5 May |
| Table 4. Estimated beginning and ending times for Gulf of Tehuantepec gale and storm events from January through May, 2004. Storm events are denoted with an asterisk (*). |
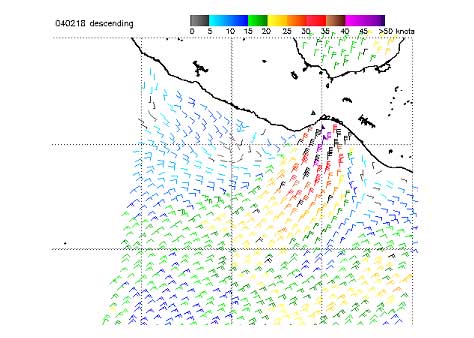 |
Figure 3. QuikSCAT data from 0033 UTC 18 February 2004. |
One of the strongest events of the period began around 0600 UTC 10 January. At this time winds increased to gale force in the Gulf of Tehuantepec. Early on the 11th stronger high pressure began building southward over the southwestern Gulf of Mexico. This increased the winds to storm force by 0600 UTC in the Gulf of Tehuantepec. At this time the ship Rotterdam Express (DMRX) observed storm force winds near 14°N 96°W. Storm force winds continued for nearly 24 hours. Winds decreased to below gale force around 1800 UTC 13 January. Another storm force wind event occurred in mid-February. The event began as winds increased to gale force around 1800 UTC 16 February. Surface pressures increased to 1030 mb over the southwest Gulf of Mexico late on the 17th. At this time winds increased to storm force. An 0033 UTC 18 February QuikSCAT pass (Figure 3) measured 50 kt winds in the Gulf of Tehuantepec. The next QuikSCAT pass at 1136 UTC also reported 50 kt winds. Winds decreased below storm force late on the 18th and decreased below gale force at 1800 UTC 19 February.
Four late-season Gulf of Tehuantepec gale events occurred between mid-April and early May. The event that occurred in early May is the latest event that has been verified by QuikSCAT since 1999.
References
Brown, D.P., R. Molleda, and R.J. Pasch, 2004: Verification of Tropical Cyclone Genesis Forecasts from the TPCs Tropical Analysis and Forecast Branch (TAFB). Preprints, 26th Conf. Hurr. Trop. Meteor., Miami Beach, Amer. Meteor. Soc., 268-269.
Holweg, E.J. 2000: Mariners Guide For Hurricane Awareness in the North Atlantic Basin.
National Weather Service, 2002. NWS Policy Directive 10-6, Operations and Services: Tropical Cyclone Weather Services Program. Dept. of Commerce/NOAA/NWS.
Page last modified: