Marine Weather Review North Pacific Area
September to December 2008
Introduction
The weather pattern over the North Pacific became increasingly active for extratropical cyclones especially beginning in October and continuing in November as the northern latitudes cool rapidly in relation to the ocean, increasing north to south temperature contrasts. The number of cyclones producing hurricane force winds increased from none in September to four in October and six in November. The general track of low pressure systems was southwest to northeast especially in these months. Increased presence of blocking high pressure in December brought more variability, formation of cut-off lows at low latitudes and fewer hurricane force systems, with the number down to four versus six in the previous month.
Tropical cyclones in the northwestern Pacific were most active in September when three appeared on OPCs oceanic analysis charts. The numbers declined to one each in the other months. Most of these were weak with only Sinlaku in September and Dolphin in December becoming typhoons. Overall this period was a lot less active in number, strength and longevity of western Pacific tropical systems affecting OPCs radiofacsimile chart area, compared to the same period a year ago.
Tropical Activity
Tropical Storm 16W: This cyclone formed from a non-tropical low near 30N 146E late on September 9 with maximum sustained winds of 35 kts with gusts to 45 kts. The cyclone then varied in strength while drifting northwest but not exceeding minimal tropical storm strength. The cyclone then became extratropical late on the 11th and then moved to the northern Kurile Islands as a gale late on the 12th before turning east and eventually weakening near northern California on the 18th.
Tropical Depression 17W: This short-lived tropical cyclone formed from a non-tropical low near 34N 149E late on September 13 with maximum sustained winds of 30 kts with gusts to 40 kts. It then merged with a front by the 14th and became an extratropical gale force low. The remains of 17W then tracked northeast to Kodiak Island as a gale by the 18th.
Typhoon Sinlaku: Tropical Storm Sinlaku moved northeast into OPCs chart area just south of Japan late on September 18 when it briefly became a typhoon with maximum sustained winds of 70 kts with gusts to 85 kts. Sinlaku then weakened to a tropical storm early the next day with its winds lowering to 45 kts sustained winds and gusts to 55 kts late on the 19th. The cyclone became extratropical by the 20th with some intensification into a compact storm-force low east of Japan near 35N 147E early on the 20th before weakening again to a frontal wave of low pressure near 34N 164E late on the 22nd with winds diminishing to below gale force.
Tropical Storm Bavi: Bavi began as Tropical Storm 23W prior to being named, forming from a nontropical low near 24N 149E at 1800 UTC on October 18. Twelve fours later it became Tropical Storm Bavi (27N 148E) with maximum sustained winds of 35 kts with gusts to 45 kts. Bavi moved northeast and attained a peak intensity with 45 kts sustained winds and gusts to 55 kts late on the 19th Figure 4 before merging with a strengthening extratropical low six hours later.
Tropical Storm Haishen: This cyclone formed from a non-tropical low near 25N 149E at 1800 UTC November 15 with maximum sustained winds of 35 kts with gusts to 45 kts. The cyclone moved northeast with slight strengthening but was short-lived as a tropical cyclone, becoming extratropical late on the 16th before merging with a frontal zone early on the 18th. Haishens remains then re-intensified to an extratropical storm near 43N 179W (998 hPa central pressure) late on the 18th before turning southeast and dissipating near 39N 163W three days later.
Typhoon Dolphin: Tropical Storm Dolphin passed just south of OPCs southwestern map area before turning north in mid-December and intensifying to a typhoon. The maximum strength was 85 kts for sustained winds and gusts to 105 kts when the cyclone passed near 16N 131E at 0000 UTC December 16. Dolphin weakened to a tropical storm by the 17th and to a tropical depression near 25N 142E early on the 18th. The cyclone then became extratropical later that day before dissipating the following day.
Other Significant Events
Northeast Pacific Storm, October 5-7: Figure 1 depicts the main development of this relatively compact hurricane force low. This cyclone was one of several of similar intensity to visit this area of the Pacific during the period, mainly in October and November. This was a short-lived event allowing only about twelve hours of hurricane force winds on the 6th before the system passed inland early on the 7th. Winds as observed in QuikSCAT imagery were similar to those in the late October event Figure 7. Winds to 65 kts appeared southwest of the center in the actual imagery. The Horizon Tacoma (KGTY) reported a northwest wind of 50 kts near 50N 130W at 0600 UTC on the 7th, the higest wind report from a ship. The vessel C6SI3 (48N 128W) encountered west winds of 45 kts and 12.0 m seas (39 ft) at the same time, the higest reported seas in this event. Buoy 46132 (49.7N 127.9W reported west winds of 40 kts and 6.0 m seas (20 ft) at 0900 UTC on the 7th with a maximum of 6.5 m(22 ft) one hour later.
North Pacific and Bering Sea Storm, October 8-10: Figure 2 displays the development of this major cyclone over a twenty-four hour period. The central pressure fell 31 hPa in this period, with the cyclone developing hurricane force winds mainly in the Bering Sea as shown in Figure 3, although reports of 65 kts are mainly isolated in the scatterometer imagery. Buoy 46035 (57N 177.7W) near the area of strongest winds reported a north wind of 50 kts sustained and seas of 10.5 m (35 ft) at 2200 UTC on the 9th. The ship SIWB (52N 174E) reported northwest winds of 50 kts and 6.0 m seas (20 ft) at 0000 UTC on the 10th, while the APL Singapore (WCX8812) encountered north winds of 40 kts and 8.0 m seas (27 ft). The cyclone then looped southeast out of the Bering Sea on the 10th with its winds weakening to storm force by then. The system then weakened to a gale near 52N 157W by the 11th before dissipating as a new low center formed to the north by the 12th.
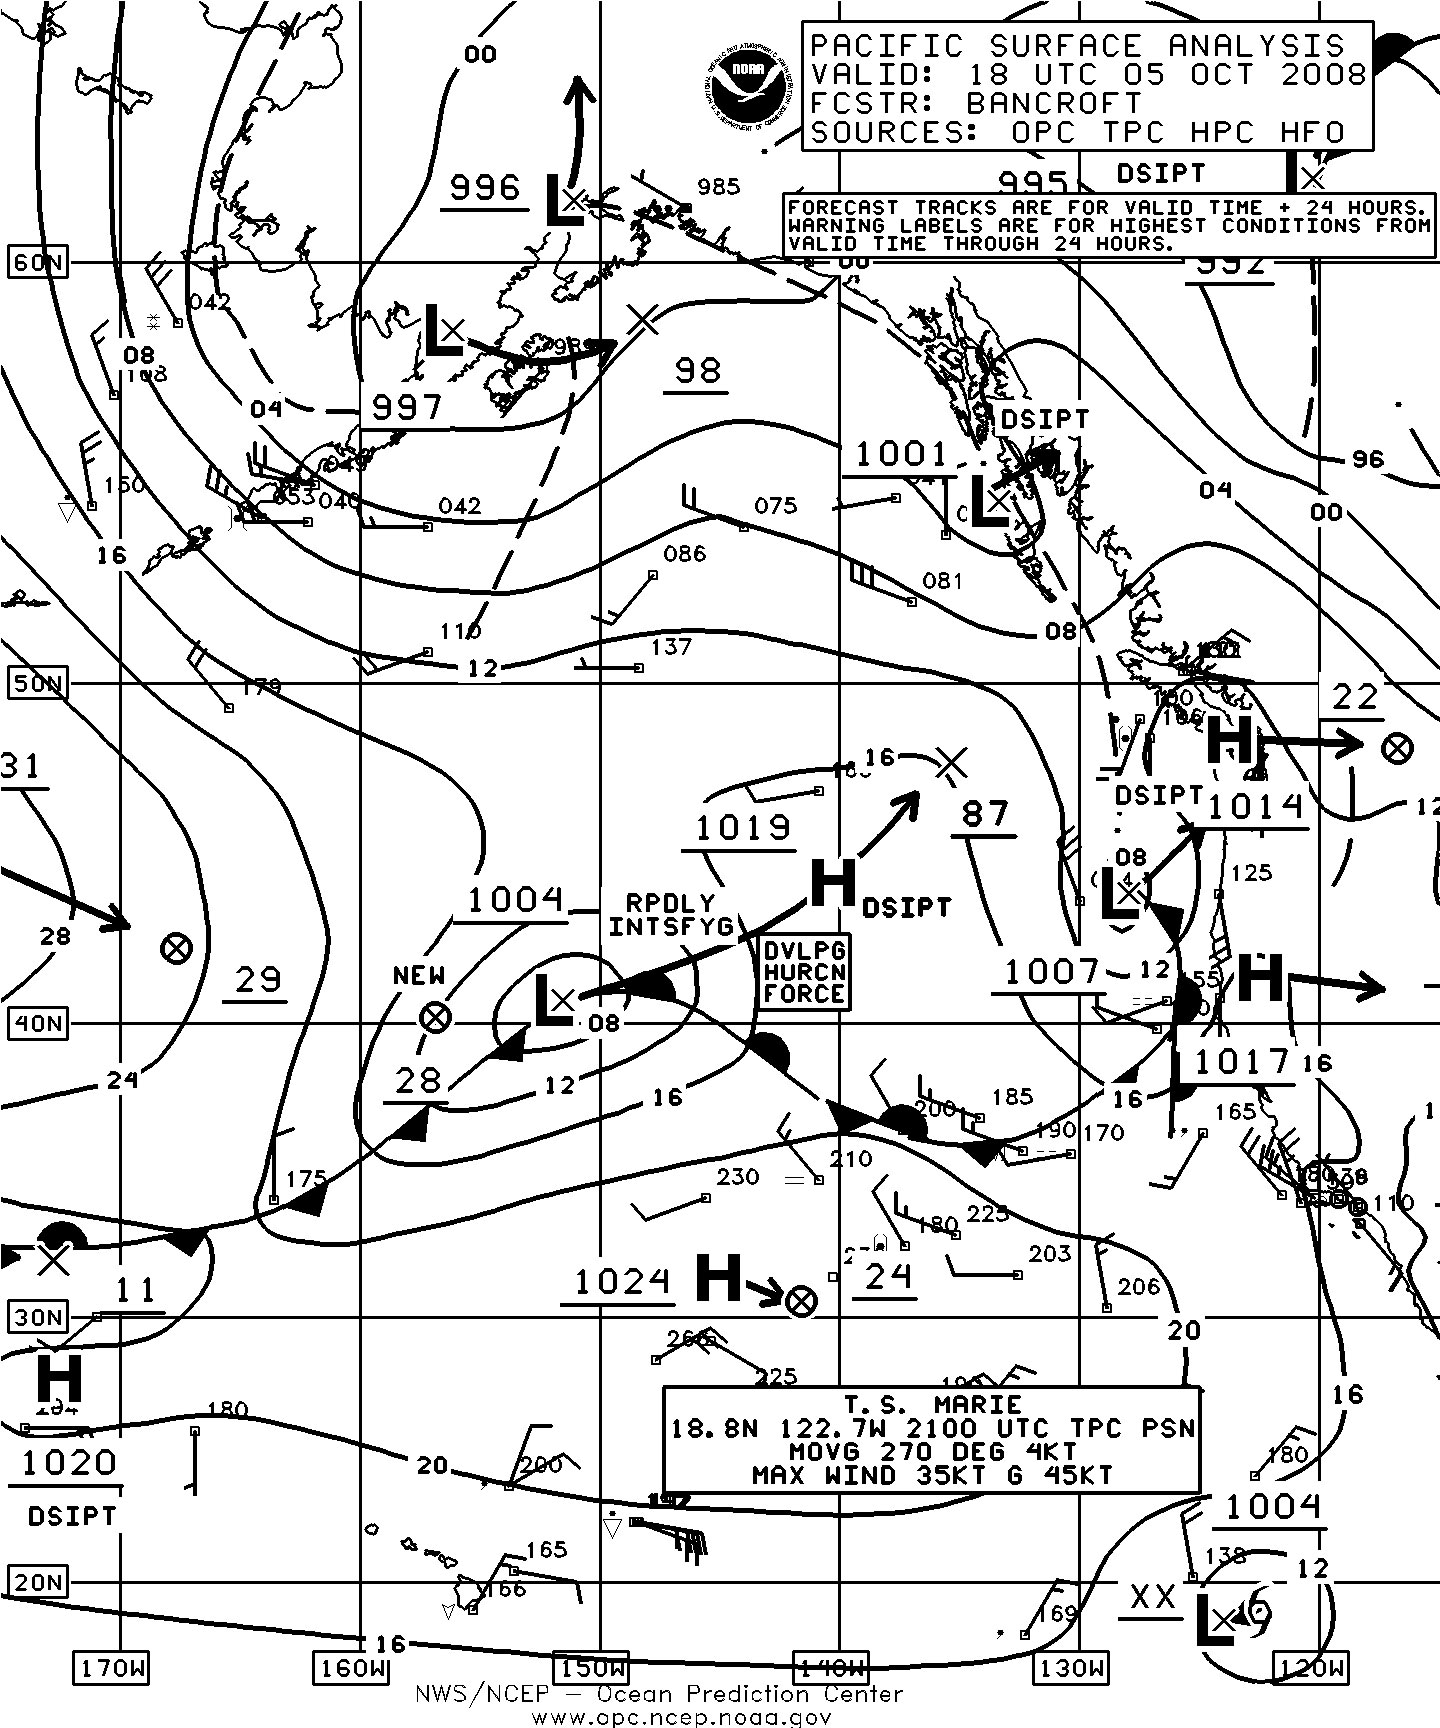
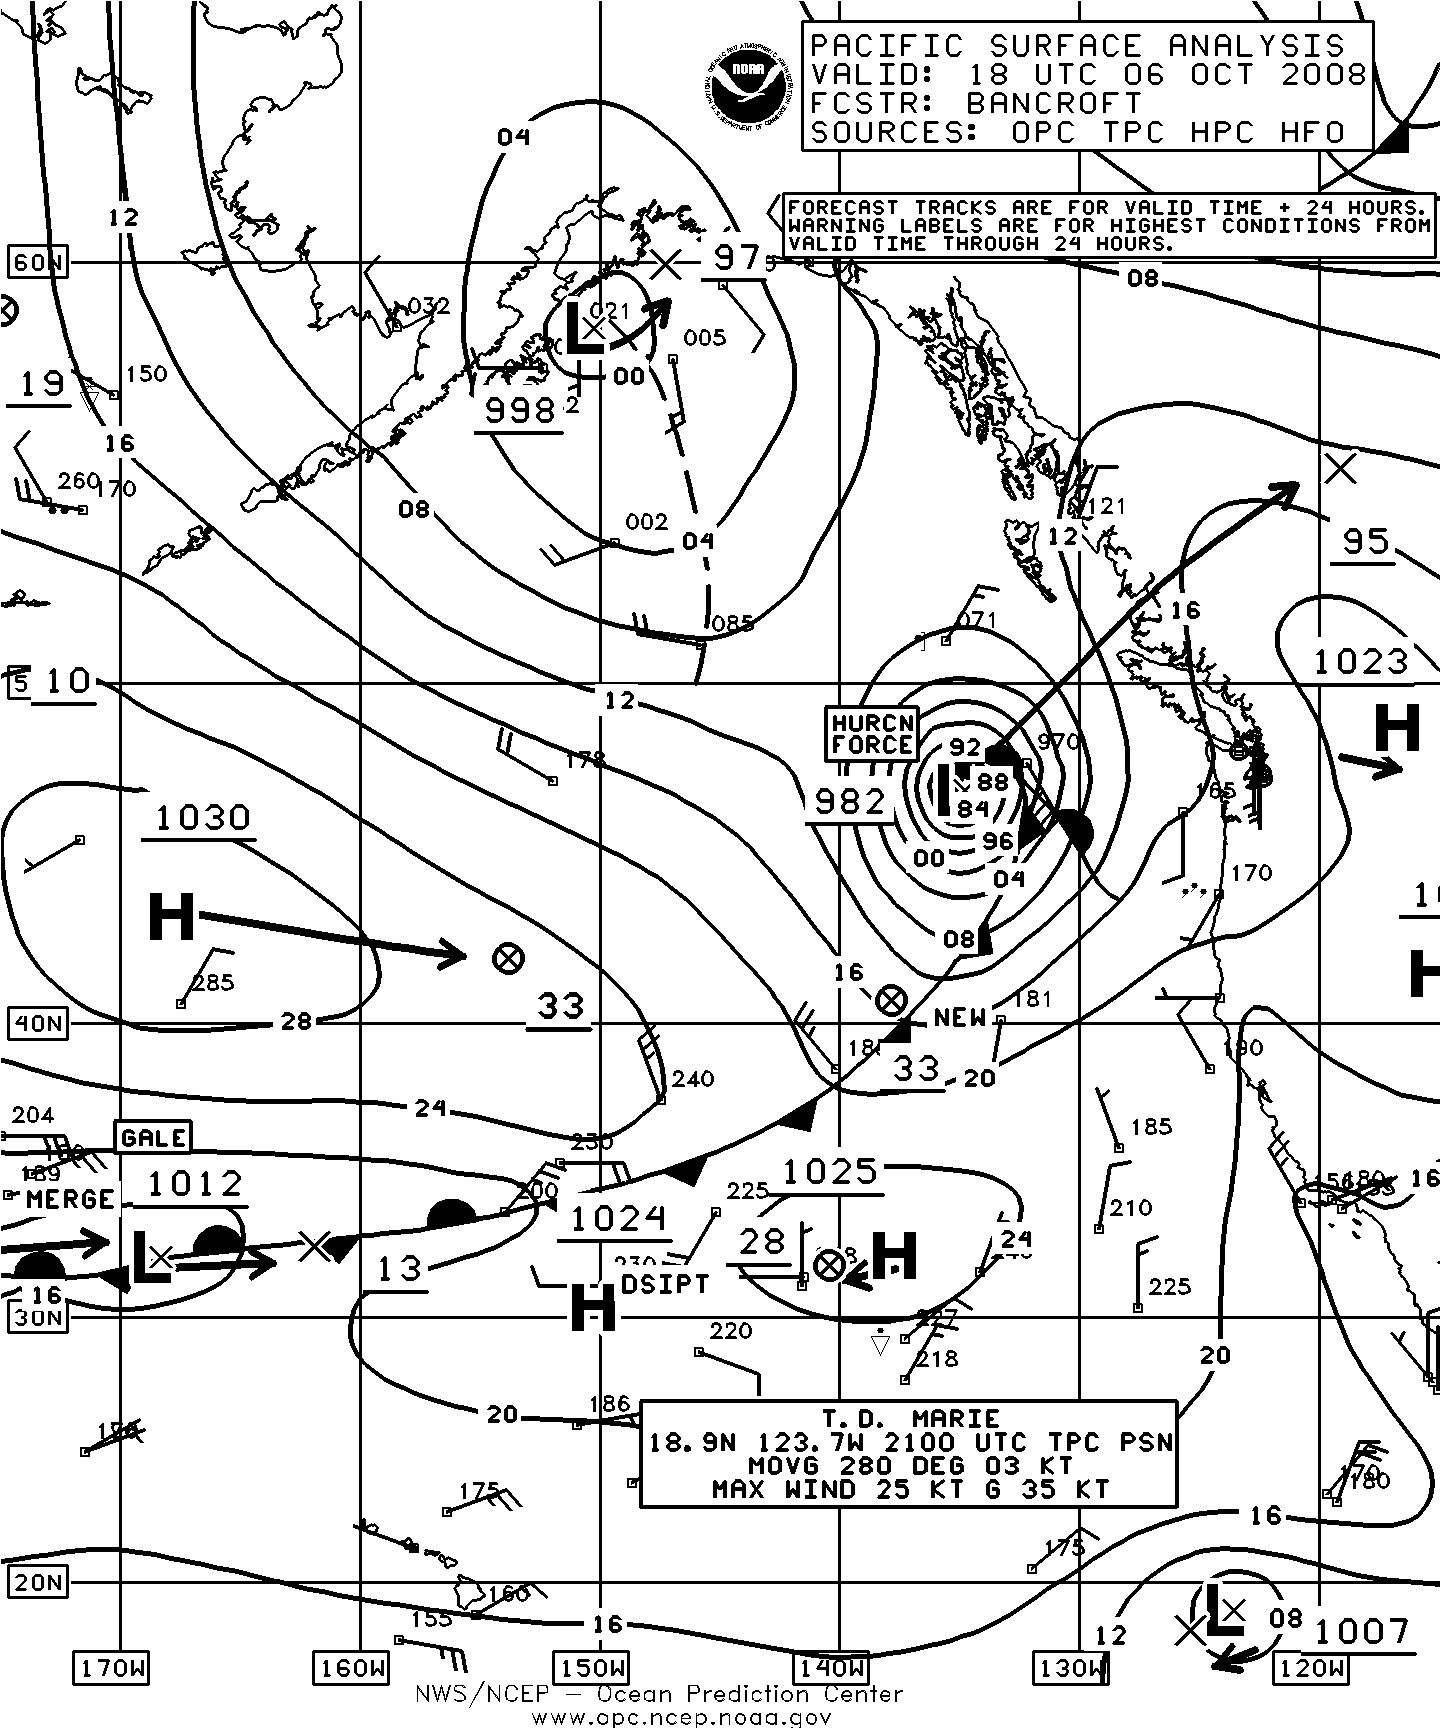
Figure 1. OPC North Pacific Surface Analysis charts (Part 1 - east) valid 1800 UTC October 5 and 6, 2008. Twenty-four hour forecast tracks are shown with the forecast central pressures given as the last two whole digits in millibars.(Click on image to enlarge)
Figure 2. OPC North Pacific Surface Analysis charts (Part 2 - west) valid 1200 UTC October 8 and 9, 2008. (Click on image to enlarge)

Figure 3. High resolution QuikSCAT scatterometer image of satellite-sensed winds around the storm shown in the second part of Figure 2. The resolution is 12.5 km, versus 25 km in the coarser resolution version of QuikSCAT imagery. The valid time of the pass is 1626 UTC October 9, 2008, or about four and one half hours later than the valid time of the second part of Figure 2. The center of the cyclone appears near 55N 172W in the center of the image. Image is courtesy of NOAA/NESDIS/ Office of Research and Applications. (Click on image to enlarge)
| Observation | Position | Date/Time (UTC) | Wind | Seas (m/ft) |
|---|---|---|---|---|
| Unknown ship | 51N 130W | 10/0000 | SE 55 | 9.0/30 |
| Zim U.S.A. (4XFO) | 49N 137W | 10/0000 | NW 50 | 6.0/19 |
| Unknown ship | 51N 129W | 10/0600 | SE 60 | |
| KIYI | 49N 129W | 10/0900 | SW 45 | 10.0/33 |
| Buoy 46006 | 40.9N 137.5W | 08/1900 09/1100 |
SW 41 G52 Peak 62 maximum |
8.5/ 28 |
| Buoy 46036 | 48.4N 133.9W | 09/1100 09/1500 |
NE 39 G51 maximum |
7.5/25 |
| Buoy 46005 | 46N 131W | 09/1200 09/1300 09/1400 |
S 47 G60 Peak gust 62 maximum |
11.0/36 12.0/39 |
| Buoy 46002 | 42.6N 130.5W | 09/0300 09/0500 |
S 39 G47 Peak 54 maximum |
6.0/20 7.5/25 |
| Buoy 46050 | 44.6N 124.5W | 09/1900 09/2100 |
SE 35 G41 Peak 43 maximum |
5.0/16 6.5/21 |
| Buoy 46089 | 45.9N 125.8W | 09/1700 09/1900 |
SE 39 G51 maximum |
6.5/21 7.5/25 |
| Buoy 46204 | 51.4N 128.8W | 10/1200 10/0500 |
SW 29 G37 5 maximum |
6.0/20 6.5/21 |
| Buoy 46207 | 50.9N 129.9W | 10/0400 10/0600 |
SE 41 G52 maximum |
8.5/28 9.5/31 |
| Buoy 46183 | 53.6N 131.1W | 10/1200 | SE 45 G56 | 6.0/20 |
North Pacific Storm, October 17-19: This developing storm tracked east near 49N south of the Aleutians from October 15 to 17, briefly developing hurricane force winds with a 977 hPa center near 49N 154W at 0600 UTC October 18. The cyclone then began to weaken and turned southeast late on the 19th, and dissipated near Vancouver Island on the 20th.
North Pacific Storm of October 19-23: See the Tropical Activity section above for information on Tropical Storm Bavi. Figure 4 shows Bavi becoming ingested by a developing extratropical low late on the 20th. The resulting hurricane force cyclone became the most intense of the period, with the center developing a lowest central pressure of 946 hPa (27.94 inches) at 0600 UTC October 22, or six hours later than the valid time of the second part of Figure 4. The central pressure fell 32 hPa in the twenty-four hour period ending at this time. The ship PCHI (54N 166W) reported an east wind of 60 kts at 0000 UTC on the 23rd, followed six hours later by a report of northeast winds of 45 kts and 10.0 m seas (32 ft). At 1800 UTC on the 21st the ship OULL2 encountered southwest winds of 55 kts near 42N 174E. Buoy 46071 (51.2N 179.0E) reported a northeast wind of 49 kts with gusts to 64 kts at 0700 UTC on the 22nd followed one hour later by a peak gust of 68 kts. The same buoy reported 8.0 m seas (27 ft) two hours prior. Figure 5 is a high resolution scatterometer image showing winds as high as 80 kts on the south side of the cyclone. The cyclone began a slow weakening trend as it headed 31 northeast, but hurricane force winds lasted from early on the 21st until the night of the 22nd, a period of about thirty-six hours. The system elongated northeastward toward the Gulf of Alaska on the 23rd before weakening inland on October 24.
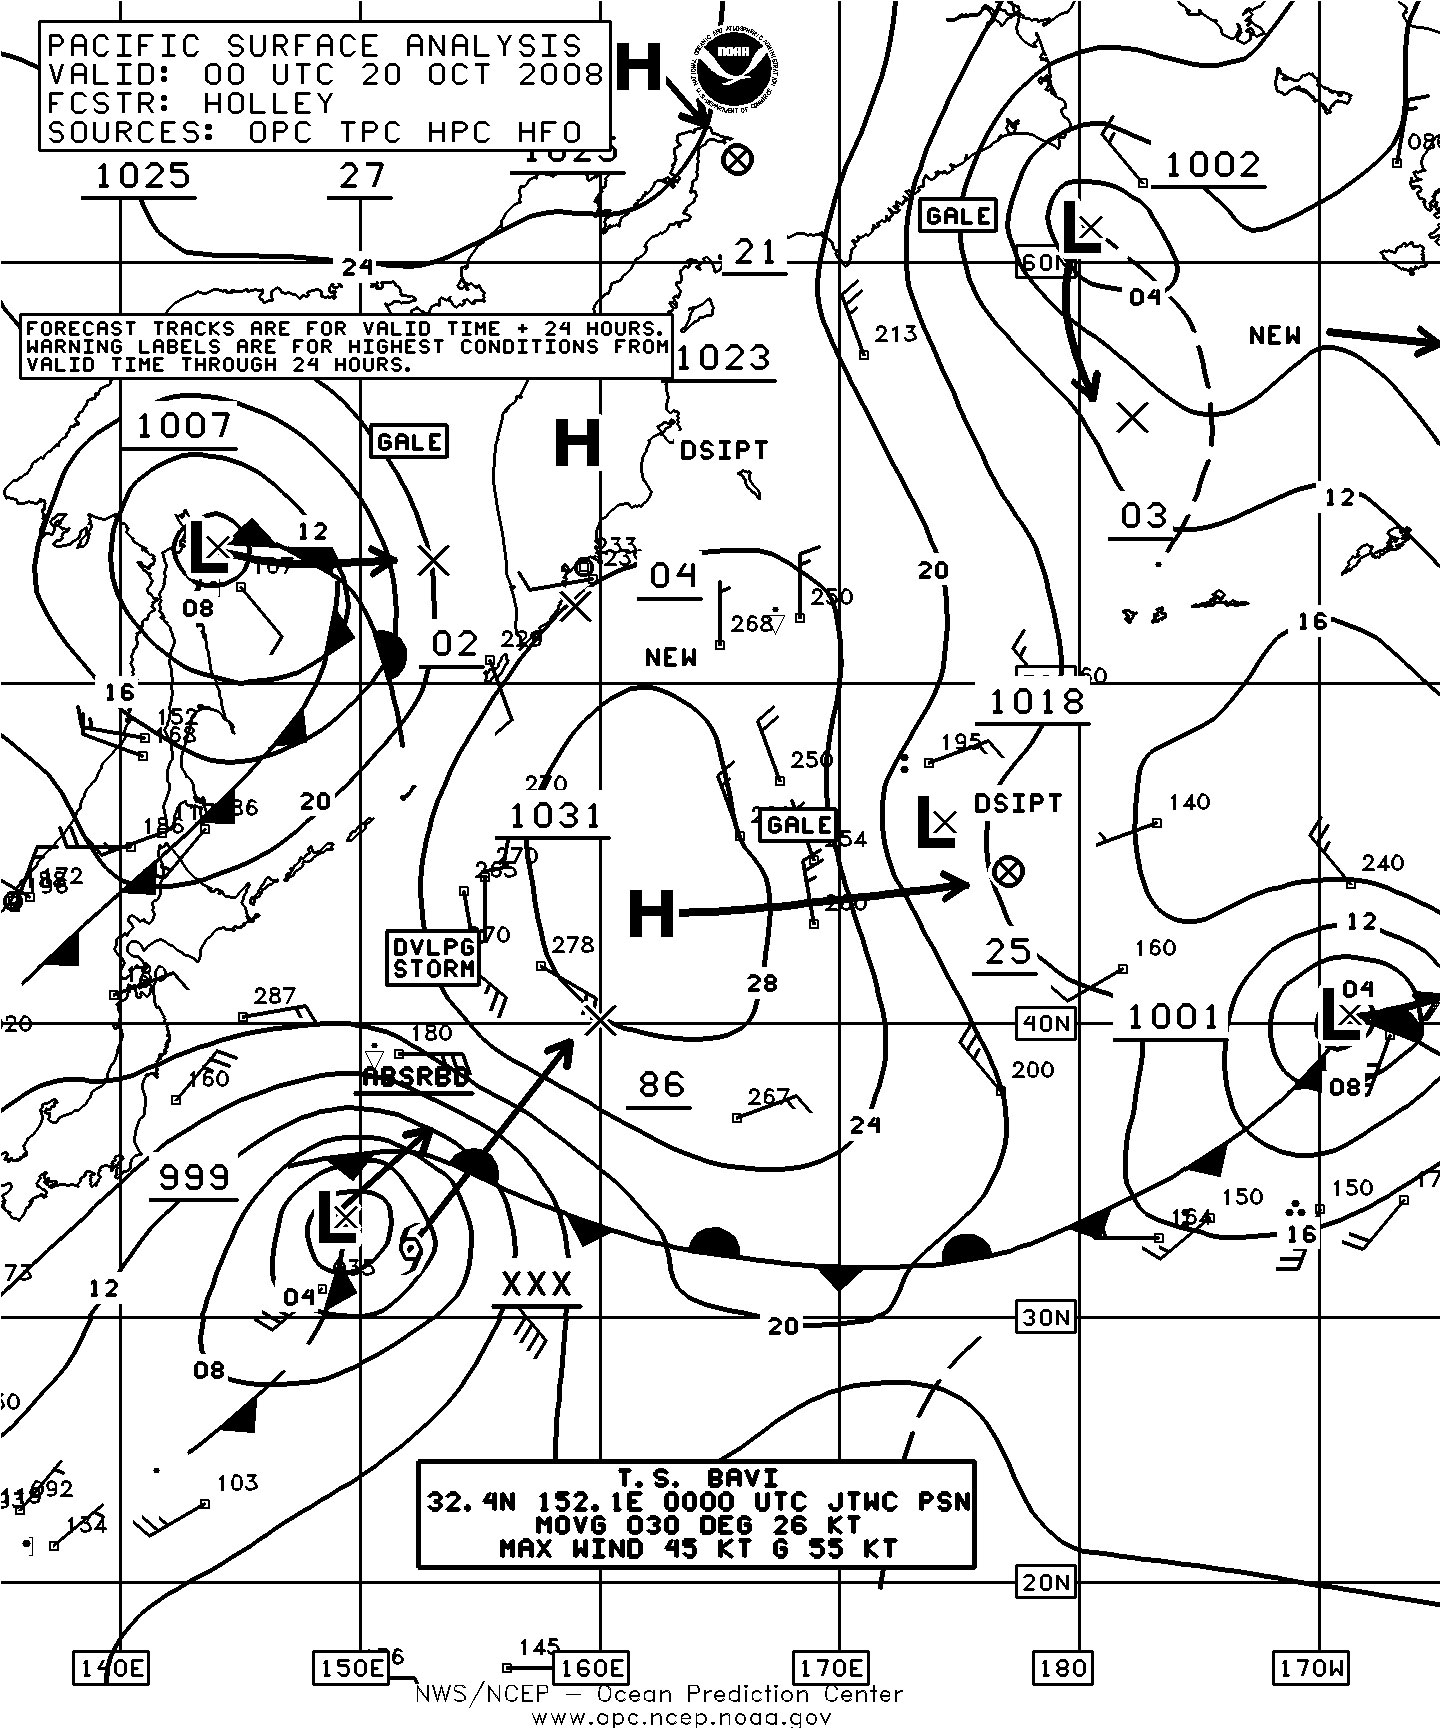
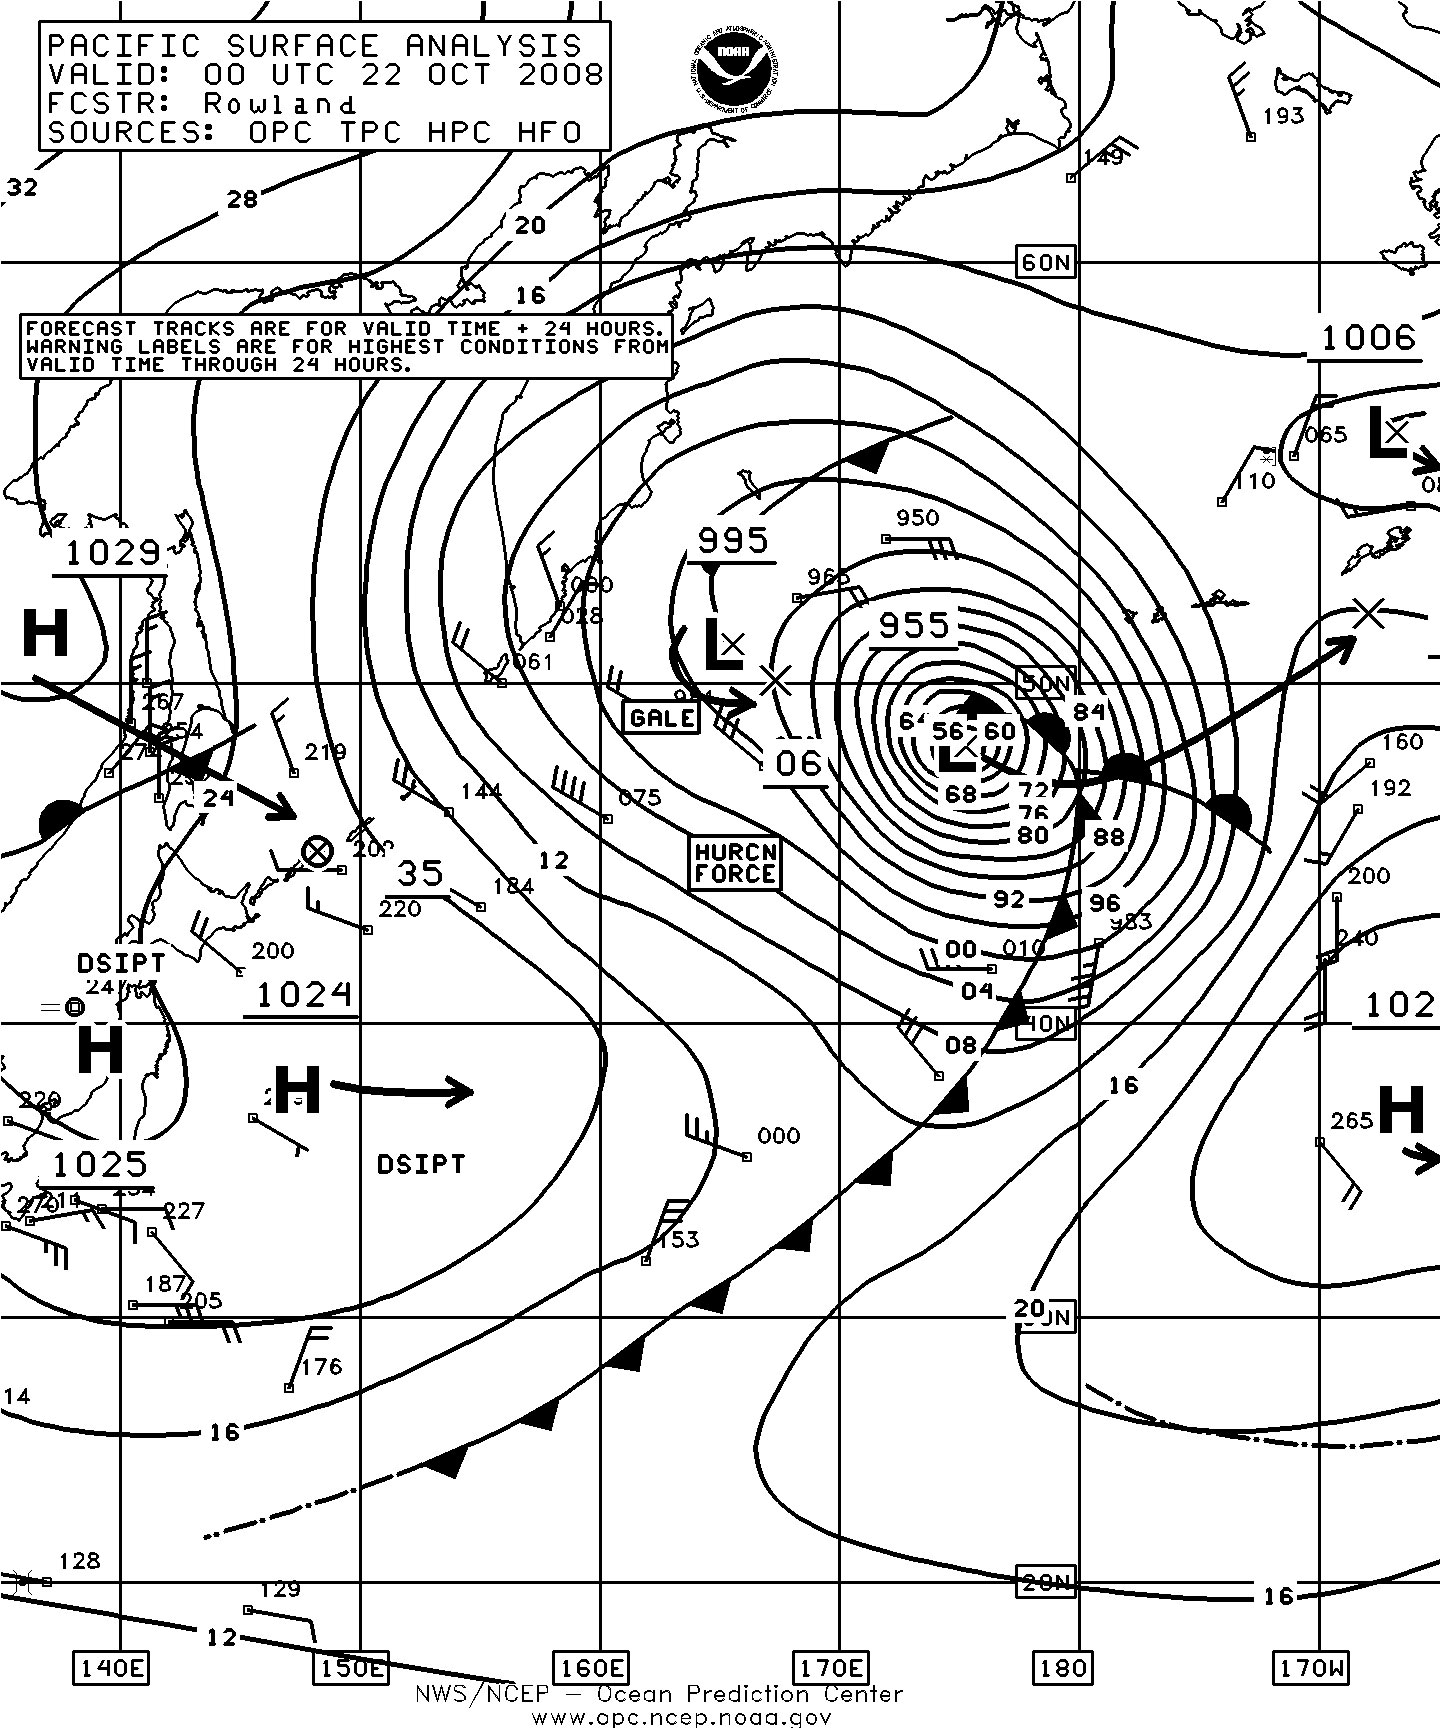
Figure 4. OPC North Pacific Surface Analysis charts (Part 2) valid 0000 UTC October 20 and 22, 2008. (Click on image to enlarge)
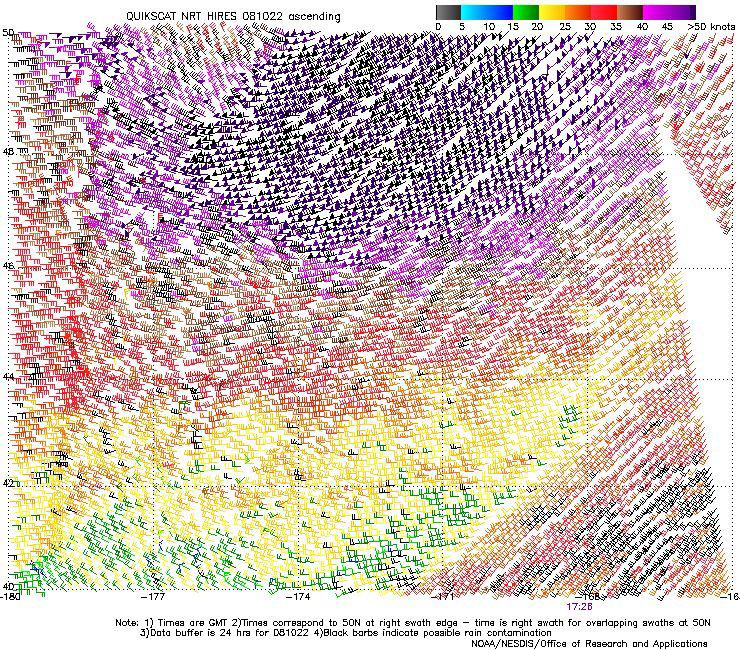
Figure 5. High resolution QuikSCAT scatterometer image of satellite-sensed winds around the south side of the storm shown in the second part of Figure 4. The valid time of the pass is 1726 UTC October 22, 2008, or about seventeen and one half hours later than the valid time of the second part of Figure 4. The center of the cyclone was near 52N 172W at this time. Image is courtesy of NOAA/NESDIS/ Office of Research and Applications.(Click on image to enlarge)
Northeastern Pacific Storm, October 27-28. Figure 6 shows the development of this cyclone, another compact low similar to the early October event. The central pressure fell 25 hPa in the twenty-four hour period covered by Figure 6. The strongest wind report from a ship is a north wind of 50 kts from WDC6644 (55N 141W at 1200 UTC on the 28th. The buoy 46084 (56.5N 136W) reported a southeast wind of 40 kts and 4.5 m seas (14 ft) at 1800 UTC on the 28th and maximum seas of 8.0 m (27 ft) at 0400 UTC on the 29th. The high resolution QuikSCAT image in Figure 7 reveals winds to 70 kts on the southwest side of the well-defined storm circulation. The cyclone then weakened over Southeast Alaska late on the 28th.
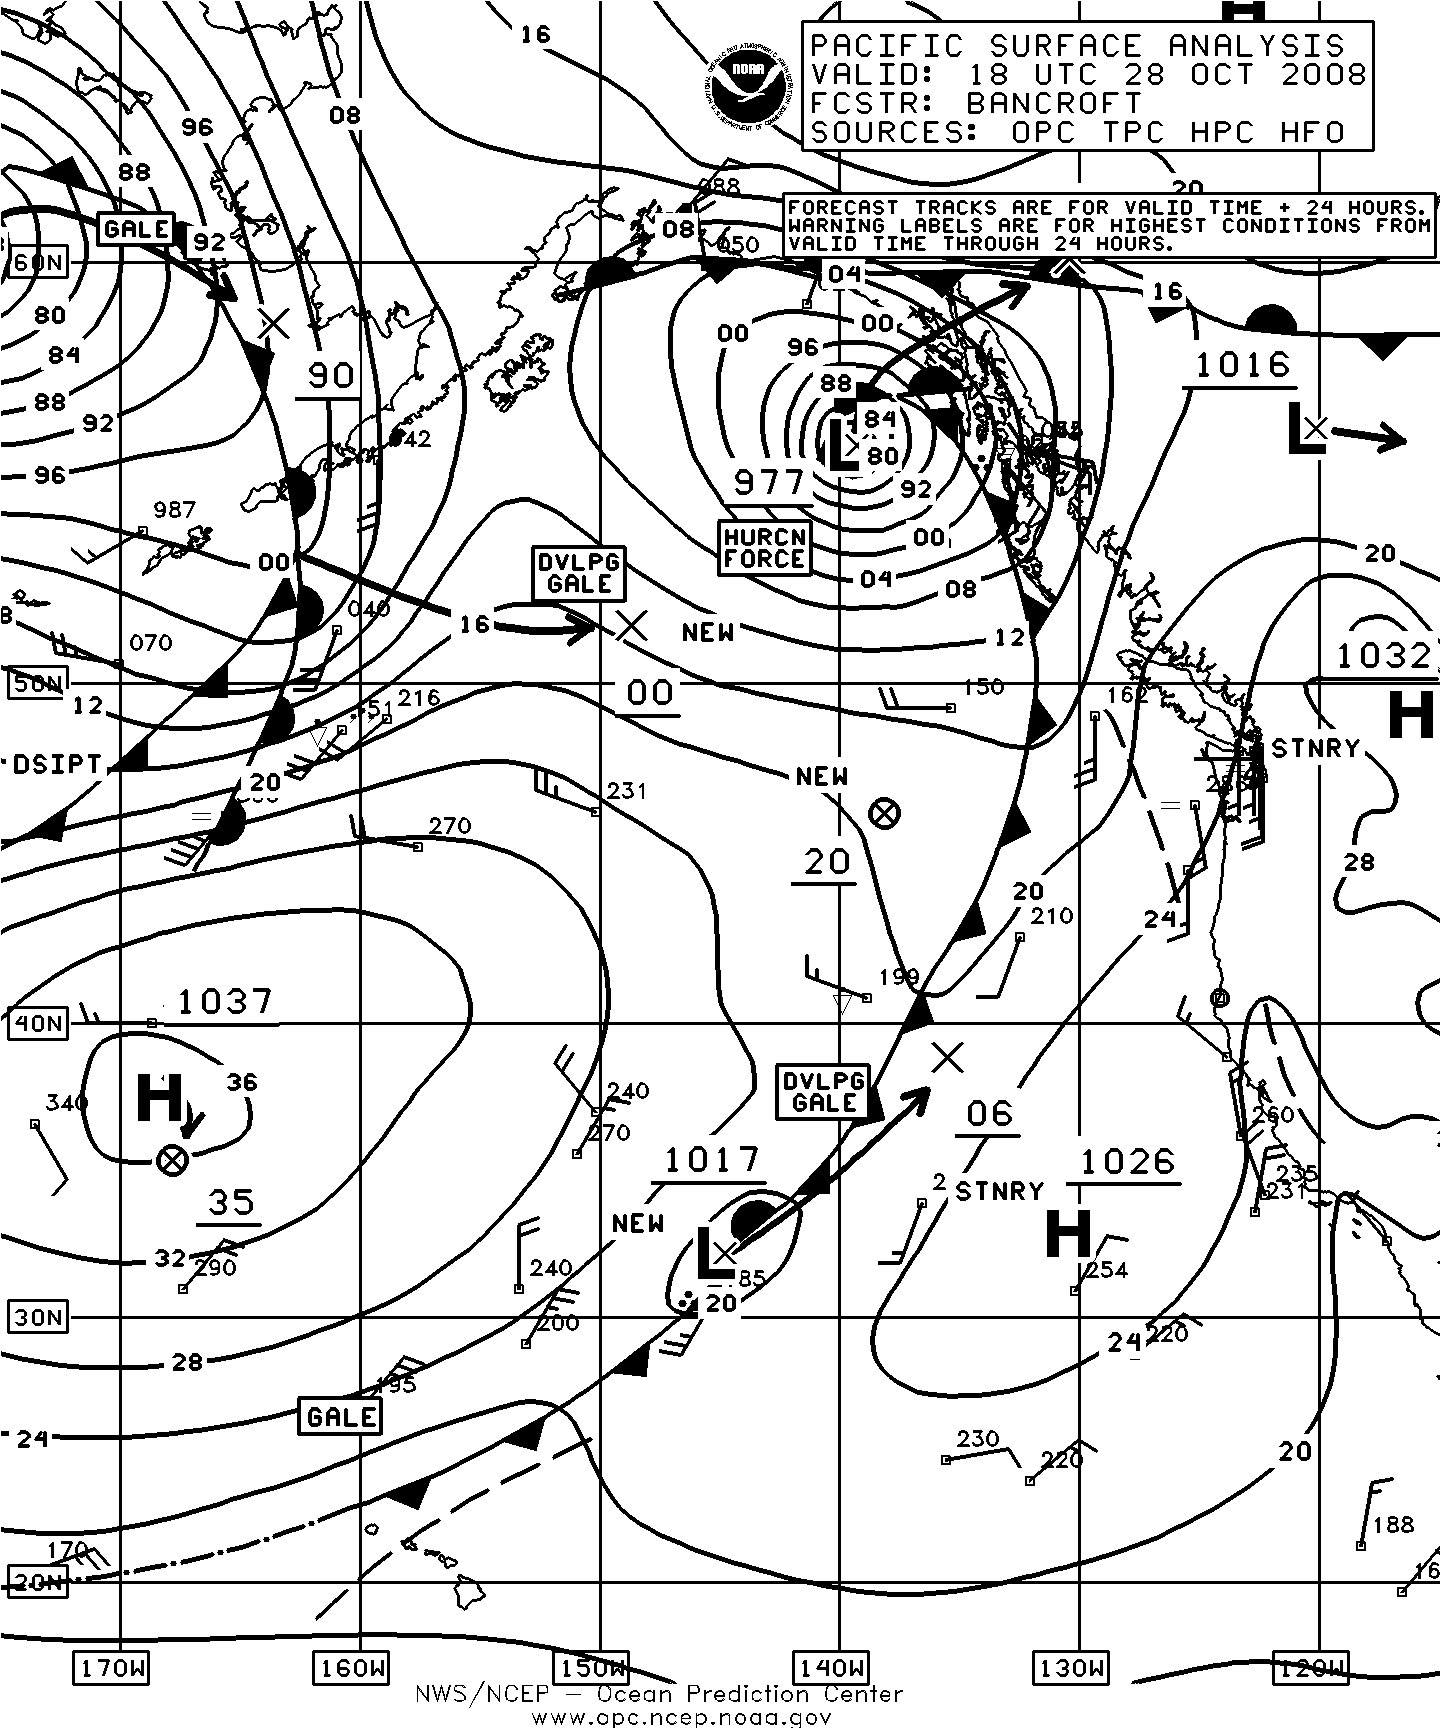
Figure 6. OPC North Pacific Surface Analysis charts (Part 1) valid 1800 UTC October 27 and 28, 2008. (Click on image to enlarge)
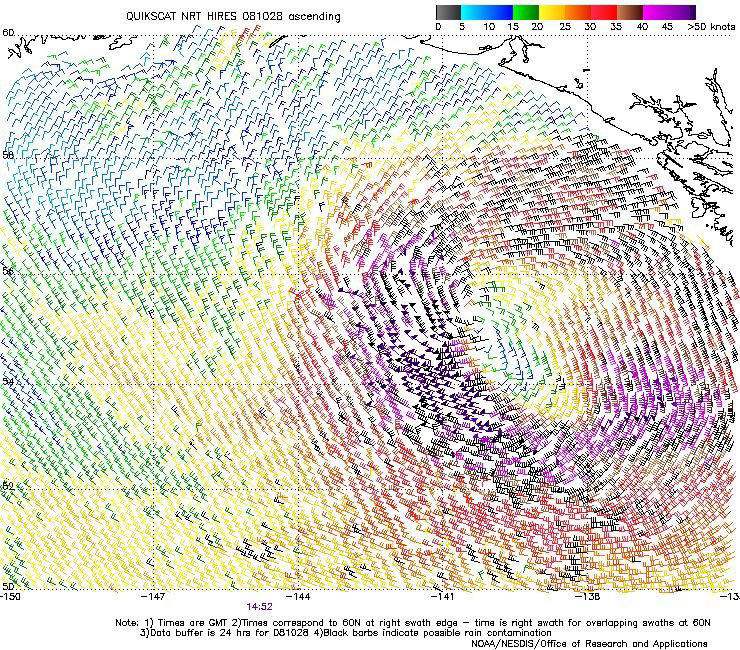
Figure 7. High resolution QuikSCAT scatterometer image of satellite-sensed winds around the storm depicted in the second part of Figure 6. The valid time of the pass is 1452 UTC October 28, 2008, or about three hours prior to the valid time of the second part of Figure 6. The center of the cyclone appears near 55N 141W near the center of the image. Image is courtesy of NOAA/NESDIS/ Office of Research and Applications.(Click on image to enlarge)
| Observation | Position | Date/Time (UTC) | Wind | Seas (m/ft) |
|---|---|---|---|---|
| WDJK | 53N 136W | 11/1200 | SE 50 | |
| WCY7052 | 51N 135W | 11/1800 | W 60 | 9.0/30 |
| C6JK | 53N 136W | 11/2000 | SE 45 | |
| Zim China (4XFQ) | 51N 131W | 12/0000 | SW 50 | 10.0/33 |
| Sea Land Enterprise | 48N 125W | 12/1100 | SE 50 | |
| KRGB | 48N 125.5W | 12/1200 | SE 55 | |
| KDBG | 44N 125W | 12/1200 | S 60 | 6.5/21 |
| Buoy 46004 | 50.9N 136.2W | 11/0900 11/1600 |
SE 40 W 50 |
4.5/14 7.5/24 |
| Buoy 46036 | 48.4N 133.8W | 11/1700 | SW 50 | 7.5/25 |
| Buoy 46005 | 46.0N 131.0W | 12/0900 | SW 35 | 8.0/26 |
| Buoy 46089 | 45.9N 125.8W | 12/1100 12/1400 |
SE 35 S 40 |
7.5/25 9.5/31 |
| Buoy 46002 | 42.6N 130.5W | 12/1100 | SW 35 | 7.5/24 |
| Buoy 46050 | 44.6N 124.5W | 12/2000 | S 35 | 10.0/32 |
| Buoy 46041 | 47.3N 124.7W | 12/1600 | S 35 | 8.5/28 |
| Buoy 46029 | 46.1N 124.5W | 12/1800 | S 35 | 9.0/29 |
| Buoy 46206 | 48.8N 126.0W | 12/1600 | SW 30 | 9.0/29 |
| Destruction Island | 47.7N 124.4W | 12/1600 | S 60 | |
| Tatoosh Island | 48.4N 124.7W | 12/1600 | S 50 |
Northeastern Pacific Storm, November 13-15:The evolution of this cyclone was similar to the late-October event, with the center developing a lowest central pressure of 981 hPa off Southeast Alaska and hurricane force winds at 1800 UTC on the 14th before weakening inland the following evening. The Zim U.S.A. (4XFO) reported a southeast wind of 55 kts and 5.5 m seas (18 ft) at 0600 UTC on the 14th. The vessel KIYI (53N 133W) encountered southeast winds of 50 kts and 8.0 m seas (27 ft) at 1200 UTC November 14. The Canadian buoy 46205 (54.2N 134.3W) reported a southeast wind of 40 kts and 7.0 m seas (23 ft) at 1400 UTC on the 14th, and maximum seas 9.0 m (30 ft) two hours later.
Northeastern Pacific Storm, November 20-21: This cyclone originated near 42N 153W as a secondary development on the front associated with a primary low to the west, on the morning of November 20. The cyclone moved to 53N 132W with a 978 hPa center twenty-four hours later, with the central pressure falling 27 hPa. The cyclone briefly developed hurricane force winds on the morning of the 21st before weakening inland six hours later. QuikSCAT imagery from early on the 21st showed a 65 kts observation east of the Queen Charlotte Islands. The Horizon Tacoma (KGTY) reported northwest winds of 45 kts and 4.5 m seas (15 ft) at 1800 UTC November 21, the highest wind reported by a ship. The buoy 46185 (52.4N 129.8W) reported southeast winds of 47 kts with gusts to 62 kts and 8.0 m seas (27 ft) at 1700 UTC on the 21st and maximum seas 10.5 m (34 ft) one hour later.
North Pacific Storm, November 22-24: A developing storm tracked from the Sea of Japan on the 20th to the Bering Sea with a 968 hPa central pressure early on the 23rd, and briefly developed hurricane force winds while near the Alaska Peninsula early on the 24th, before moving into Alaska. The ship DPAK (54N 162W) reported southwest winds of 65 kts at 0900 UTC on the 24th . The ship C6WL6 (54N 170W) reported southwest winds of 60 kts early on the 22nd. The APL Philippines (WCX8884) at 53N 167E reported west winds of 40 kts and 9.5 meter seas (31 ft) at 0000 UTC on the 22nd. Buoy 46075 (54N 160.9W) reported southwest winds of 41 kts with gusts to 52 kts and 10.0 m seas (32 ft) at 1000 UTC on the 24th and maximum seas 11 m (36 ft) two hours later. This storm was similar in intensity to the October 7-10 event in that area. The cyclone stalled on the southern Alaska coast on the 25th and 26th before dissipating on the 26th.
North Pacific Storm, November 24-28: The development of this major storm is depicted in Figure 8 which covers a two day period. This system originated over southern Japan early on the 24th. The fastest deepening of this cyclone was in the twenty-four hour period after the valid time of the first part of Figure 8. The central pressure fell 34 hPa during this period. The lowest central pressure reached was 947 hPa late on the 26th, making it the second most intense low of the period. The ship WDD6040 (43N 162W) reported southwest winds of 50 kts at 0000 UTC on the 26th, the highest wind report from a ship. The APL Thailand (WCX8882) reported 8.5 m seas (28 ft) near 38N 155W at 0600 UTC November 28. The high resolution scatterometer image in Figure 9 reveals winds to 75 kts on the south side of the cyclone which was intensifying rapidly at that time. The cyclone maintained hurricane force winds from early on the 25th until the afternoon of the 27th, more than two days. The system weakened in earnest on the 28th, becoming a gale, before moving into southern Alaska by the 30th. In Figure 8 the smaller hurricane force low appearing in the first part of the figure developed hurricane force winds at about the same time as the larger system. Partial coverage of QuikSCAT data from 1744 UTC on the 25th reveals some minimal hurricane force winds on the south side. This cyclone became absorbed by the larger storm on the 27th.
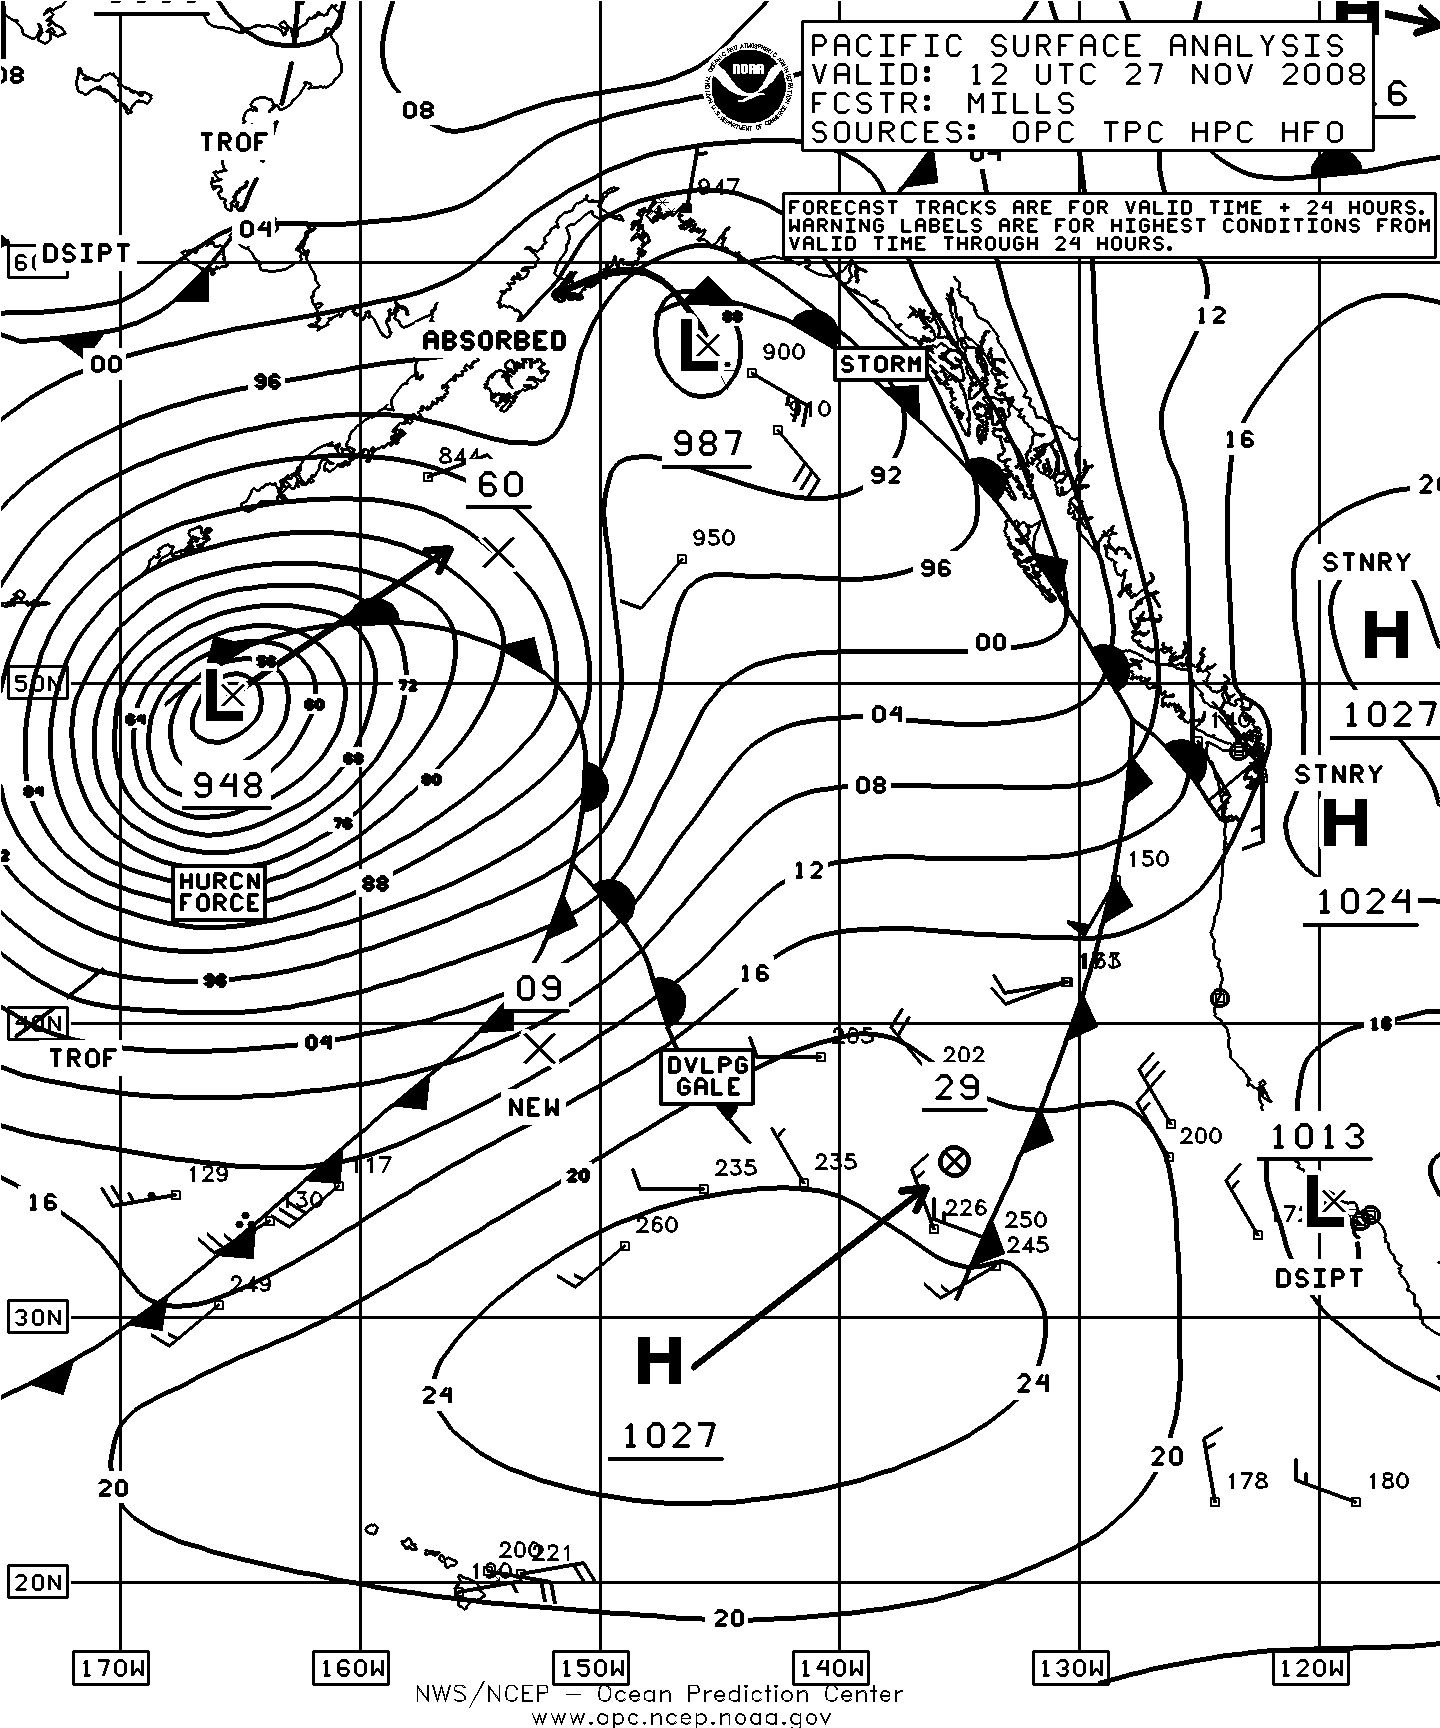
Figure 8. OPC North Pacific Surface Analysis charts valid 1200 UTC November 25 (Part 2) and 1200 UTC November 27, 2008 (Part 1). (Click on image to enlarge)
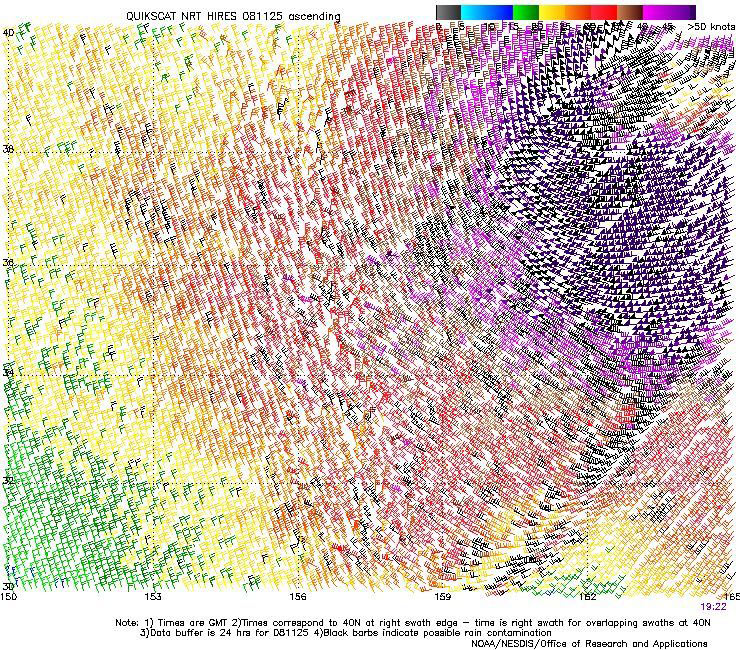
Figure 9. High resolution QuikSCAT scatterometer image of satellite-sensed winds around the south side of the storm shown in Figure 8. The valid time of the pass is 1922 UTC November 25, 2008, or about seven and one half hours later than the valid time of the first part of Figure 8. The center of the cyclone is off the upper-right corner of the image. Image is courtesy of NOAA/NESDIS/ Office of Research nd Applications.(Click on image to enlarge)
North Pacific Storm, November 27-December 2: This storm developed over a two day period as shown in Figure 10. The cyclone stalled near its position in the second part of the figure until becoming absorbed by another low passing to its southeast late on December 2. The ship VRY04 (57N 172W) reported northeast winds of 70 kts at 1200 UTC on the 1st. The ship DICB (52N 180W) reported northeast winds of 50 kts and 13.0 m seas (42 ft) at 0800 UTC on the 30th, although the author is uncertain of the accuracy of that sea height report. At 2300 UTC on November 30 Buoy 46072 (51.5N 172.1W) reported maximum seas of 10.5 m (34 ft). Figure 11 shows scatterometer winds around this storm with the hurricane force winds mainly ahead of the frontal system, where the hurricane force label was placed in Figure 10.
Southwestern North Pacific Storm, December 3-6: The development of this cutoff low is shown in Figure 12, with the cyclone intensifying at first but being forced southeast and eventually southwest by the building high pressure north of it. The small but potent circulation is depicted in the high resolution QuikSCAT data from 1820 UTC December 5 Figure 13. Hurricane force winds appear to have shifted south of 30N and observations of as high as 75 or 80 kts appear. Weakening followed on the 6th as the system drifted southwest. The ship V7DT6 (31N 177W) reported east winds of 45 kts at 0000 UTC on the 6th.
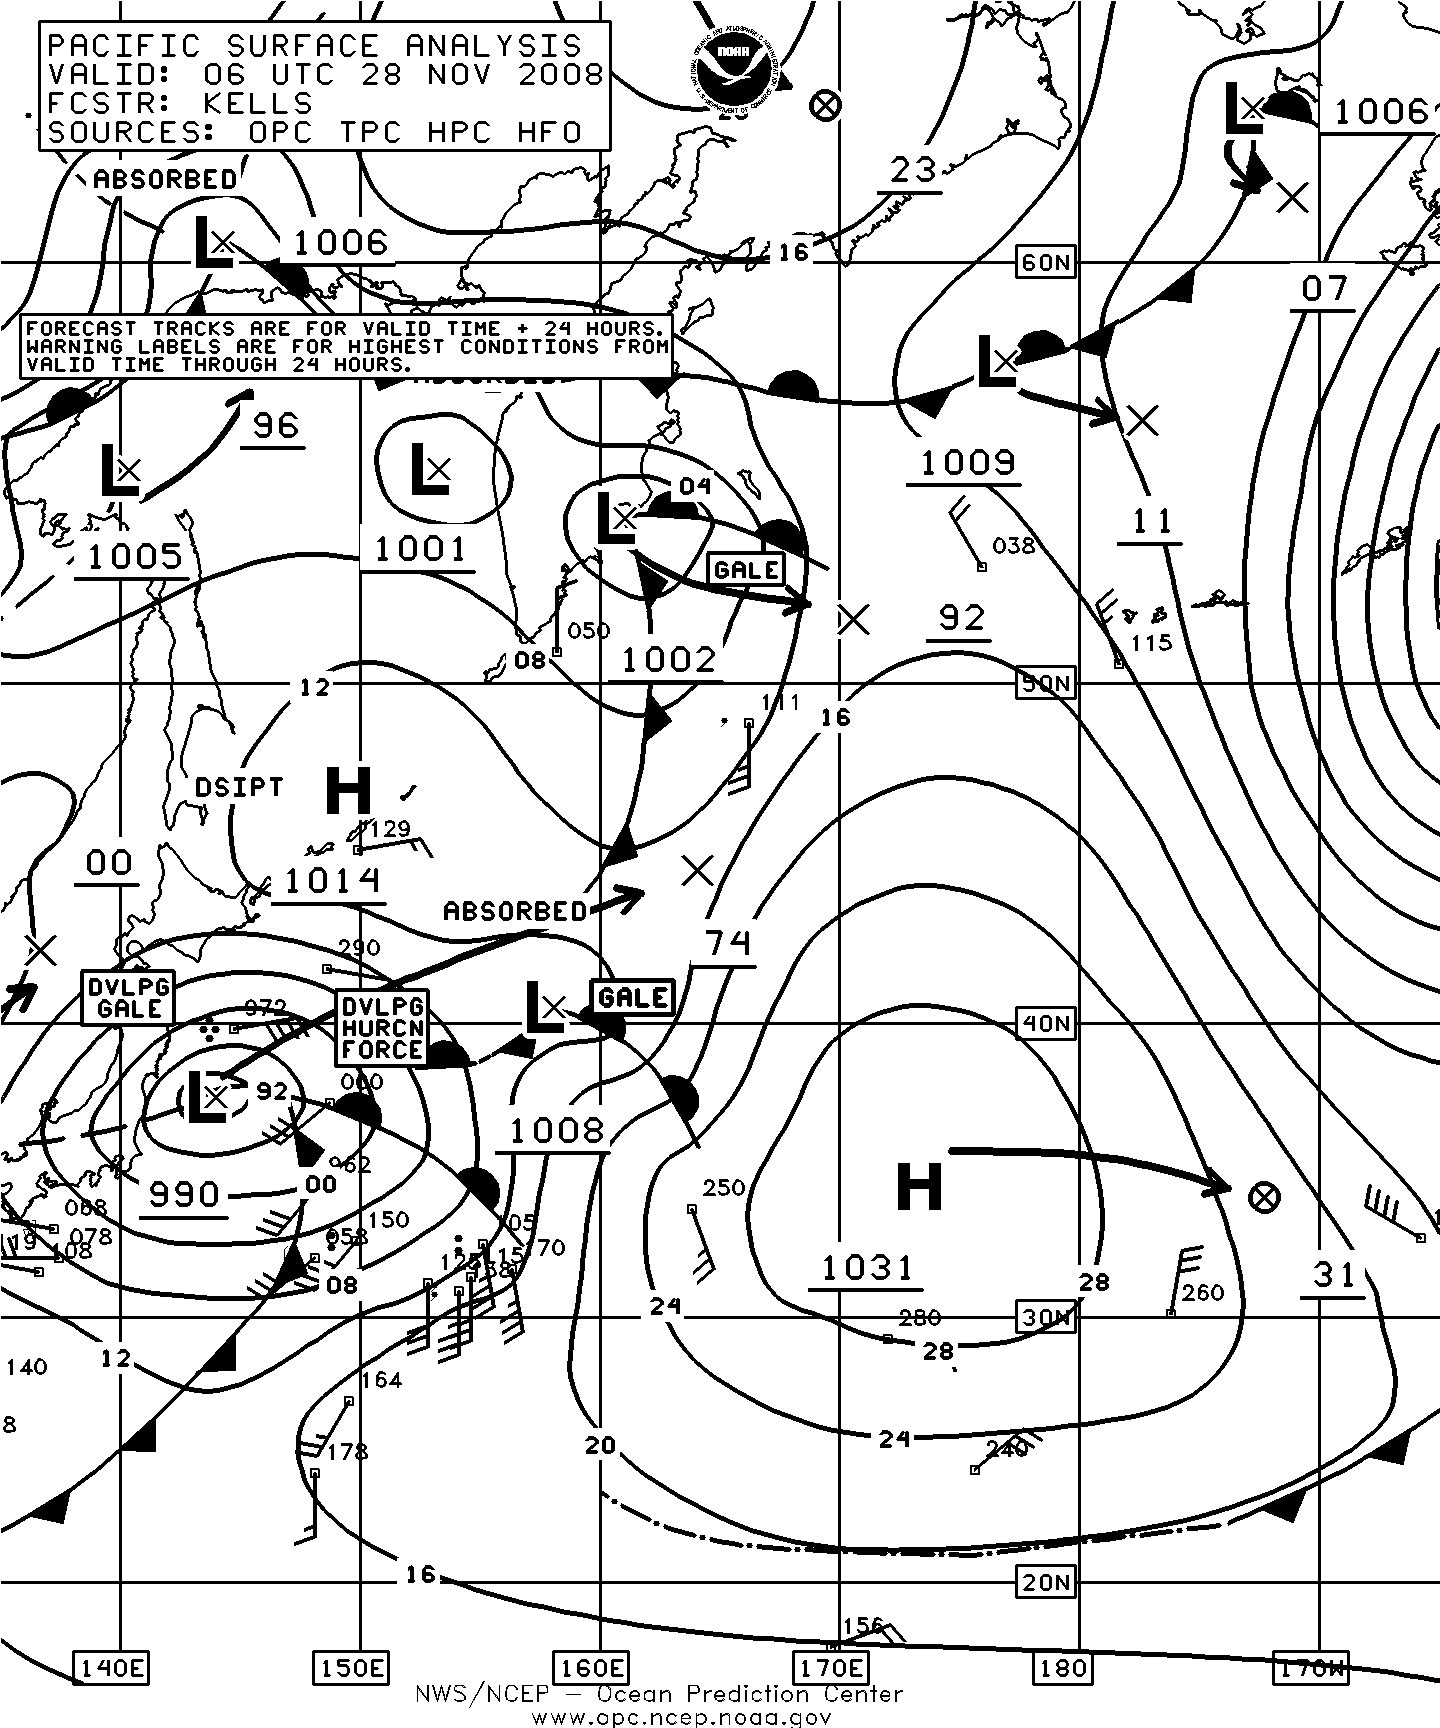
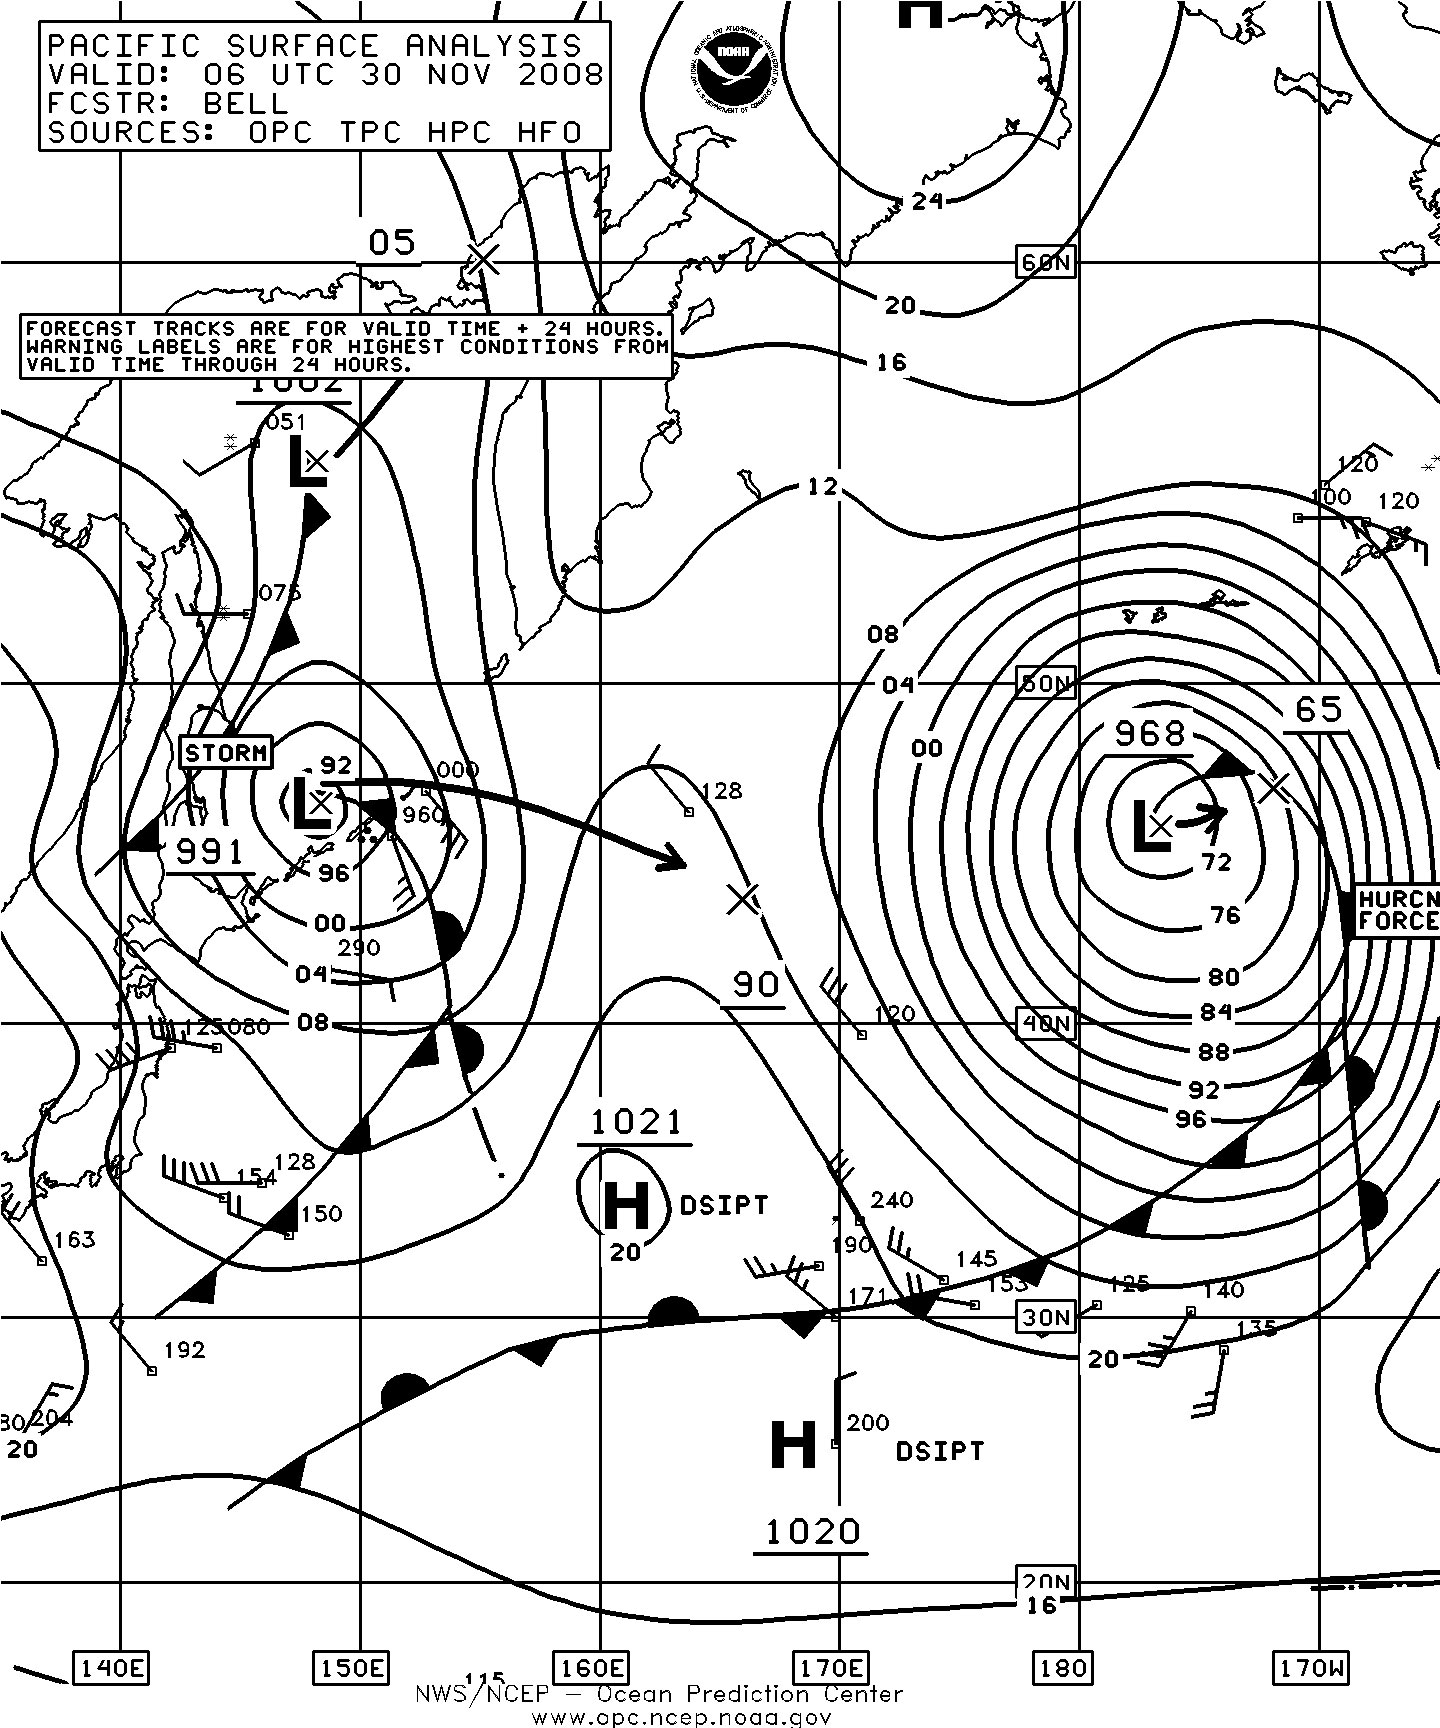
Figure 10. OPC North Pacific Surface Analysis charts (Part 2) valid 0600 UTC November 28 and 30, 2008. (Click on image to enlarge)
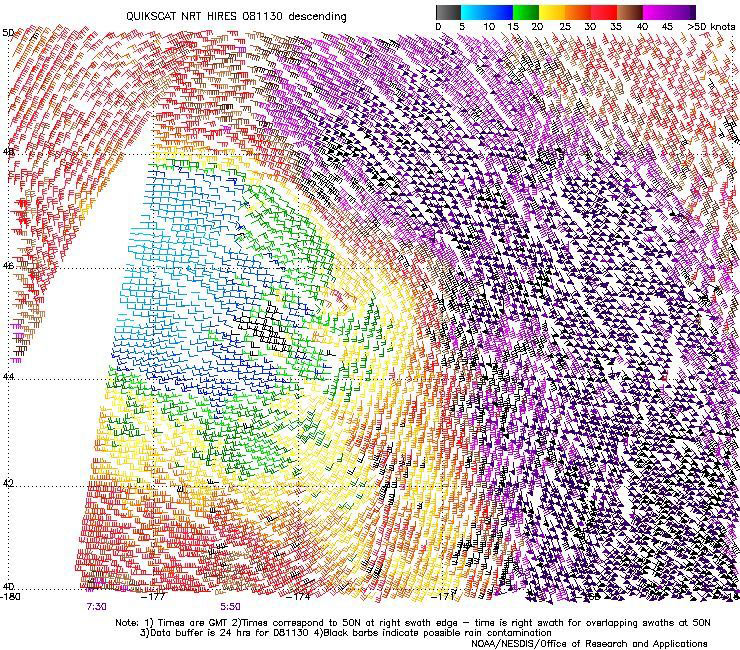
Figure 11. High resolution QuikSCAT scatterometer image of satellite-sensed winds around the storm shown in the second part of Figure 10. The valid time of the pass is 0550 UTC November 30, 2008, or approximately the valid time of the second part of Figure 10. Image is courtesy of NOAA/NESDIS/ Office of Research and Applications.(Click on image to enlarge)

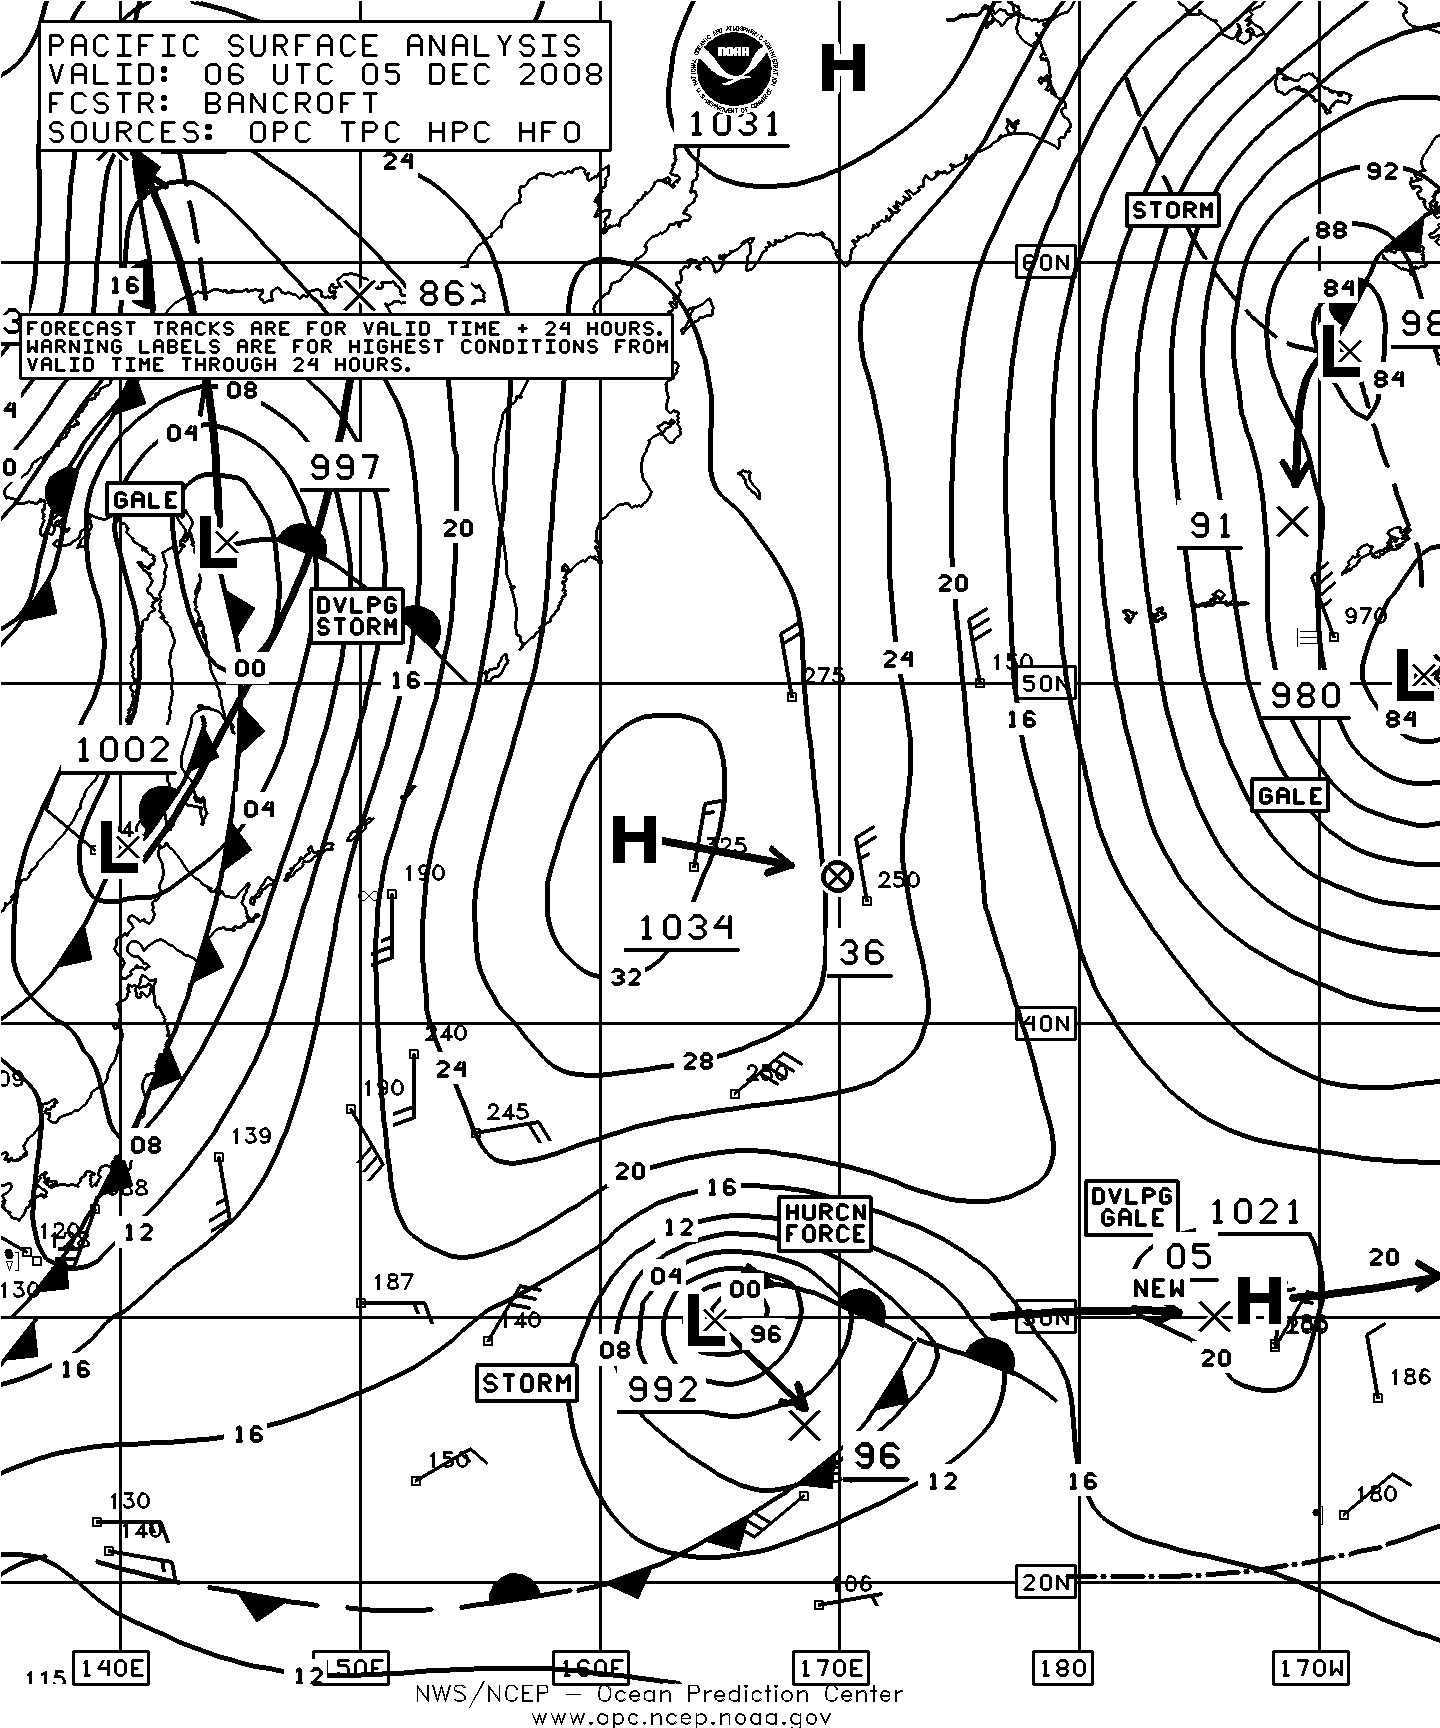
Figure 12. OPC North Pacific Surface Analysis charts (Part 2) valid 1800 UTC December 3 and 0600 UTC December 5, 2008. (Click on image to enlarge)
North Pacific Storm, December 6-9: The development of this cyclone is shown in Figure 14, with the central pressure falling 30 hPa in twenty-four hours. The system developed a lowest central pressure of 957 hPa near 52N 155W at 1800 UTC on the 8th, making it one of the deepest of the period in the North Pacific. The ship WCY7054 (57N 147W) reported east winds of 50 kts at 1800 UTC on the 8th. The same ship reported 11.5 m seas (38 ft) near 56N 144W at 1200 UTC on the 9th , the highest reported seas in this storm. The high resolution QuikSCAT image in Figure 15 reveals winds to 70 kts southwest of the well-defined center and winds approaching hurricane force on the southeast side. Please note that there are more storm-force winds on the north side of the center off the chart, with this image showing the strongest winds. The cyclone subsequently dissipated in the northern Gulf of Alaska by the 10th.

Figure 13. High resolution QuikSCAT scatterometer image of satellite-sensed winds around the storm shown in the second part of Figure 12. The valid time of the pass is 1820 UTC December 5, 2008, or about twelve hours later than the valid time of the second part of Figure 12. The center of the cyclone appears near 28N 169E in the upper-left portion of the image. Image is courtesy of NOAA/NESDIS/ Office of Research and Applications. (Click on image to enlarge)
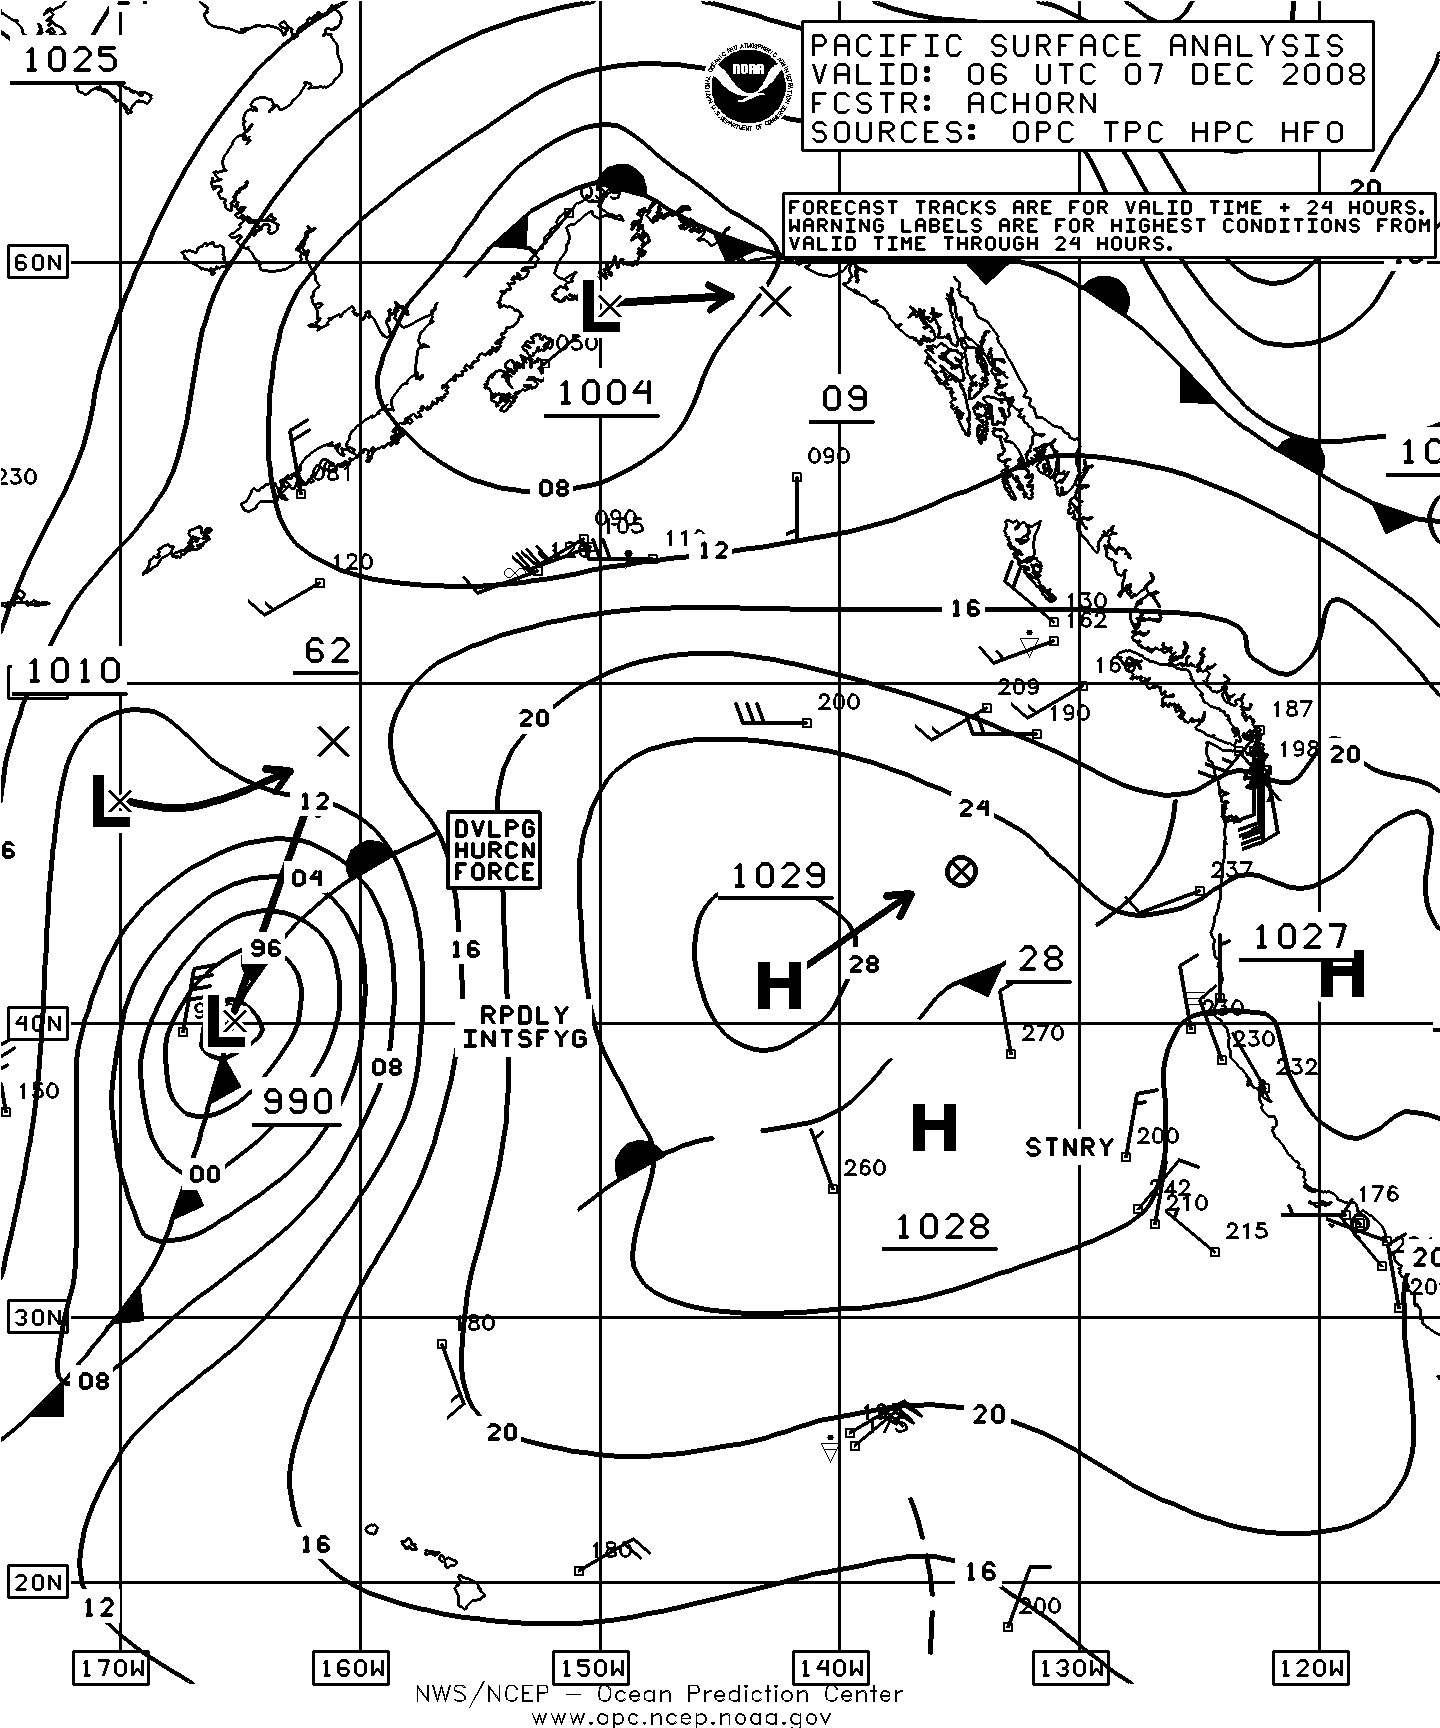
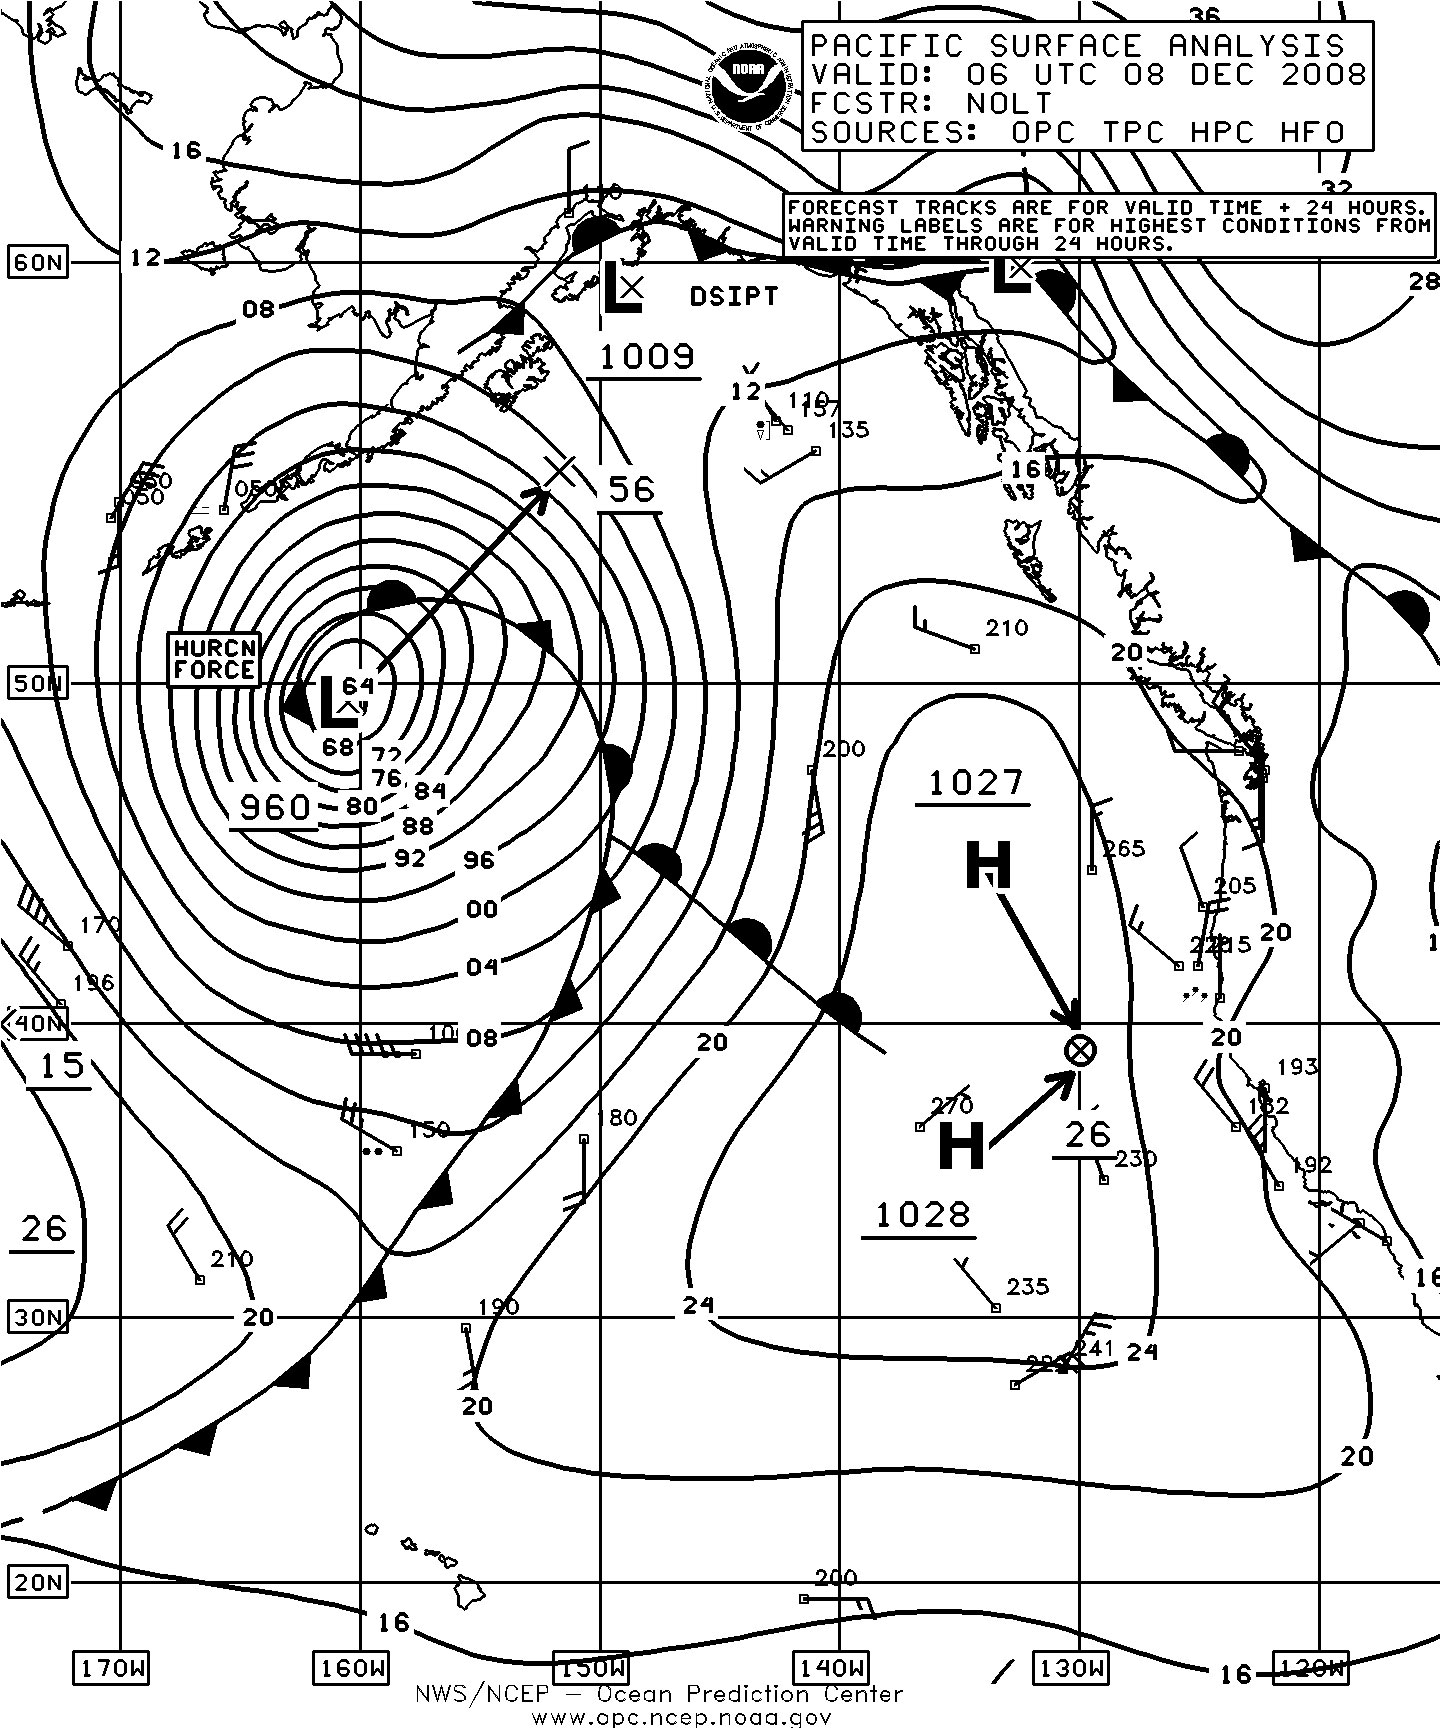
Figure 14. OPC North Pacific Surface Analysis charts (Part 1) valid 0600 UTC December 7 and 8, 2008.
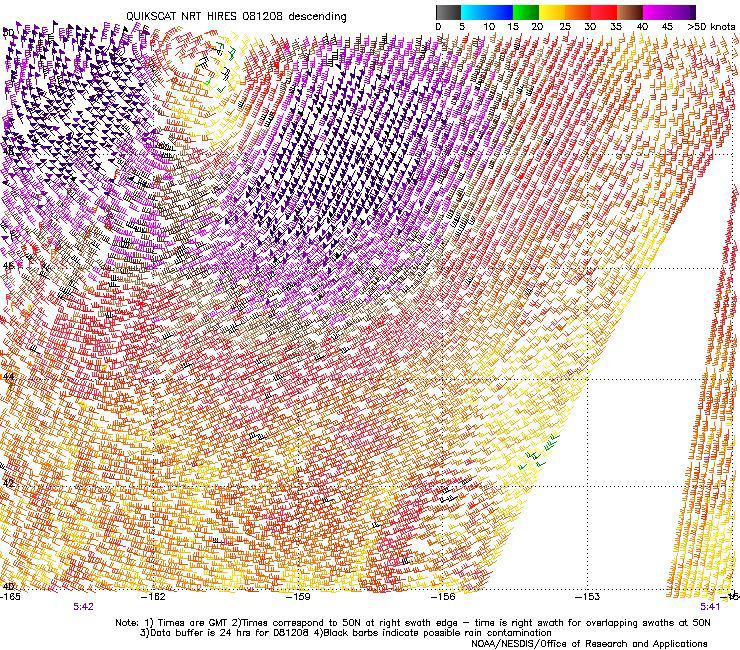
Figure 15. High resolution QuikSCAT scatterometer image of satellite-sensed winds around primarily the south, east and west sides of the storm shown in the second part of Figure 14. The valid time of the pass is 0542 UTC December 8, 2008, or approximately the valid time of the second part of Figure 14. The center of the cyclone appears near 49N 161W in the upper-left side of the image. Image is courtesy of NOAA/NESDIS/ Office of Research and Applications. (Click on image to enlarge)
North Pacific Storm, December 11-13: Figure 16 shows the development of a storm relatively far south that was temporarily trapped south of a building high to the north. The cyclone is shown near maximum strength in the second part of the figure. The QuikSCAT high resolution image in Figure 17 shows a swath of northeast winds as high as 70 kts. scat The four-month periods final significant event developed as depicted in Figure 18 from a frontal wave of low pressure at 39N 153W. The central pressure dropped 34 hPa in the twenty-four hour period ending at 1200 UTC on the 31st. The the cyclone eventually lifted north by the 13th with a decreasing trend in the winds.

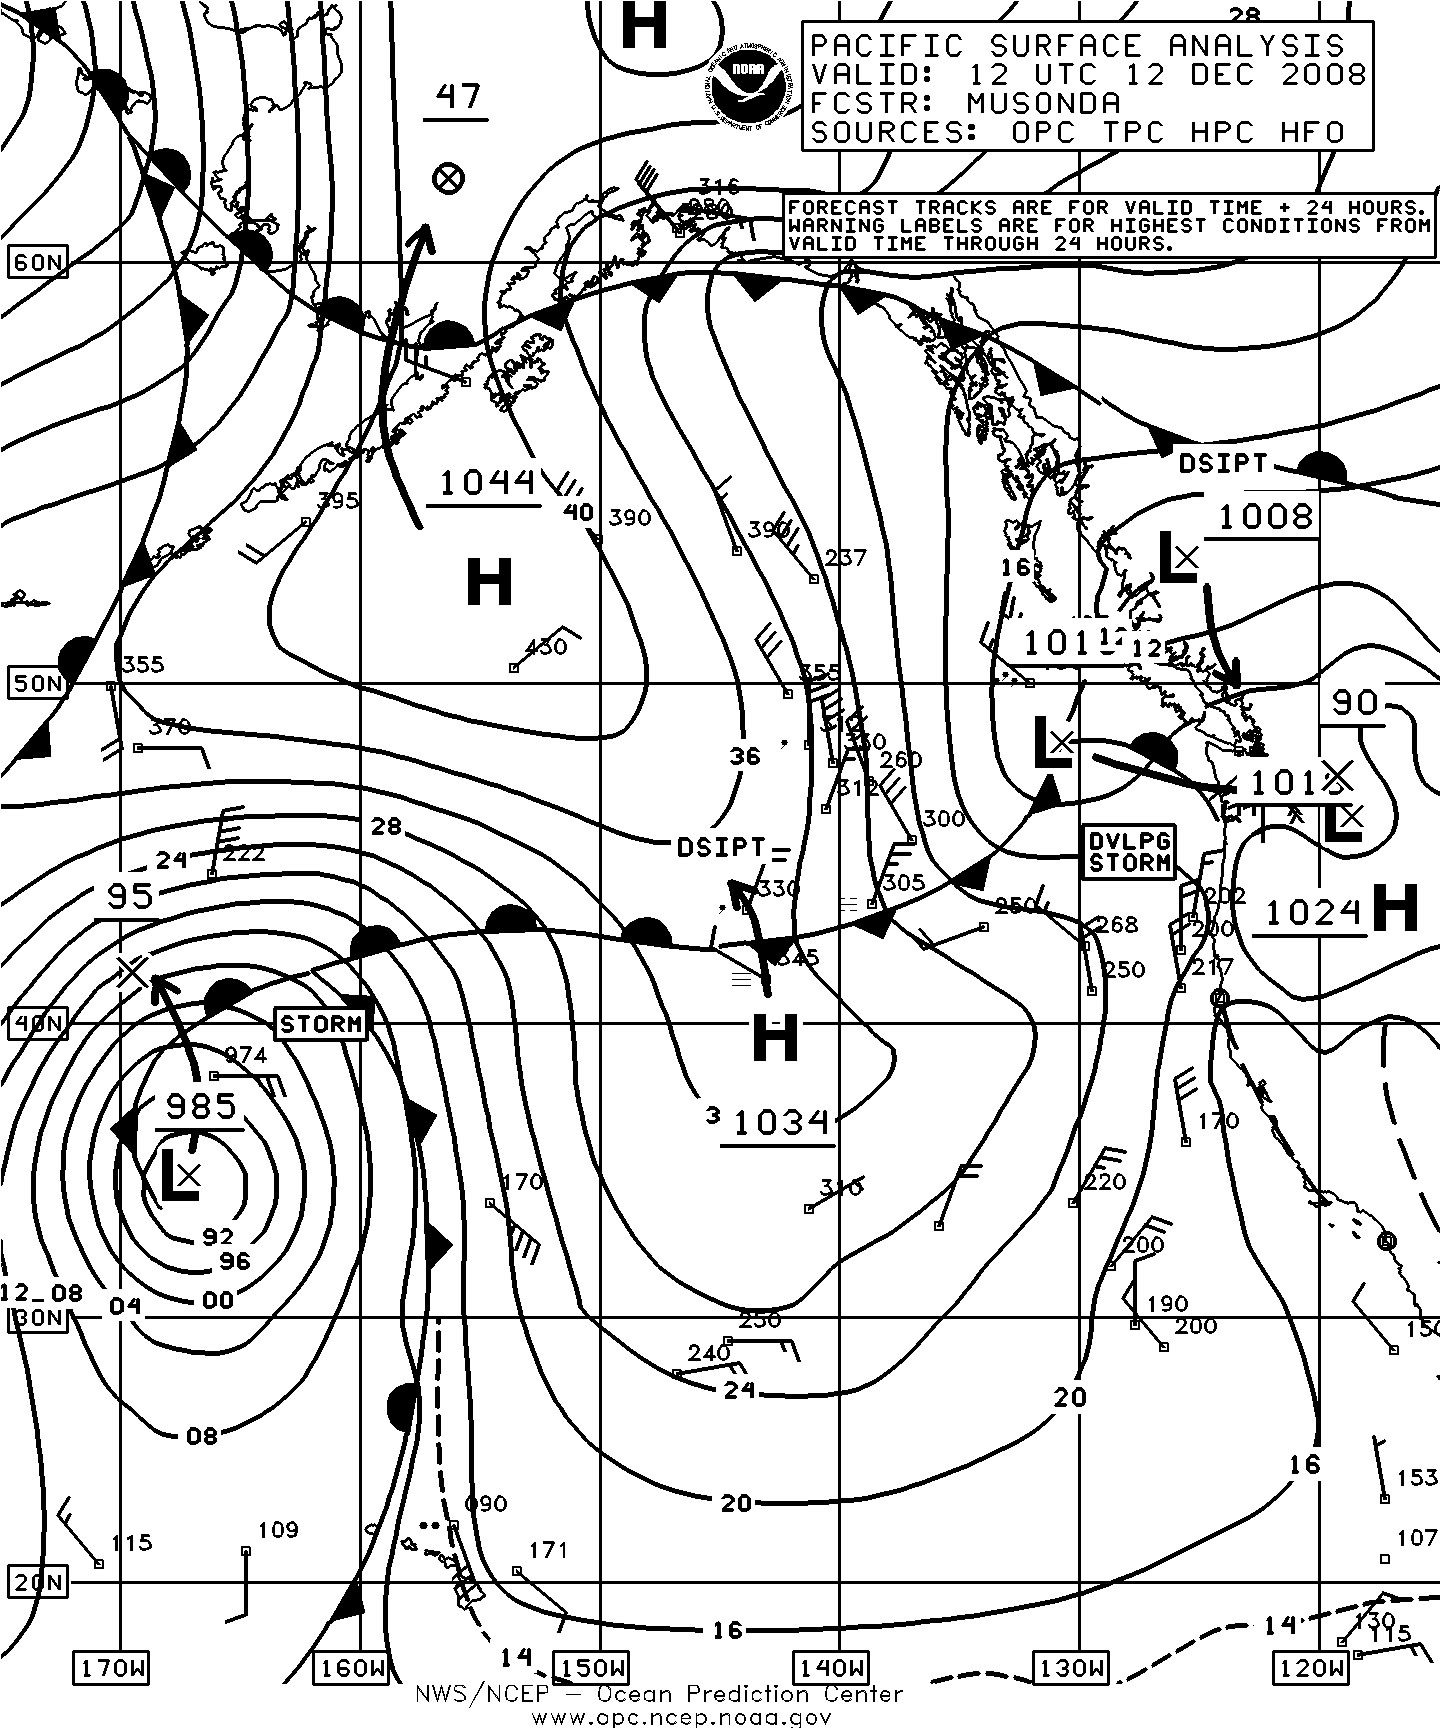
Figure 16. OPC North Pacific Surface Analysis charts (Part 1) valid 1200 UTC December 10 and 12, 2008. (Click on image to enlarge)
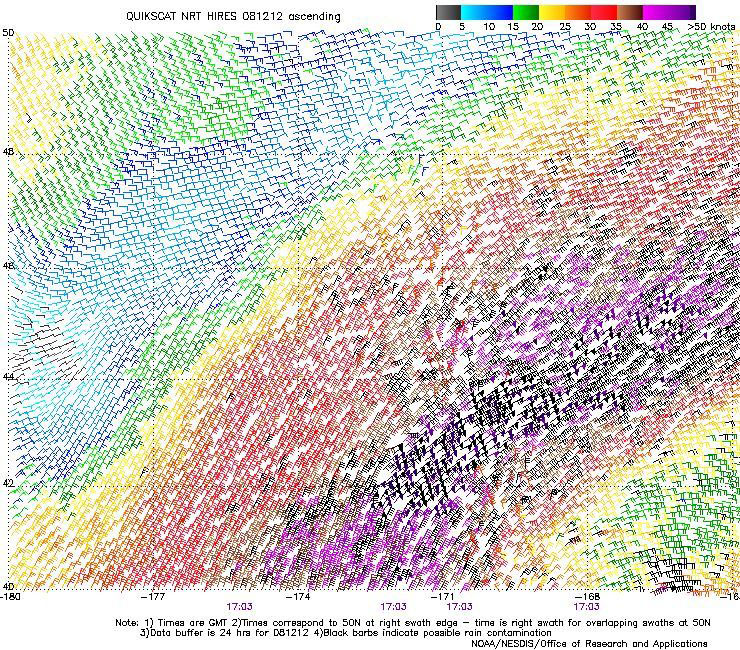
Figure 17. High resolution QuikSCAT scatterometer image of satellite-sensed winds around the northwest side of the storm shown in the second part of Figure 16. The valid time of the pass is 1703 UTC December 12, 2008, or about five hours later than the valid time of the second part of Figure 16. Image is courtesy of NOAA/NESDIS/ Office of Research and Applications. (Click on image to enlarge)
Northwest Pacific and Bering Sea Storm, December 14-16: Figure 18 displays the development of this strongest of the cyclones in that part of the North Pacific. The central pressure fell an impressive 35 hPa in the twenty-four hour period ending at 1200 UTC on the 15th. Figure 19 reveals widespread winds in the 50 to 60 kts range with some 65 kts observations in the scatterometer data. The cyclone was short-lived, moving inland over Russia early on the 16th.
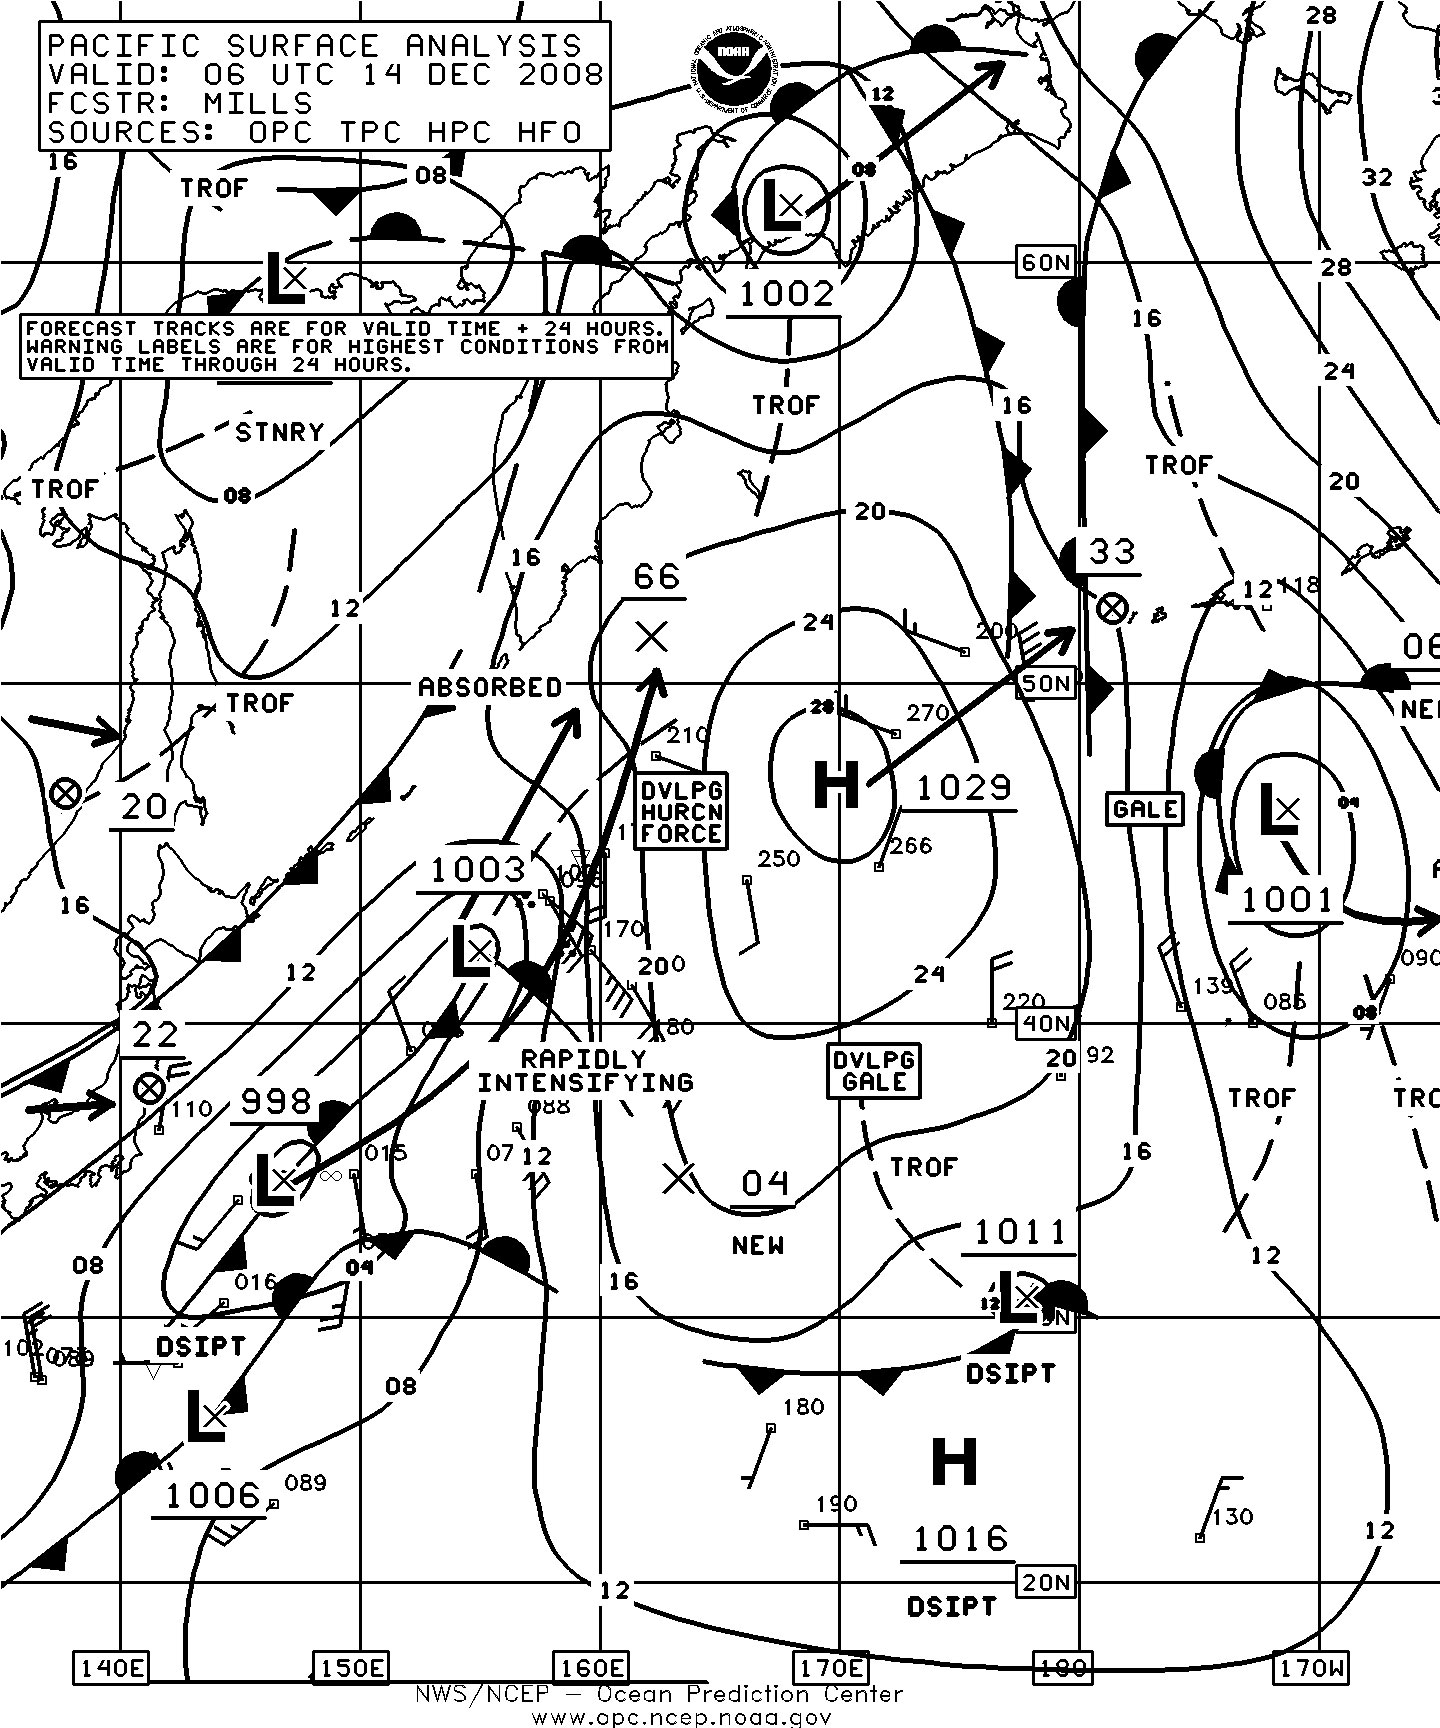
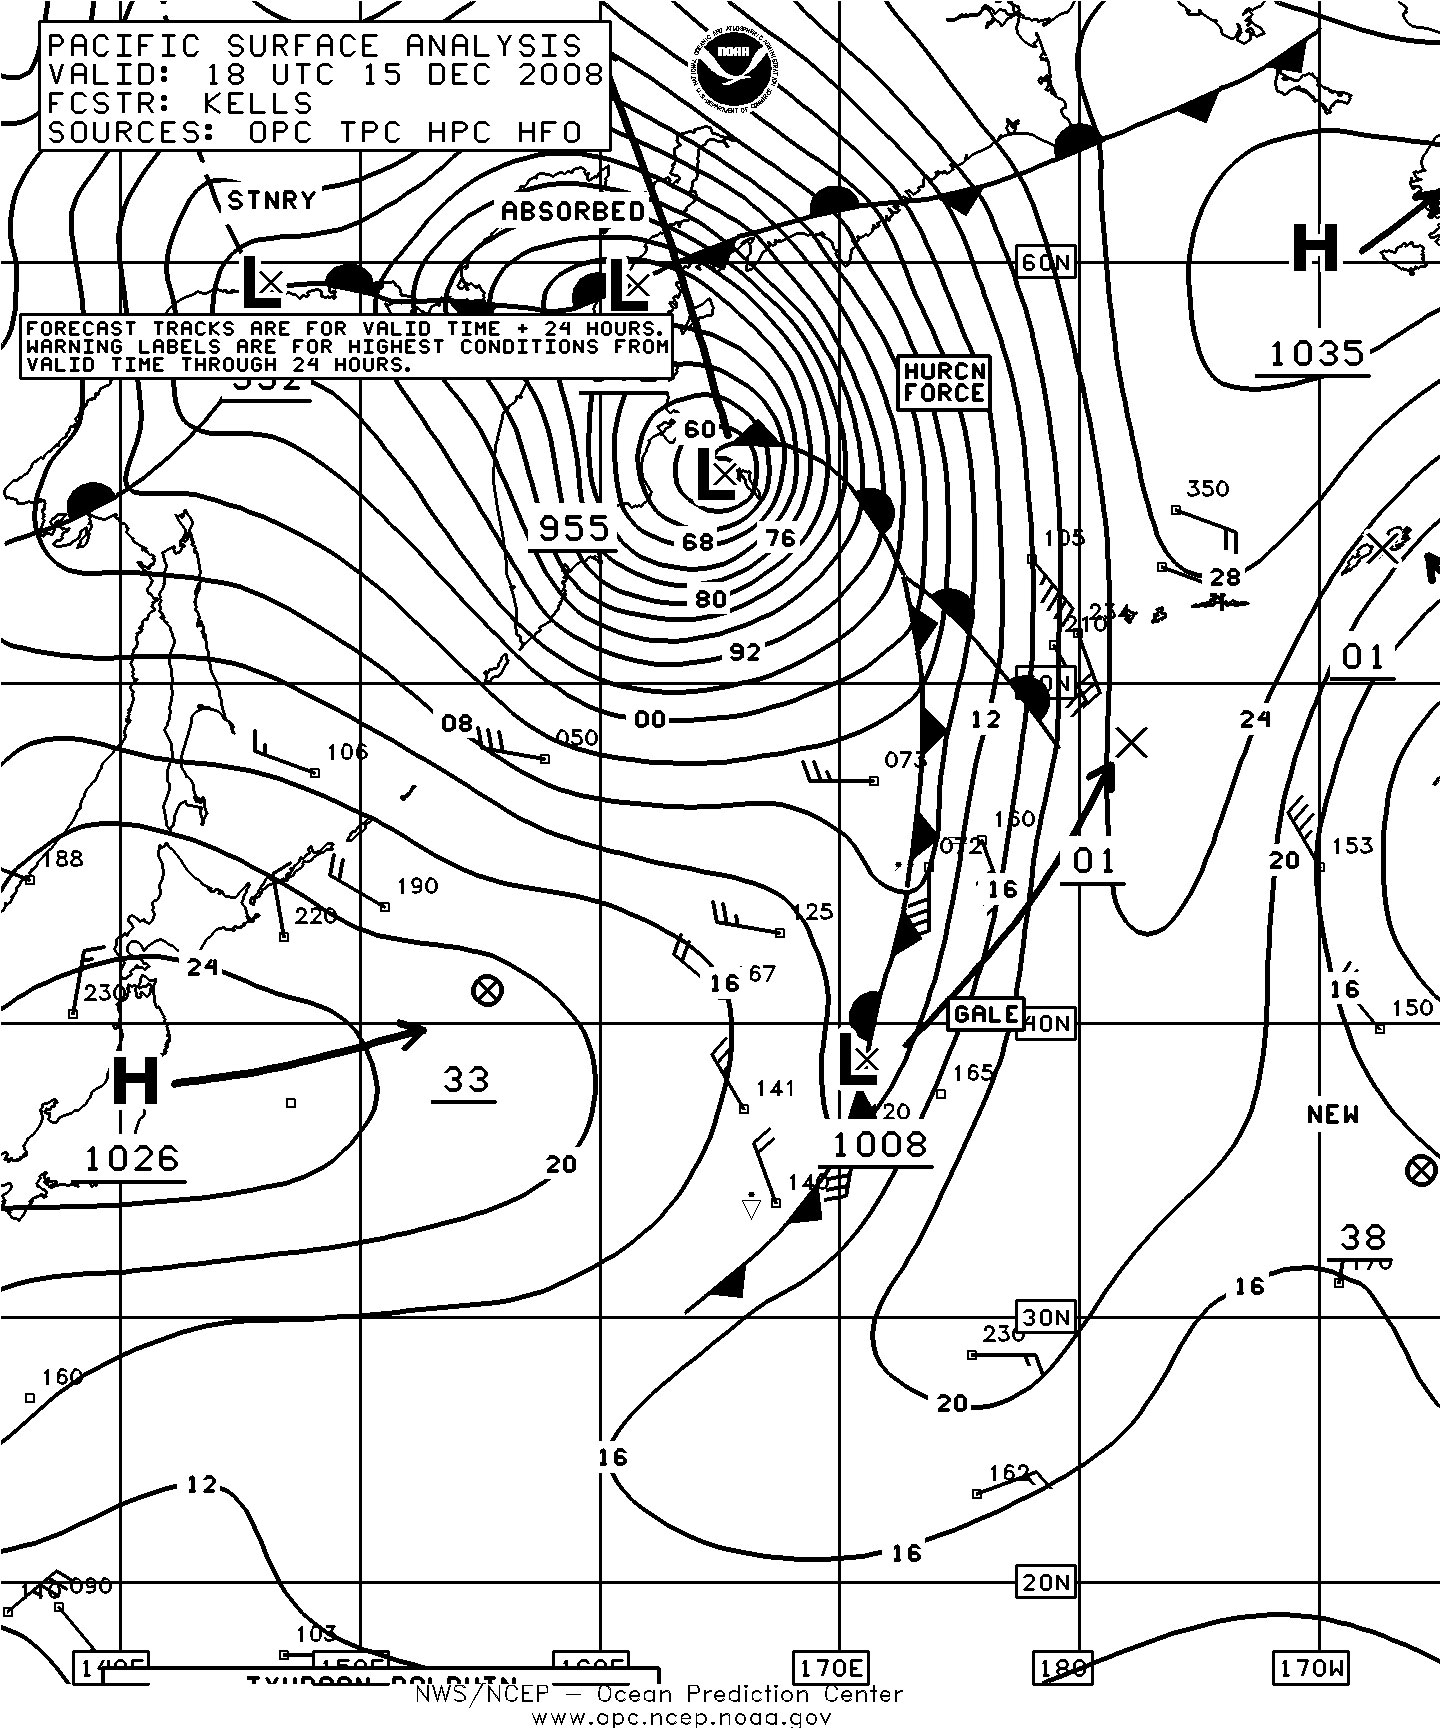
Figure 18. OPC North Pacific Surface Analysis charts (Part 2) valid 0600 UTC December 14 and 1800 UTC December 15, 2008. (Click on image to enlarge)
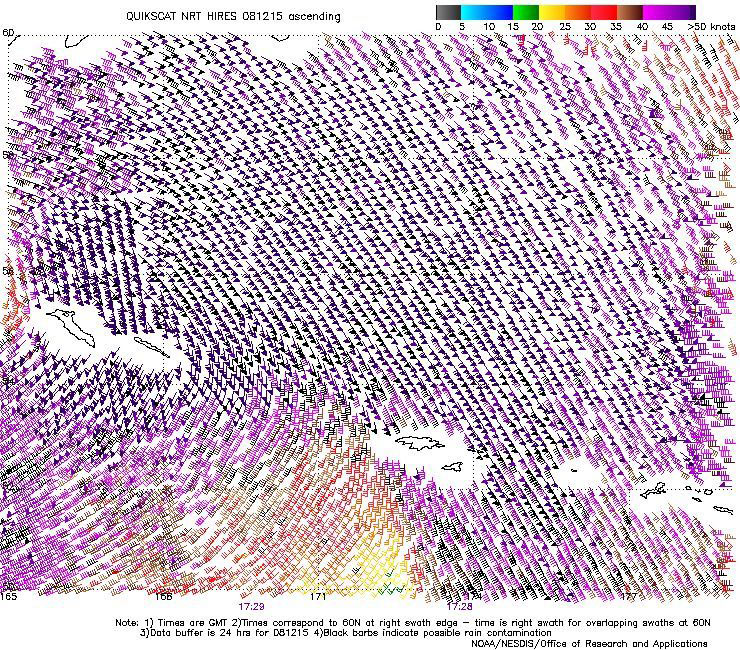
Figure 19. QuikScat scatterometer image of satellite-sensed winds around the storm shown in the second part of Figure 18. The valid time of the pass is 1729 UTC December 15, 2008, or about one half hour prior to the valid time of the second part of Figure 18. The western Aleutian Islands appear in the lower right portion of the image. Image is courtesy of NOAA/NESDIS/ Office of Research and Applications.(Click on image to enlarge)
Back to top