Marine Weather Review—North Atlantic Area
September through December 2006
By George P. Bancroft, NOAA National Center for Environmental Prediction
Introduction
The dominant storm track during the September to December period was from southwest to northeast, taking the cyclonic systems toward the area between Greenland and the northern British Isles. Occasionally high pressure over the North Atlantic or near Great Britain turned the low-pressure areas northward toward Greenland or the Davis Strait, with the lows reforming on the east side of Greenland before moving east. Among lows with no tropical origins, the number of hurricane-force storms increased later in the period. September produced one hurricane-force low while December had seven. From late November through December five lows developed central pressures below 950 hPa.
Tropical cyclone activity was concentrated in September, when tropical cyclones Ernesto, Florence, Gordon, Helene and Isaac affected OPC’s area north of 31N. All except Ernesto were hurricanes that came north into OPC’s waters from south of 31N with two of these, Florence and Helene, becoming intense lows after becoming extratropical. Tropical activity shut down after the departure of Isaac early in October, attributed to the development of El Nino warming of the eastern Pacific.
Tropical Activity
Tropical Storm Ernesto: Ernesto moved inland over North Carolina at 0600 UTC September 1 with maximum sustained winds of 60 kts with gusts to 75 kts. Although Ernesto weakened while moving over the mid-Atlantic states, strong high pressure to the northeast helped maintain strong winds off the mid-Atlantic coast through the 2nd. At 1200 UTC September 1, the ship British Trader (ZIPR7) (36N 73W) reported southeast winds of 50 kts and 5.0 m seas (17 ft). Chesapeake (CHLV2) C/MAN (36.9N 75.6) reported southeast winds of 39 kts and peak gusts of 56 kts at 1800 UTC September 1. Ambrose (ALSN6 at 40.5N 73.7W) reported east winds of 46 kts with gusts to 53 kts at 1900 UTC September 2. Buoy 44009 (38.5N 74.7W) reported northeast winds of 39 kts with gusts to 49 kts and 6.0 m seas (20 ft) at 0000 UTC on the 2nd, with a peak gust of 54 kts occurring one hour earlier, and highest seas 7.0 m (23 ft) five hours later. Ernesto became extratropical over Virginia at 0000 UTC on the 2nd, weakened, and moved to the Canadian Maritimes as a gale on September 4, before continuing on a northeastward track past Iceland by the 8th.
Hurricane Florence: Florence entered OPC’s marine area southwest of Bermuda early on September 11 with maximum sustained winds of 70 kt with gusts to 85 kts, then strengthened with winds of 80 kts and gusts to 100 kts while passing near Bermuda that morning. The Bermuda airport reported a southwest wind of 57 kts with gusts to 78 kts at 1555 UTC September 11. Florence then began to weaken, becoming a minimal hurricane the next day before becoming extratropical at 0000 UTC September 13. Figure 1 shows Florence six hours before becoming extratropical in the first part, and as a powerful extratropical cyclone in the second part. The cyclone passed near several Canadian buoys and Grand Banks platforms, with selected observations listed in Table 1. A satellite image taken as Florence was becoming extratropical (Figure 2) reveals a diminished central dense cloud mass characteristic of tropical cyclones, and clouds developing frontal characteristics including a developing cold front to the south. Extratropical Florence is shown at maximum intensity with a 963 hPa central pressure in the second part of Figure 1. The storm then moved northeast and began to weaken, maintaining hurricane-force winds for another twelve hours, before weakening to a gale in the central Atlantic late on the 14th. The remains of Florence then turned north and looped south of Iceland on the 18th, and merged with a stronger low to the south on September 19.
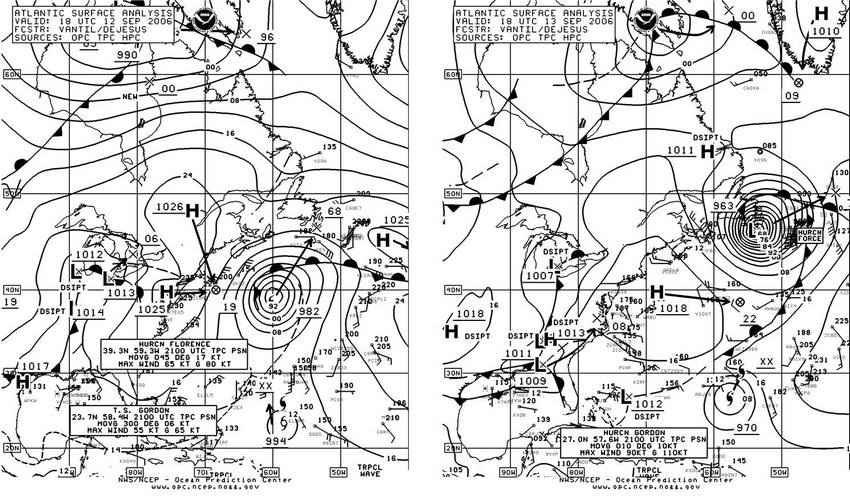
Figure 1. OPC North Atlantic Surface Analysis charts (Part 2 - west) valid 1800 UTC September 12 and 13, 2006, showing Hurricane Florence becoming a powerful extratropical storm.
| OBSERVATION | POSITION | DATE/TIME(UTC) | WIND | SEAS(m/ft) |
|---|---|---|---|---|
| Buoy 44137 | 42.3N 61.7W | 12/1900 | NE 35 | 6.5/21 |
| 14/1900 | peak gust 51 | |||
| Buoy 44141 | 43N 58W | 13/0600 | N 51 | |
| Buoy 44138 | 44.3N 53.6W | 13/1000 | S 45 | 9.0/30 |
| 13/1100 | maximum 10.0/32 | |||
| Buoy 44251 | 46.4N 53.4W | 13/1000 | NE 37 | |
| 13/1900 | sea level pressure 965.5 mb | |||
| Buoy 44139 | 44.2N 57.1W | 13/1100 | NW 51 | |
| Platform VEP717 | 46.7N 48.7W | 14/0000 | SW 73 | |
| Hibernia Platform HP6038 | 46.4N 48.4W | 14/0300 | SW 55 | |
| WCZ6545 | 46.5N 48.2W | 14/0300 | SW 55 |
Table 1. Ship, buoy and platform observations taken during passage of Hurricane Florence or its subsequent intense extratropical low.
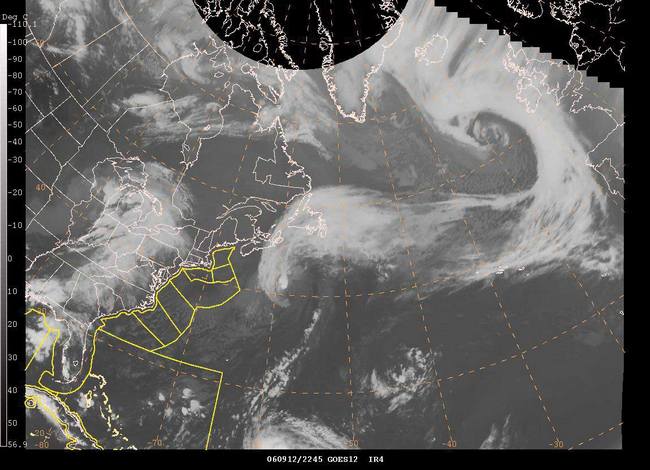
Figure 2. GOES12 infrared satellite image showing Florence in transition to an extratropical cyclone. Temperature is displayed on a scale from warm (black) to cold (white) in this type of imagery.
Hurricane Gordon: Gordon is shown intensifying south of 31N in Figure 1. After becoming a major hurricane on the 14th, Gordon crossed 31N near 53W on the morning of September 15 with maximum sustained winds of 85 kts with gusts to 105 kts, a category 2 hurricane on the Saffir-Simpson scale of intensity (See Reference 1 at the end). After stalling and weakening to a minimal hurricane late on the 16th, Gordon accelerated into the westerlies and re-intensified, developing maximum sustained winds of 90 kts with gusts to 110 kts at 0900 UTC September 19 when the center was near 38N 39W. The center passed near a drifting buoy (44773) at that time and the dramatic pressure changes at that buoy are plotted in Figure 3. The lowest hourly pressure at the buoy was 978.4 hPa at 0900 UTC on the 19th versus a central pressure of 970 hPa in the 0900 UTC National Hurricane Center advisory. Gordon then began to weaken before crossing the Azores as a minimal hurricane early on the 20th. Santa Maria Airport in the southeastern Azores reported southwest winds of 49 kts with gusts to 71 kts at 0800 UTC September 20. The ship Spring Panda (PHQX) (36N 21W) reported west winds 40 kts and 6.0 m seas (19 ft) at 1800 UTC September 20, with Gordon weakening to a tropical storm by that time. Gordon then became extratropical near 40N 13W shortly thereafter before turning north. The ship CSAV Rio Baker (V7DR6) (41N 11W) encountered south winds of 55 kts at 0000 UTC on the 21st. The vessel British Vine (MDGV9) (47N 8W) reported north winds of 62 kts at 1200 UTC on the 21st, and three hours later the ship Canmar Fortune (ZCBD3) encountered south winds of 45 kts and 9.0 m seas (29 ft) near 49N 5W. The remains of Gordon then became wrapped up into a large gale just west of the British Isles late on September 22.
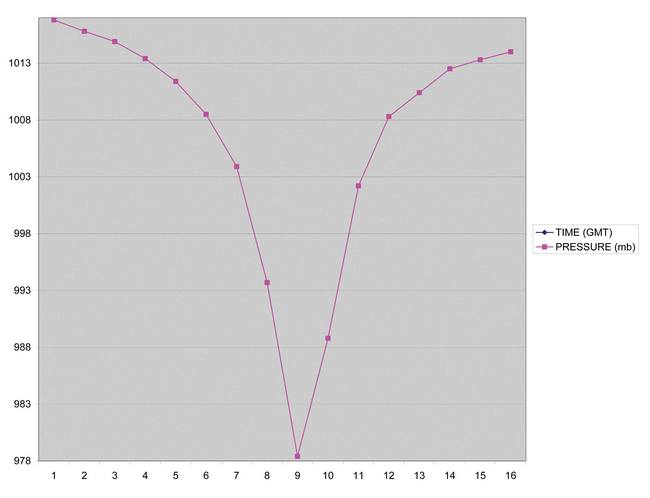
Figure 3. A graph of surface pressure versus time observed at the drifting buoy 44773 (38.16N 39.25W) during passage of Hurricane Gordon on September 19, 2006. The vertical axis is in units of pressure (whole millibars) and the horizontal axis shows units of time (hours) after 0000 UTC September 19.
Hurricane Helene: Helene moved north into OPC’s waters just west of where Gordon passed, near 56W, late on September 21 with maximum sustained winds of 75 kts with gusts to 90 kts. Helene then weakened to a strong tropical storm while tracking northeast to 36N 51W by 0300 UTC on the 23rd, before re-intensifying to a hurricane twelve hours later with maximum sustained winds of 80 kts with gusts to 100 kts. The ship London Senator (DEDM) near 34N 47W reported southwest winds of 50 kts as Tropical Storm Helene passed to the northwest at 0600 UTC on the 23rd. Helene then weakened to a tropical storm near 41N 38W at 1500 UTC on the 24th before becoming extratropical, and re-intensifying into a hurricane-force extratropical low with a central pressure down to 964 hPa near 43N 34W at 0000 UTC September 25, similar to extratropical Florence in Figure 1. The cyclone then began to weaken while moving northeast, becoming a gale near 47N 23W thirty-six hours later, before dissipating near Iceland early on the 29th.
Hurricane Isaac: Isaac was the last tropical cyclone of the 2006 Atlantic hurricane season. After crossing 31N near 58W as a minimal hurricane with maximum sustained winds of 65 kts by the afternoon of September 30, Isaac followed a track closer to that of Florence and developed a maximum intensity of 75 kts with gusts to 90 kts while passing near 33N 60W at 0900 UTC October 1, before accelerating northeast and weakening. Isaac weakened to a tropical storm with maximum sustained winds of 50 kts with gusts to 60 kts while passing just east of Cape Race, Newfoundland at 2100 UTC October 2, and became extratropical that evening. The ship Elektra (SIWB) (40N 55W) reported south winds of 45 kts at 0600 UTC on the 2nd. Later, the oil platform VEP717 (46.8N 48.8W) reported southwest winds of 55 kts and 4.5 m seas (15 ft) at 0000 UTC October 3 as Isaac passed to the west. The remains of Isaac weakened to a gale shortly thereafter while heading northeast, before re-intensifying to a minimal storm near the northern British Isles on October 6. The cyclone then weakened and moved into Norway the next day.
Other Significant Events of the Period
North Atlantic Storm, September 11-14: The development of this unseasonably strong low for late summer is depicted in Figure 4. This hurricane-force storm developed from the merger of two lows south of Greenland, with the central pressure dropping 30 hPa in the twenty-four hour period ending at 1200 UTC September 12. This was the first hurricane-force low of the period that did not have tropical origins. The high-resolution scatterometer winds in Figure 5 reveal hurricane-force west to northwest winds on the back side of the storm, with up to 80 kts appearing near 51N 33W. The satellite image in Figure 2 shows the storm near the edge of the image, west of the British Isles late on the 12th. The ship SeaLand Florida (KRHX) near 50N 21W reported west winds of 55 kts and 6.0 m seas (20 ft), while the ship Atlantic Cartier (SCKB) (54N 34W) had northwest winds of 40 kts and 8.0 m seas (26 ft), at 1800 UTC September 12. The storm maintained hurricane-force winds until 0000 UTC on the 13th, with the center developing a central pressure as low as 973 hPa twelve hours later. The system then turned north and weakened near Iceland on the 15th.
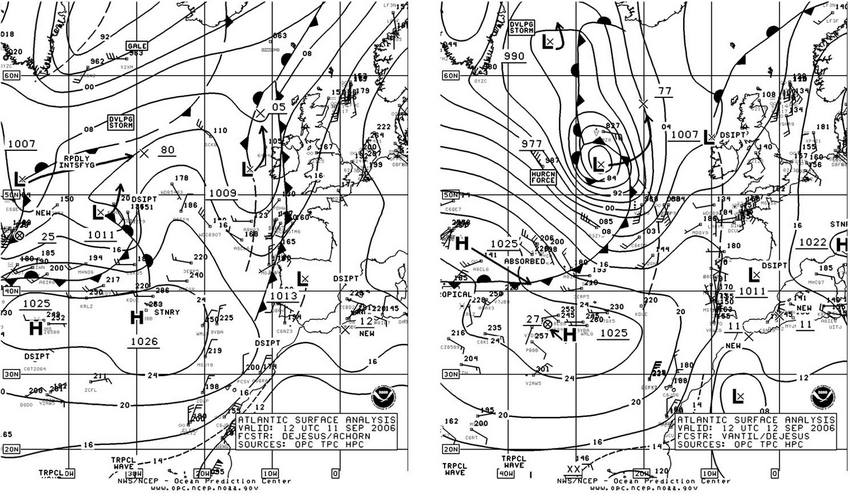
Figure 4. OPC North Atlantic Surface Analysis charts (Part 1 - east) valid 1200 UTC September 11 and 12, 2006.
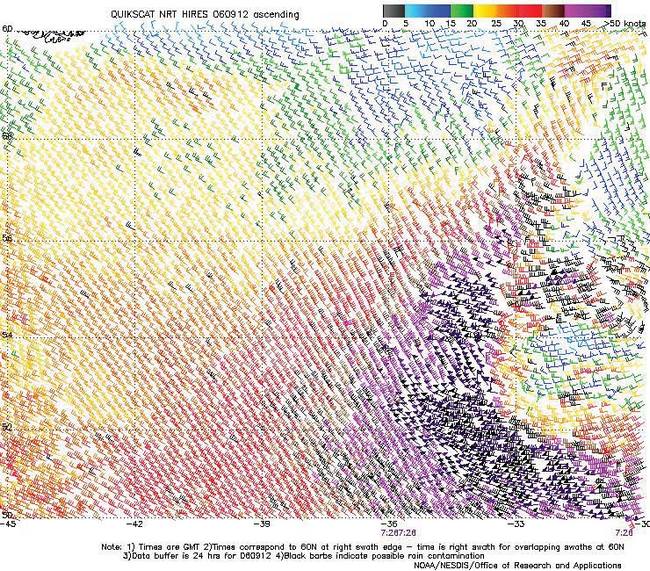
Figure 5. High-resolution QuikScat scatterometer image of satellite-sensed winds around the west side of the storm shown in Figure 4. The resolution is 12.5 km, versus 25 km in the coarser version of such imagery. The valid time of the pass is 0726 UTC September 12, 2006, or about four and one-half hours prior to the valid time of the second part of Figure 4.
Image is courtesy of NOAA/NESDIS/Office of Research and Applications.
North Atlantic Storm, October 5-7: This early-season hurricane-force low followed a northeastward track just east of the island of Newfoundland on October 5, and developed hurricane-force winds while passing over the north-central Atlantic from the afternoon of the 6th onto early October 7. The center developed a lowest central pressure of 968 hPa near 58N 31W at 0000 UTC October 7. The cyclone passed through an area with sparse observations, with high-resolution scatterometer data on the evening of October 6 showing a small area of west winds to 65 kts south of the center. The highest wind reported by a ship was an east wind of 40 kts at 61N 22W, from the ship Naja Arctica (OXVH2) at 1200 UTC on the 7th. The buoy 62105 (55.4N 12.1W) reported seas to 6.5 m (22 ft) at 0300 UTC on the 8th. The cyclone then moved northeast and weakened to a gale south of Iceland on the afternoon of the 7th, before moving into Iceland on the 9th.
Northeastern Atlantic and North Sea Storm, October 30-November 1: This cyclone developed initially from a frontal wave of low pressure in the central waters early on October 28 and, after moving northeast, turned more east and developed hurricane-force winds on the west side as it passed through the North Sea, as shown in Figure 6. At 1800 UTC October 31, the time of the second part of Figure 6, the buoy 62138 (58.2N 1.8W) reported north winds of 60 kts while buoy 63110 (59.5N 1.5E) reported north winds of 55 kta. Six hours later the platform XP421 (55.5N 5.0E) encountered northwest winds of 60 kts while the storm center was moving east of the area. Figure 7 reveals north winds to 65 kts in the high-resolution QuikScat winds with even an isolated 70 kts near the coast of Norway. The winds diminished by November 2 as the storm moved east and was replaced by high pressure.
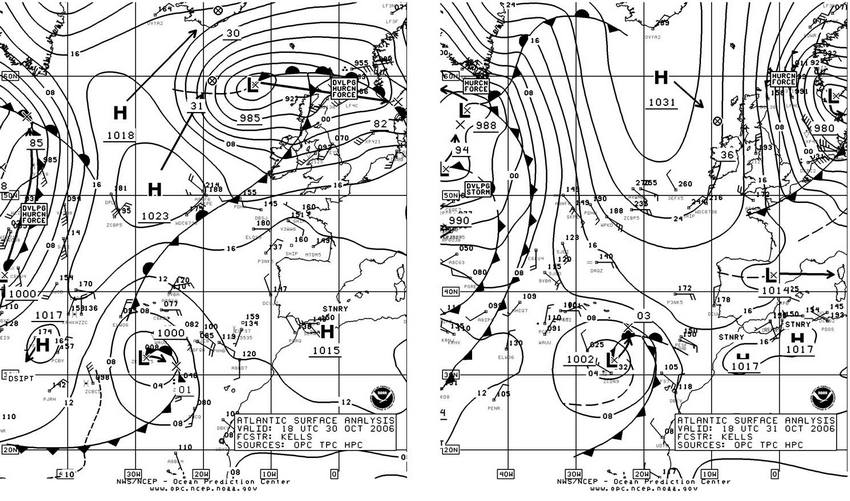
Figure 6. OPC North Atlantic Surface Analysis charts (Part 1) valid 1800 UTC October 30 and 31, 2006.
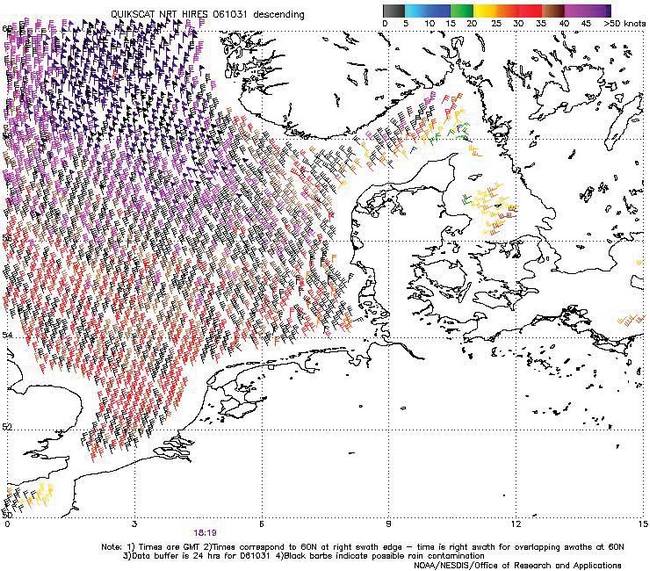
Figure 7. High-resolution QuikScat scatterometer image of satellite-sensed winds around the west side of the storm shown in Figure 6. The valid time of the pass is 1819 UTC October 31, 2006, or approximately the same time as in the second part of Figure 6.
Image is courtesy of NOAA/NESDIS/Office of Research and Applications.
Greenland Storm of October 30-November 1: Figure 6 shows a frontal system associated with a complex area of low pressure in the Labrador Sea approaching Greenland with OPC analyzing hurricane force conditions near the southern tip of Greenland. The ship Irena Arctica (OXTS2) near 59N 45W reported northeast winds of 45 kts at 1800 UTC on the 31st. This event was brief and marginal with winds diminishing to gale force the next day as the front and associated area of low pressure lifted northeast.
North Atlantic Storm, November June 29: This cyclone originated from a complex area of low pressure south of Nova Scotia late on November 2 which headed north-northeast, and rapidly deepened after passing east of Greenland November 4. The central pressure dropped 33 hPa in the twenty-four hour period ending at 0000 UTC November 5, when the system was analyzed by OPC as a 960 hPa hurricane-force low between Greenland and Iceland. A QuikScat pass near this time revealed 65 kts winds just south of the center, but stronger winds up to 90 kta from the east appeared north of the center, with some question as to accuracy given the proximity to the sea ice edge. The appearance was similar to Figure 13 for a later stronger system, except that the later event had winds to 75 kts on the south side. The main storm center headed northeast of Iceland on the 5th but left a residual low east of Greenland by the 6th.
Northeast Atlantic Storm, November 15-16: This was a short-lived event that developed impressive winds on the north side as a low pressure area developed or re-formed south of Iceland early on November 15 and intensified while drifting east. A scatterometer pass early on the 16th revealed winds to 80 kts in northeast flow between the deepening low and Iceland. The winds appear similar to those in Figure 13 for a later event, except not quite as strong. The center developed a central pressure of 967 hPa near 59N 13W before accelerating northeast and weakening late on the 16th and the 17th. The buoy 64045 (59.0N 11.6W) reported northwest winds of 30 kts but seas 8.5 meters (28 feet) at 2100 UTC on the 17th.
Northeast Atlantic Storm of November 18-21: Low pressure moved east-northeast from the Labrador coast early on November 18 and rapidly intensified, with the central pressure dropping 31 hPa in the twenty-four hour period ending at 1200 UTC November 19, when the center was at 59N 20W (956 hPa). The center developed a lowest central pressure of 950 hPa near 60N 9W at 1200 UTC on the 20th. Hurricane-force winds accompanied this system between 1200 UTC on the 19th and 0000 UTC on the 21st, with winds appearing similar to those in a later event as in Figure 15. The buoy 62138 (58.2N 1.8W) reported southwest winds of 50 kts at 1200 UTC November 20. The cyclone subsequently drifted southeast and weakened, becoming a gale in the North Sea by early on November 22.
North Atlantic Storm of November 21-28: The development of this cyclone can be traced back to an initial development of a slow-moving small storm-force low off the southeast U.S. coast November 21. The ship Sealand Motivator (WAAH) (37N 76W) north of the center reported northeast winds of 50 kts at 0000 UTC on the 22nd. The system remained nearly stationary and weakened to a gale late on the 22nd, before accelerating northeast to Georges Bank early on the 24th. Figure 8 depicts the rapid redevelopment or "bombing" of this system after it passed east of Newfoundland, with the central pressure dropping 47 hPa in twenty-four hours. At 0000 UTC November 26 the ships CSCL Fos (V2OH6) (40N 28W) and Atlantic Cartier (SCKB) (48N 44W) encountered southwest winds of 50 kts and northwest winds 50 kts, respectively. The central pressure dropped to as low as 944 hPa (27.88 inches) six hours later. The cyclone then turned northeast and began a slow weakening trend, but maintained hurricane-force winds for an unusually long period between 1200 UTC November 25 and 0600 UTC on the 27th. The ship Fidelio (WQVY) reported southwest winds of 65 kts near 50N 16W at 0000 UTC on the 27th. Figure 9 is a QuikScat high-resolution image from late on the 25th revealing winds to 80 kts on the back side of the storm center. The slowly weakening center reached 58N 18W at 1800 UTC on the 27th before turning northwest and west toward Greenland, briefly developing hurricane-force winds near the southeast coast of Greenland on the 29th before turning southeast and continuing to weaken.
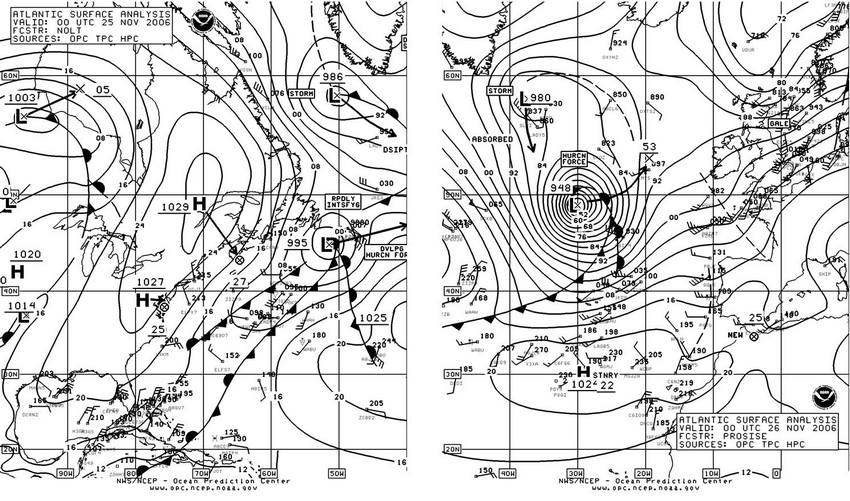
Figure 8. OPC North Atlantic Surface Analysis charts valid 0000 UTC November 25 (Part 1) and 0000 UTC November 26 (Part 2).
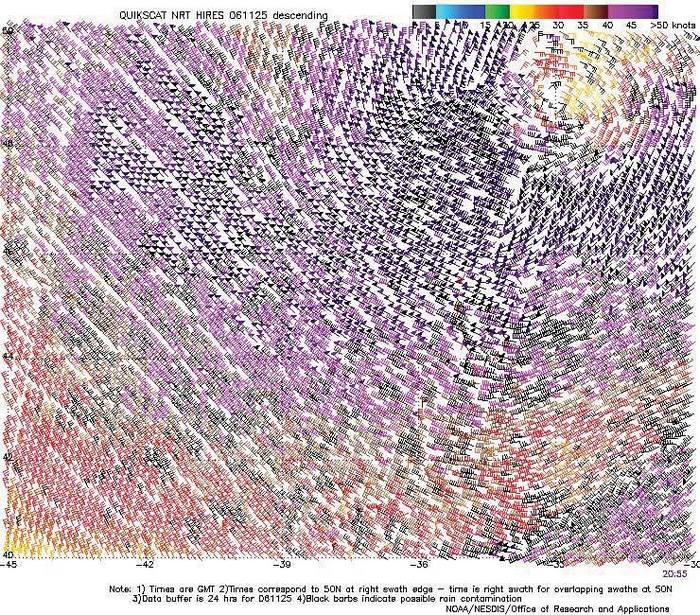
Figure 9. High-resolution QuikScat scatterometer image of satellite-sensed winds around the storm shown in Figure 8. The valid time of the pass is 2055 UTC November 25, 2006, or approximately three hours prior to the valid time of the second part of Figure 8. The center of the storm is in the upper right side of the image near 49N 33W.
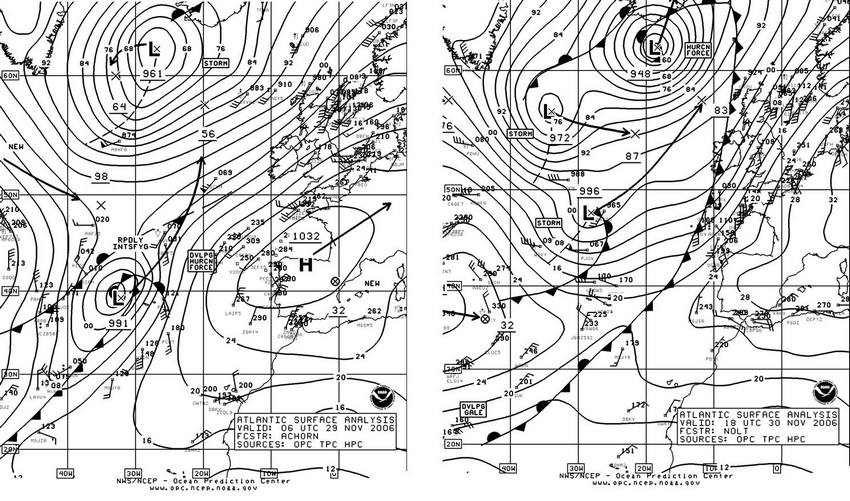
Figure 10. OPC North Atlantic Surface Analysis charts (Part 1) valid 0600 UTC November 29 and 1800 UTC November 30, 2006.
Eastern North Atlantic Storm, November 28-December 1: This cyclone developed from a frontal wave of low pressure near 36N 42W at 1800 UTC on November 28 which moved north-northeast toward Iceland while rapidly deepening. Figure 10 shows the development of this system over a thirty-six hour period, with the center developing a central pressure as low as 948 hPa just south of Iceland.
The central pressure dropped 36 hPa in the twenty-four hour period ending at 1800 UTC November 30. Selected ship and buoy observations taken in this storm are listed in Table 2, including two with hurricane-force winds. The storm center then moved north of Iceland December 1 and weakened.
| OBSERVATION | POSITION | DATE/TIME(UTC) | WIND | SEAS(m/ft) |
|---|---|---|---|---|
| V2OH7 | 46N 22W | 29/1200 | S 45 | 10.5/35 |
| Faust (WRYX) | 50N 18W | 29/1900 | S 50 | |
| 50N 17W | 29/2100 | SW 80 | 15.5/51 | |
| 50N 15.5W | 30/0000 | S 66 | ||
| SCKM | 51N 25W | 30/0000 | W 50 | 6.5/22 |
| Buoy 62095 | 53.1N 15.9W | 30/0200 | S 49 | 11.0/36 |
| Buoy 62108 | 53.5N 19.5W | 30/0100 | S 35 | 8.5/28 |
| 30/0400 | SW 25 | 10.0/33 | ||
| Buoy 64045 | 59.2N 11.6W | 30/1900 | SW 30 | 11.0/36 |
Table 2. Ship and buoy observations taken during the storm of November 28-December 1, 2006.
North Atlantic Storm, December 1-4: This system became a storm when moving off the Labrador coast on December 1 and redeveloped to a new center near 56N 25W at 1200 UTC December 2. By 0600 UTC on the 3rd the center was at 58N 16W with a 952 hPa central pressure, down 15 hPa in twenty-four hours. The ships Bonn Express (DGNB) at 51N 1E and the Arco California (WMCV) at 50N 2W reported south winds of 55 kts, at that time. The storm center developed a lowest central pressure of 949 hPa near 60N 9W at 1800 UTC on the 3rd , with the buoy 62138 (58.3N 1.7W) reporting southwest winds of 65 kts. The storm then moved northeast across the Norwegian Sea and weakened on December 4.
North Atlantic Storm, December 4-7: This developing hurricane-force low underwent early initial rapid intensification while passing east of the U.S. northeast coast and south of the Canadian Maritime Provinces on December 4 (Figure 11). The central pressure fell 39 hPa in the twenty-four hour period ending at 1800 UTC on the 4th, and by 1200 UTC on the 5th the cyclone approached its maximum intensity. The second part of Figure 11 shows the storm passing near the Grand Banks, when the platforms VEP717 (46.7N 48.7W) and Hibernia (HP6038, 46.4N 48.4W) both reported southwest winds of 70 kts. The storm then moved out over the central North Atlantic and expanded, with the center developing a central pressure as low as 960 hPa near 54N 28W at 1200 UTC on the 6th. This storm was remarkable in that it maintained hurricane-force winds between 1800 UTC on the 4th and 1200 UTC on the 7th, about two and one-half days. Slow weakening followed, with the system weakening to a gale in the Norwegian Sea on the 8th, and passing northeast of the area by the 9th.
North Atlantic Storm, December 8-11: This intense storm formed from the consolidation of the complex system of lows over the Canadian Maritimes as shown in Figure 12, eventually absorbing the low in the Davis Strait. At 1800 UTC December 8 the platform YJUF7 near 47N 48W reported south winds of 65 kts, while the ship Stuttgart Express (DGBE) near 42N 56W reported south winds of 50 kts. The central pressure dropped an impressive 53 hPa in the twenty-four hour period ending at 1800 UTC December 9, when the center reached 62N 37W with a pressure of 935 hPa. The system slowed with the central pressure dropping further to as low as 928 hPa (27.40 inches) at 1200 UTC on the 10th. The second part of Figure 12 shows an analysis of the storm near maximum intensity overlaid over an infrared satellite image. Higher clouds can be seen wrapping around the south side of the center, while the cold frontal band is buckling and forming a wave, a sign that the storm is near maximum intensity. This storm became the deepest of the period in either ocean in terms of central pressure, and was also remarkable for the duration of hurricane-force winds. Hurricane-force winds lasted between 1200 UTC December 8 and 1200 UTC December 12, almost three days. The highest wind report from a ship was a southwest wind of 60 kts from the ship Irena Arctica (OXTS2) near 62N 21W at 0000 UTC on the 11th. The QuikScat pass in Figure 13 reveals northeast winds to 90 kts between the cyclone’s occluded front and the Greenland coast, and winds to 75 kts on the south side of the center. The cyclone then began to weaken and passed northeast of Iceland on December 12.
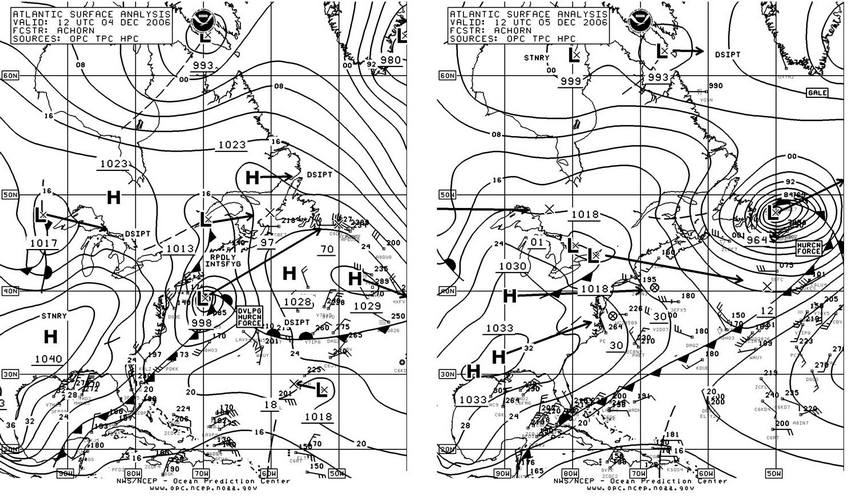
Figure 11. OPC North Atlantic Surface Analysis charts (Part 2) valid 1200 UTC December 4 and 5, 2006.
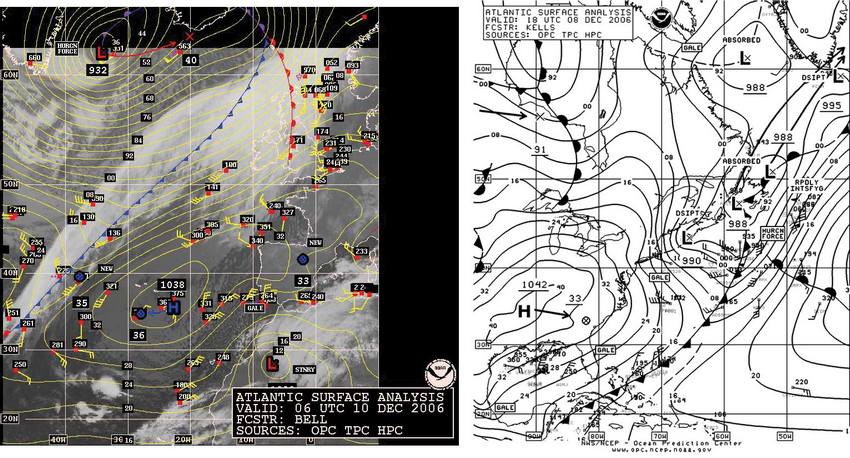
Figure 12. OPC North Atlantic Surface Analysis charts valid 1800 UTC December 8 (Part 2) and 0600 UTC December 10 (Part 1), with the second surface analysis overlaid over an infrared satellite image.
Northeast Atlantic Storm, December 13-15: This cyclone followed a track farther south and closer to that of the December 1-4 storm, with much of the development occurring over the northeast waters. The center deepened from 987 hPa near 53N 19W to 960 hPa near 62N 12W in the twenty-four hour period ending at 0000 UTC December 14. The center developed a lowest pressure of 956 hPa six hours later near 63N 10W. The platform OZ200 (60N 5W) reported southwest winds of 60 kts at 1200 UTC on the 14th. A high-resolution scatterometer image taken near maximum intensity revealed winds to 70 kts in the south and west sides, somewhat resembling the image in Figure 15 for a later event. The cyclone then passed northeast of Iceland by the 15th.
North Atlantic Storms, December 19-23: The first storm system moved northeast from Newfoundland on the 18th and passed just east of Greenland early on the 20th. The first part of Figure 14 shows the central pressure down to 957 hPa east of Greenland, a drop of 28 hPa in twenty-four hours. A high-resolution QuikScat scatterometer pass near 2200 UTC on the 20th revealed west winds to 70 kts just southeast of the tip of Greenland, with the hurricane-force winds lasting for almost twenty-four hours ending at 1800 UTC on the 21st. The ship Arena Arctica (OXTS2) reported southeast winds of 45 kts near 59N 38W at 0000 UTC December 20. This low was then replaced by a rapidly-developing low coming from the south as depicted in Figure 14, with hurricane-force winds developing at 0000 on the 21st. The high-resolution QuikScat pass in Figure 15 valid just after the time of the second part of Figure 14 reveals winds to 70 kts around the southeast through the west sides of the center, with even an isolated 75 kts. The storm developed a central pressure down to 958 hPa near 62N 33W at 1800 UTC on the 22nd, before moving north of the area on the 23rd. The vessel APL Arabia (A8CC4) (47N 29W) reported south winds to 45 kts and 5.0 m seas (16 ft) at 0000 UTC December 22.
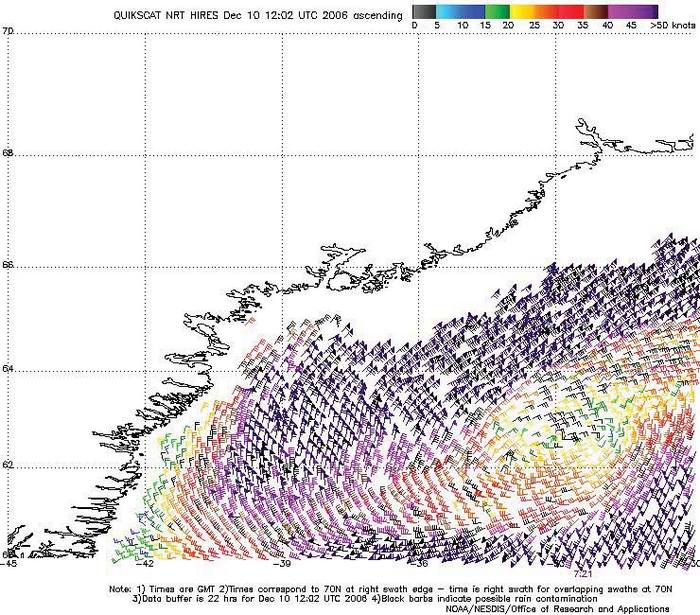
Figure 13. High-resolution QuikScat scatterometer image of satellite-sensed winds around the storm shown in Figure 12 when it was passing east of Greenland. The valid time of the pass is 0721 UTC December 10, 2006, or approximately one and one-half hours later than the valid time of the second part of Figure 12. The center of the storm is in the lower right side of the image near 63N 33W.
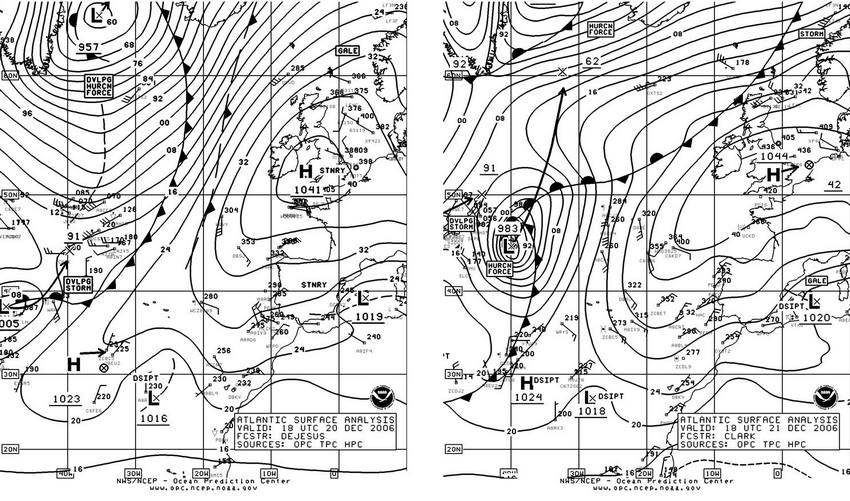
Figure 14. OPC North Atlantic Surface Analysis charts (Part 1) valid 1800 UTC December 20 and 21, 2006.
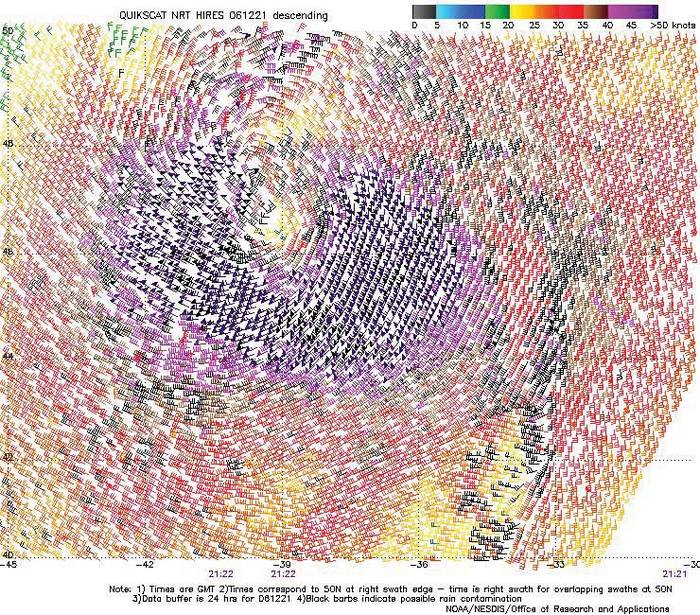
Figure 15. High-resolution QuikScat scatterometer image of satellite-sensed winds around the storm shown in Figure 14 when it was passing over the central North Atlantic near 47N 39W. The valid time of the pass is 2122 UTC December 21, 2006, or approximately three and one-half hours later than the valid time of the second part of Figure 14.
1. From Tropical Prediction Center website, http://www.nhc.noaa.gov/aboutsshs.shtml.