Marine Weather Review—North Pacific Area September through December 2005
By George P. Bancroft, NOAA National Center for Environmental PredictionIntroduction
This four-month interval is typically a period of maximum tropical cyclone activity in the western Pacific and increasing number and intensity of non-tropical systems as autumn progresses into winter. Tropical activity was down during this period compared to the same period in 2004, with the current four-month period producing only four tropical cyclones coming out of the western tropical Pacific and entering OPC's oceanic surface analysis area. All of these occurred early in the period, through mid-October, with the first redeveloping into a powerful hurricane-force low after becoming extratropical. October and December were most active with respect to hurricane-force lows, producing 5 and 6, respectively, while September and November had three each.
Due to the sheer number of strong systems during these stormy months, this article focuses mainly on hurricane-force lows and tropical cyclones.
Tropical Activity
Super Typhoon Nabi: Nabi, a leftover tropical cyclone from late August, intensified to a super typhoon by 1800 UTC on September 1 while moving northwest. The center was at maximum intensity at that time, near 19N 139E with maximum sustained winds of 140 kts with gusts to 170 kts, making Nabi the stronger of two super typhoons occurring during this period. The Condoleezza Rice (C6OK) reported near 18N 146E with a south wind of 35 kts at that time. The cyclone remained a super typhoon while tracking west-northwest about 800 nmi south of Japan, and then passed west of the area while slowly weakening on September 3. The ship Puteri Delima Satu (9MEU4) (27N 137E) and the Northwest Seaeagle (ZCAS2) (27N 135E) both reported southeast winds of 50 kts at 0000 UTC and 1200 UTC September 5, respectively. Nabi subsequently recurved northeast into the Sea of Japan and became extratropical late on the 6th, redeveloping into a hurricane-force storm near the northern Kurile Islands during a forty-eight hour period ending at 1800 UTC September 8 (Figure 1). At 1200 UTC on the 8th the Chebarkul (UDKO) (50N 156E) encountered east winds of 60 kts. The high-resolution QuikScat pass in Figure 2 reveals winds to 65 kts in the southern Sea of Okhotsk on the southwest side of the storm. The system then began a slow weakening trend while moving along 50N, and then northeast into the Bering Sea on the 10th, where it weakened to a gale on the 11th. The remains of Nabi then moved into northwest Alaska late on the 12th.

Figure 1. (above) OPC North Pacific Surface Analysis charts (Part 2 - west) valid 1800 UTC September 6 and 8, 2005. Tropical Storm Nabi, just west of Japan, is depicted becoming an extratropical hurricane-force storm.

Figure 2. (left) High-resolution QuikScat scatterometer image of satellite-sensed winds valid at 1833 UTC September 8, 2005, close to the valid time of Figure 1. The resolution is 12.5 km, versus the 25 km resolution of regular QuikScat imagery.
Image is courtesy of NOAA/NESDIS /Office of Research and Applications.
Typhoon Saola: Tropical Depression 18W formed from a non-tropical low near 21N 152E early on September 20 and was named Tropical Storm Saola later that day while moving northwest, with maximum sustained winds of 35 kts and gusts to 45 kts. Late on 21st Saola became a typhoon near 25N 146E with maximum winds of 70 kts with gusts to 85 kts. The cyclone developed a maximum intensity of 100 kts sustained with gusts to 125 kts while 250 nmi southeast of Tokyo early on the 24th, before turning northeast and beginning to weaken. At 0000 UTC September 25 the Arctic Sun (ELQB8) near 35N 139E reported northeast winds of 50 kt. Saola then weakened to a tropical storm near 37N 146E at 1800 UTC on the 25th and to an extratropical gale-force low late on the 25th.
Extratropical Saola briefly re-intensified to a 1000 hPa storm near 39N 157E at 0000 UTC on the 27th, when the Chembulk Vancouver (DGVC) encountered northeast winds of 55 kts near 41N 161E. The system weakened again by the 27th while tracking east-northeast, and moved onshore near Vancouver Island on September 29.
Super Typhoon Longwang: Tropical Depression 19W formed near 19N 143E at 0000 UTC September 26 and was named Tropical Storm Longwang six hours later while moving northwest, with maximum sustained winds of 35 kts with gusts to 45 kts. Longwang became a typhoon near 22N 141E at 0000 UTC on the 27th with 70 kts maximum winds and gusts to 85 kts, and then turned west between 22N and 23N on the 27th. The cyclone intensified to a super typhoon with maximum sustained winds of 130 kts with gusts to 160 kts early on September 29 while passing west of OPC's oceanic chart area.
Typhoon Kirogi: Kirogi was a strong typhoon while moving northeast into OPC's oceanic chart area, 550 nmi south of Japan early on October 16. The maximum sustained winds were 125 kts with gusts to 150 kts, just below super-typhoon strength. Kirogi weakened to a tropical storm near 33N 141E at 1800 UTC on the 18th, and became an extratropical gale-force low six hours later. The remains of Kirogi then continued moving northeast without redevelopment.
Other Significant Events
Bering Sea Storm, September 22-23: One of two other brief hurricane-force events in September, this low originated as a frontal wave of low pressure near 42N 162E early on September 21 and moved northeast while rapidly intensifying. The center reached 60N 174W with a pressure of 969 hPa at 1800 UTC on the 22nd, after the central pressure fell 34 hPa in the preceding twenty-four hours. The storm briefly developed hurricane-force winds six hours later, when the lowest pressure of 962 hPa was reached. The Guardsman (WBN5978) near 60.5N 167W reported south winds of 60 kts at that time. The system then weakened and passed north of the Bering Strait on the 23rd.
Gulf of Alaska Storm of September 26-28: This cyclone originated in the same general area as was the case with the Bering storm above, but the track was just south of the central Aleutians late on the 25th and just south of the Alaska Peninsula early on the 27th. The cyclone briefly developed hurricane-force winds ahead of a strong frontal system approaching the southern coast of mainland Alaska at 1800 UTC September 27. The storm center developed a lowest central pressure of 967 hPa (near 55N 158W) at that time. Some notable observations taken in this storm are listed in Table 1. The front moved onshore shortly thereafter and the storm center stalled and weakened in the Gulf of Alaska.
| OBSERVATION | POSITION | DATE/TIME(UTC) | WIND(kt) | SEAS(m/ft) |
|---|---|---|---|---|
| Caribe Challenger (WDA3588) | 55.5N 160.6W | 26/2000-27/0200 | E 60 | |
| SeaLand Kodiak (KGTZ) | 57N 150W | 27/0000 | E 50 | |
| WCZ7337 | 60N 147W | 27/1900 | E 50 | |
| WDB7583 | 59.7N 151.9W | 27/2100 | NE 60 | |
| Buoy 46082 | 59.7N 143.4W | 27/2100 27/2200 |
E 45 G58 Peak gust 64 |
7.0/23 maximum 9.0/30 |
| Buoy 46076 | 59.5N 148.0W | 27/1900 27/2200 |
E 41 G52 Peak gust 60 |
8.0/26 maximum 8.5/28 |
| East Amatuli Island (AMAA2) | 59N 152W | 27/1829 27/1900 |
NE 62 Peak gust 78 |
|
| St. Augustine Island (AUGA2) | 59.4N 153.4W | 27/2100 | NE 54 G67 | |
| Table 1. Some ship, buoy and coastal C/MAN observations taken during storm of September 26-28. The term "maximum" as applied to seas means highest significant wave height observed. | ||||
Twin Hurricane-Force Lows, North Pacific October 8-11: Figure 3 depicts two hurricane-force lows appearing at the same time and near maximum intensity. The Bering Sea storm originated near Japan early on October 8 and developed hurricane-force winds early on the 9th. The cyclone maintained hurricane-force strength until early on the 10th while tracking east and beginning to weaken, and weakened to a gale-force low upon reaching the Gulf of Alaska on the 12th. The eastern storm originated well south of the eastern Aleutians near 45N on October 7, with the central pressure dropping 27 hPa in the twenty-four hour period ending at 1200 UTC on the 9th. The system is at maximum intensity in Figure 3. The cyclone then quickly moved inland and weakened early on the 10th. This event featured ship reports with hurricane-force winds, which are included in Table 2.
| OBSERVATION | POSITION | DATE/TIME(UTC) | WIND(kt) | SEAS(m/ft) |
|---|---|---|---|---|
| Polar Eagle (ELPT3) | 48N 163E 49.5N 165E 50N 167E 50.5N 168E 50.7N 169E |
09/0600 09/1200 09/1700 09/1900 09/2300 |
SW 50 W 55 W 60 W 65 W 75 |
|
| CSX Spirit (WFLG) | 48N 164E | 10/0000 | NW 40 | 10.0/33 |
| Zim Atlantic (4XFD) | 50N 157E | 10/0600 | NW 55 | |
| SeaLand Anchorage (KGTX) | 54N 136W 54.3N 136.7W |
09/2000 09/2100 |
SW 50 SW 70 |
9.5/31 11.5/38 |
| North Star (KIYI) | 55N 137W | 09/2000 | S 40 | 9.5/31 |
| Buoy 46184 | 53.9N 138.8W | 09/2100 | SW 45 | 8.2/27 |
| Table 2. Ship and buoy observations taken in the twin hurricane-force storms of October 8-11. | ||||
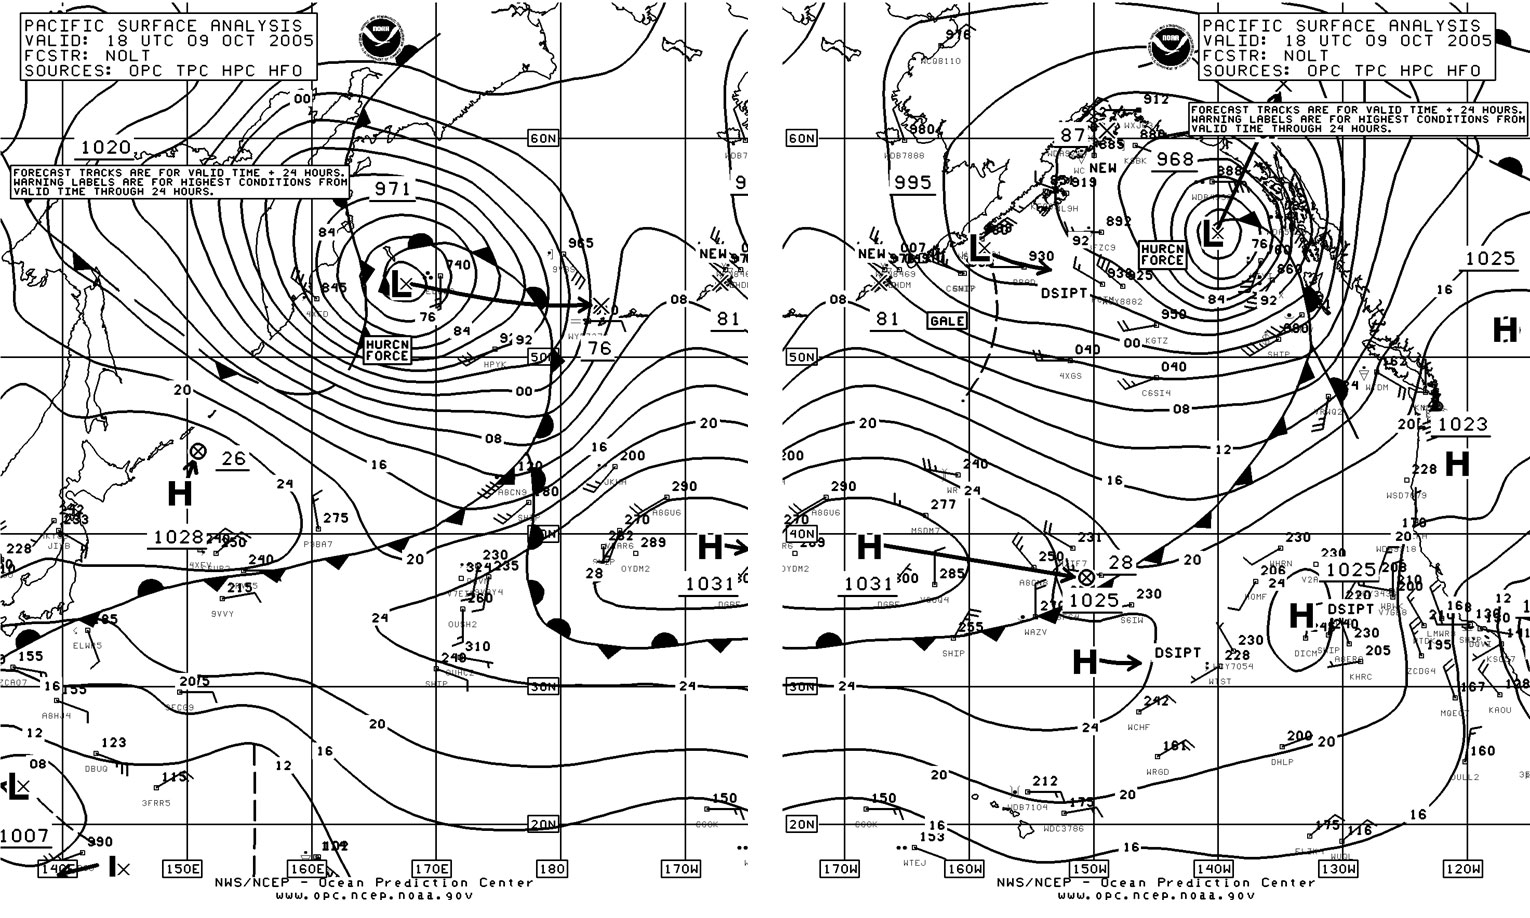
Figure 3. OPC North Pacific Surface Analysis charts (Parts 1 and 2) valid 1800 UTC October 9, 2005. Twin hurricane-force storms are shown near maximum intensity.
North Pacific Storm, October 13-15: This developing storm originated east of Japan near 35N 157E early on October 12, and rapidly intensified while tracking northeast (Figure 4). The central pressure fell 21 hPa in the twenty-four hour period ending at 0600 UTC on the 14th. The storm is shown with a central pressure of 967 hPa, at maximum intensity, in the second part of Figure 4. At 0600 UTC October 13 the CCNI Busan (V7CG8) (38N 167E) encountered north winds of 55 kts. A high-resolution QuikScat pass in Figure 5 reveals numerous wind barbs in the 50 to 70 kts range around the south and west sides of the well-defined storm center near 45N 175W, in an area that is otherwise lacking in ship data. The system began weakening late on the 14th while continuing to move northeast, becoming a gale-force low on the 15th and then moving onshore in Southeast Alaska late on the 16th.
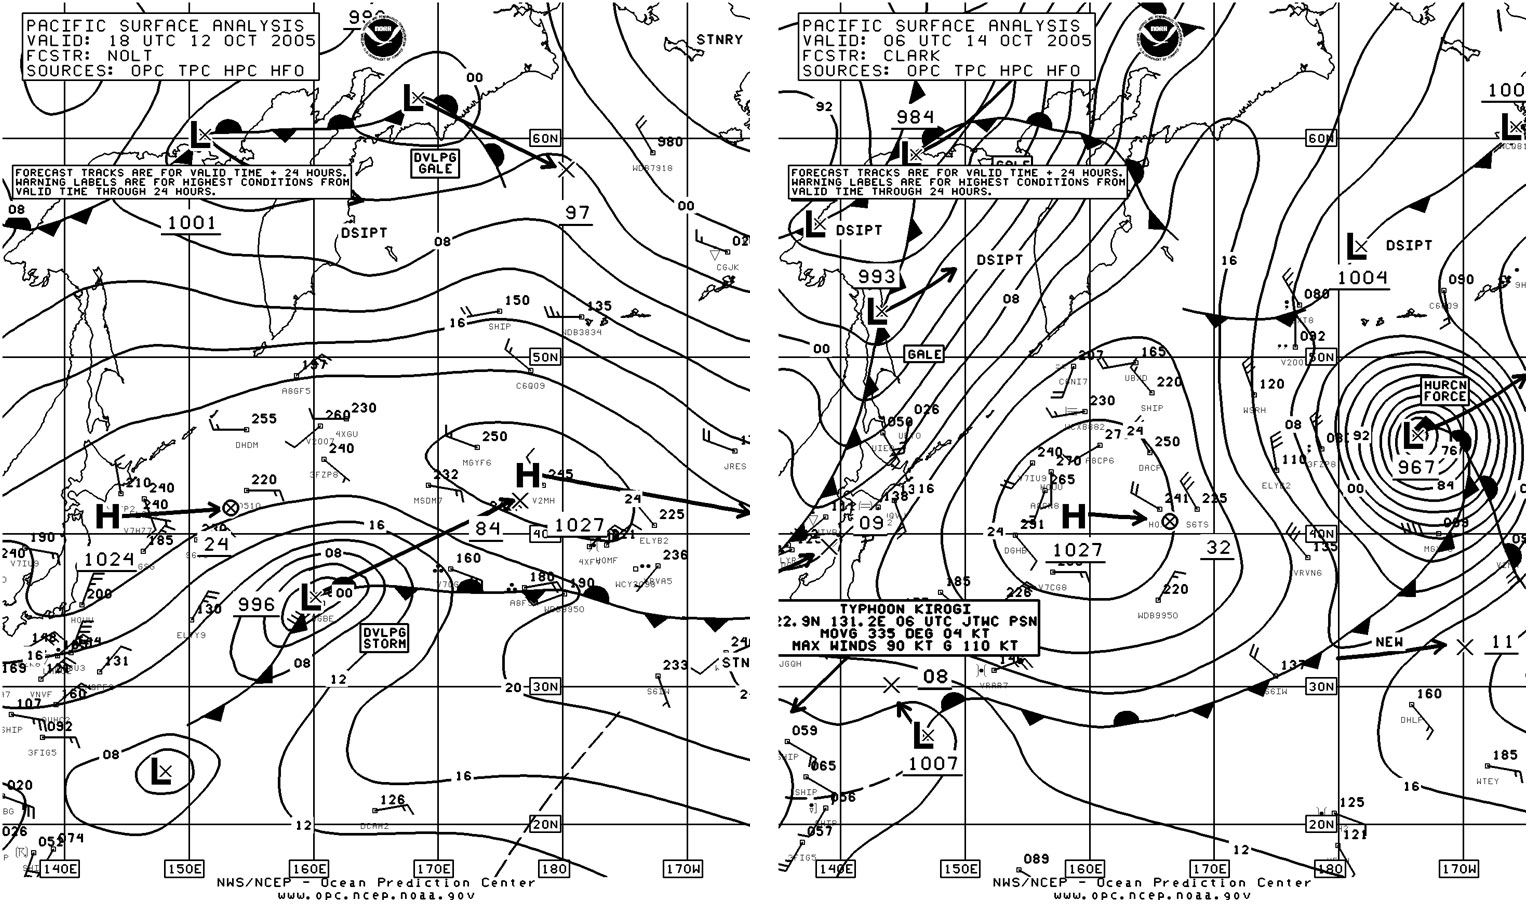
Figure 4. OPC North Pacific Surface Analysis charts (Part 2) valid 1800 UTC October 12 and 0600 UTC October 14, 2005.
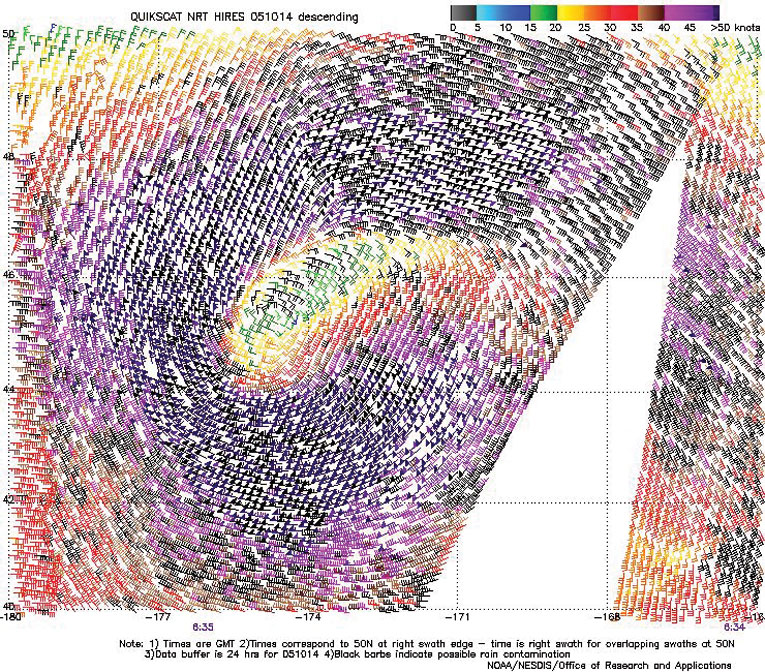
Figure 5. High-resolution QuikScat scatterometer image of satellite-sensed winds around the storm shown in Figure 4. The valid time of the pass is 0835 UTC October 14, 2005, or about two and one-half hours later than the valid time of the second part of Figure 4.
Image is courtesy of NOAA/NESDIS/ Office of Research and Applications.
Bering Sea Storm of October 16-17: This event was similar to the one in late September. An area of low pressure moved northeast through the Bering Sea on October 16 and early October 17 while rapidly deepening, with the central pressure dropping 33 hPa in the twenty-four hour period ending at 0600 UTC on the 17th. The lowest pressure was 962 hPa, as in the September event, reached when the center was in the northeast Bering Sea early on the 17th. A QuikScat pass on the morning of the 17th showed a small area of 65 to 70 kts northwest winds near 59N 167W. The ship (WDB7918) (59N 172W) reported northwest winds of 60 kts at 1200 UTC on the 17th, while the vessel Hat Trick (WCY8812) (54.2N 163W) encountered southwest winds of 55 kts. The central Bering Sea buoy 46035 (57.1N 177.6W) reported northwest winds of 47 kts with gusts to 56 kts and 4.5 m seas (15 ft) at 0500 UTC on the 17th, followed by a peak gust of 62 kts one hour later. At 1100 UTC on the 17th the same buoy reported highest seas of 7.5 m (25 ft). The storm then weakened inland over Alaska later on the 17th.
Northeast Pacific Storm, October 19-21: The rapid development of this hurricane-force storm over a thirty-six hour period is shown in Figure 6, and involved the merging of northern and southern lows. The lowest central pressure of 955 hPa reached at 0000 UTC on the 21st made this cyclone one of the deepest of the period in the North Pacific. There was abundant ship and buoy data around the low but not in the area of strongest winds southwest of the center. A high-resolution QuikScat pass (Figure 7) shows this area, containing wind barbs up to 70 kts. Other observations taken around this storm are tabulated in Table 3. The system subsequently weakened to a gale in the northern Gulf of Alaska early on the 22nd, stalled and then redeveloped southeast toward Vancouver Island late on October 24.
| OBSERVATION | POSITION | DATE/TIME(UTC) | WIND(kt) | SEAS(m/ft) |
|---|---|---|---|---|
| ZimCanada (4XGS) | 55N 152W | 20/0000 | S 50 | 8.8/29 |
| Ship (ELYP2) | 44.5N 170.6W | 20/0000 | NW 45 | 10.5/34 |
| APL New York (A8GS3) | 40N 162W | 20/0600 | W 55 | |
| Star Geiranger (LAKQ) | 43.7N 152W | 20/1800 | SW 50 | 12.8/42 |
| Zim Canada (4XGS) | 54N 162W | 20/1800 | NW 60 | |
| SeaLand Tacoma (KGTY) | 54N 162W | 21/0000 | NW 60 | 9.0/30 |
| Polar Discovery (WACW) | 58.6N 143.2W | 21/0600 | E 60 | 8.5/28 |
| Buoy 46634 | 48.1N 162.3W | 20/0400 | NW 55 | |
| Buoy 46075 | 53.9N 160.8W | 20/1800 | 8.5/28 | |
| Buoy 46078 | 56.1N 152.5W | 20/1900 20/2200 |
NE 41 G51 | 7.5/25 maximum 10.0/33 |
| Buoy 46080 | 58.0N 150.0W | 21/0500 21/0600 21/0600 |
NE 39 G51 Peak gust 56 |
8.5/28 maximum 10.0/33 |
| Buoy 46061 | 60.2N 146.9W | 21/0900 21/1200 |
E 37 G49 | 5.5/18 maximum 7.0/23 |
| Buoy 46084 | 56.6N 136.2W | 21/0900 21/1200 |
SE 41 G52 Peak gust 58 |
7.0/23 maximum 8.0/26 |
| Buoy 46205 | 54.2N 134.3W | 21/0700 | SE 41 G56 | 8.0/26 |
| Buoy 46207 | 50.9N 129.9W | 21/0900 | SE 39 G52 | 7.0/23 |
| Buoy 46147 | 51.8N 131.2W | 21/0500 21/0900 |
SE 39 G51 | 7.0/23 maximum 8.0/26 |
| Table 4. Selected ship and buoy observations taken in the storm of October 19-21. | ||||
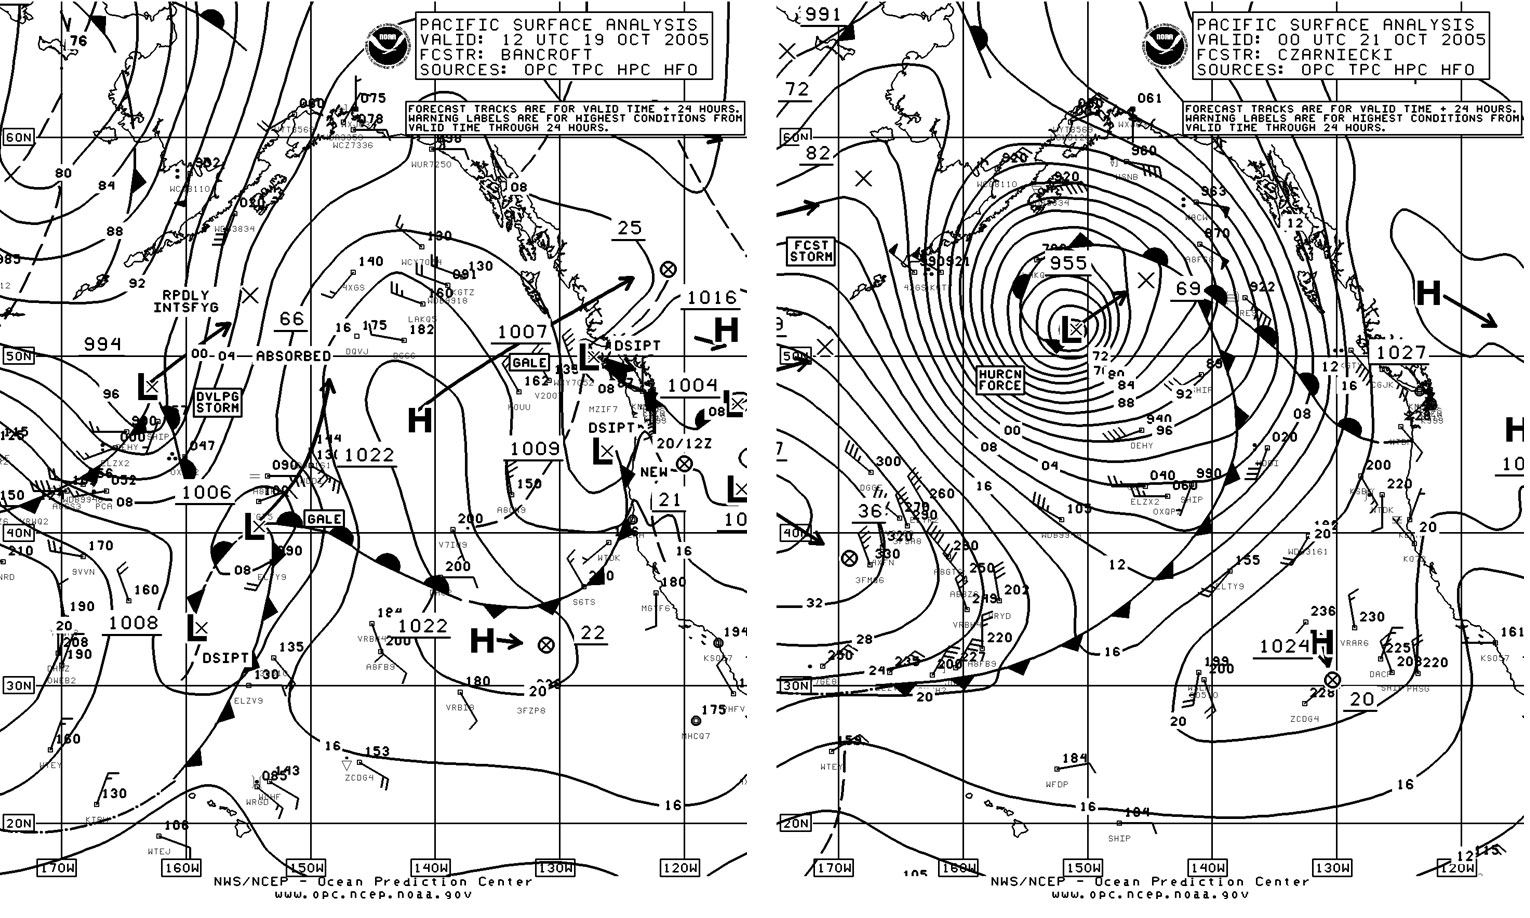
Figure 6. (above) OPC North Pacific Surface Analysis charts (Part 1 - east) valid 1200 UTC October 19 and 0000 UTC October 21, 2005.

Figure 7. (left) High-resolution QuikScat scatterometer image of satellite-sensed winds around the west and northwest sides of the storm shown in Figure 6. The valid time of the pass is 0650 UTC October 21, 2005, or six and one-half hours later than the valid time of the second part of Figure 6. The center of the storm is apparent near the lower right edge of the figure.
Image is courtesy of NOAA/NESDIS/ Office of Research and Applications.
Western North Pacific Storm of November 11-14: Figure 8 displays the rapid development of this storm over a twenty-four hour period, with the second part showing the system at maximum intensity. The central pressure fell an impressive 35 hPa during this period. Although not the most intense of the period, this cyclone was relatively compact and potent and produced perhaps the strongest winds of the period in the North Pacific. The QuikScat image in Figure 10 reveals winds to 85 kts on the south side of the storm and perhaps even a 90 kts barb near 40.5N 157.5E. The infrared satellite image in Figure 9 taken three hours before the time of maximum intensity shows an intense comma-like cloud pattern with cold (high) tops and high-topped clouds wrapping around a well-defined center. The CSX Spirit (WFLG) reported an east wind of 60 kts and 9.5 m seas (31 ft) near 47N 165E at 0600 UTC November 13. Blocked by high pressure to the northeast, the storm drifted east-southeast and weakened, with the center elongating eastward and then dissipating south of the eastern Aleutians on the 16th.
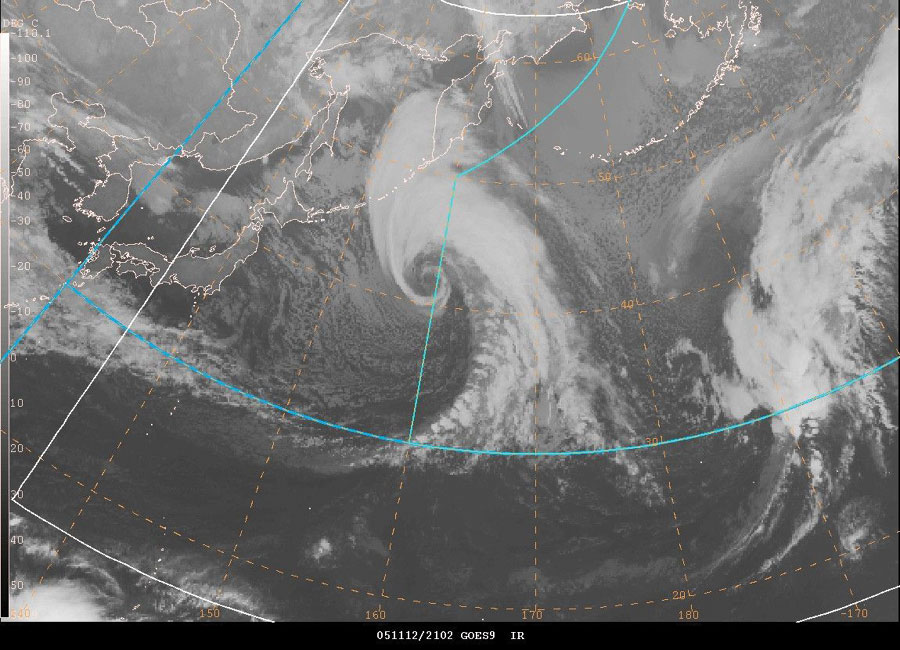
Figure 9. GOES9 infrared satellite image of the storm in Figure 8 valid at 2102 UTC November 12, 2005. Satellite senses temperature on a scale from black (warm) to white (cold) in this type of image. The storm was near its maximum intensity at this time, with the time of the image only about three hours prior to the valid time of the second part of Figure 8.

Figure 10. QuikScat scatterometer image of satellite-sensed winds around the storm shown in the second part of Figure 8. The valid time of the pass is 1842 UTC November 12, 2005, or about five hours prior to the valid time of the second part of Figure 8. The resolution is 25 km.
Image is courtesy of NOAA/NESDIS/ Office of Research and Applications.
Central/Eastern North Pacific Storm, November 17-18: This storm originated over the southern waters near the dateline late on November 16 and tracked north while rapidly intensifying. The central pressure lowered 38 hPa in the twenty-four hour period ending at 0600 UTC on the 18th, when the center was most intense at 958 hPa, near 50N 159W. OPC briefly classified this system as a hurricane force low at 0600 UTC on the 18th. QuikScat winds available close to this time revealed winds to 70 kts, like in the October 21 storm in this part of the Pacific, except these winds were southwest, on the southeast side of the storm center. The strongest wind reported by a ship was north 50 kts from APL Kennedy (9VAY4) (54N 162W) at 1200 UTC on the 18th. The buoy 46537 (49.8N 158.1W) reported a lowest pressure of 954.9 at 0750 UTC November 18. Buoy 46634 (47.8N 162.3W) reported north winds of 56 kts at 0017 UTC on the 18th. To the north, Buoy 46001 (56.3N 148.2W) reported south winds of 39 kts with gusts to 52 kts and 9.5 m seas (31 ft) at 2300 UTC November 18. Seas were as high as 12 m (39 ft) at this buoy three hours later. The storm center subsequently lifted north-northeast into mainland Alaska and weakened early on the 19th.
Southern Cutoff Storm, November 26-29: This system originated as a frontal wave northwest of Hawaii late on November 25 and moved into OPC's southern high seas waters on the 26th, while slowing and rapidly intensifying. Figure 11 shows this development, which appeared to have support aloft in the form of a 500 hPa trough that amplified and formed a closed low. See Reference 3 for more information on use of the 500 hPa chart. The 20 hPa drop in central pressure in the twenty-four hour period ending at 0600 UTC on the 27th is impressive for development this far south. Figure 12 shows high-resolution QuikScat data near the time of the second part of Figure 11, supporting the hurricane-force label. Unlike most other lows farther north, the highest winds, up to 70 kts, are on the north side of this low where there is high pressure. The strongest wind reported by a ship was a northeast wind of 60 kts from APL Malaysia (A8CB4) near 37N 155W at 1800 UTC November 27. After stalling on the 27th, the cyclone drifted west on the 28th, weakened on the 29th and then re-formed to the northeast as a gale moving toward the U.S. Pacific Northwest.
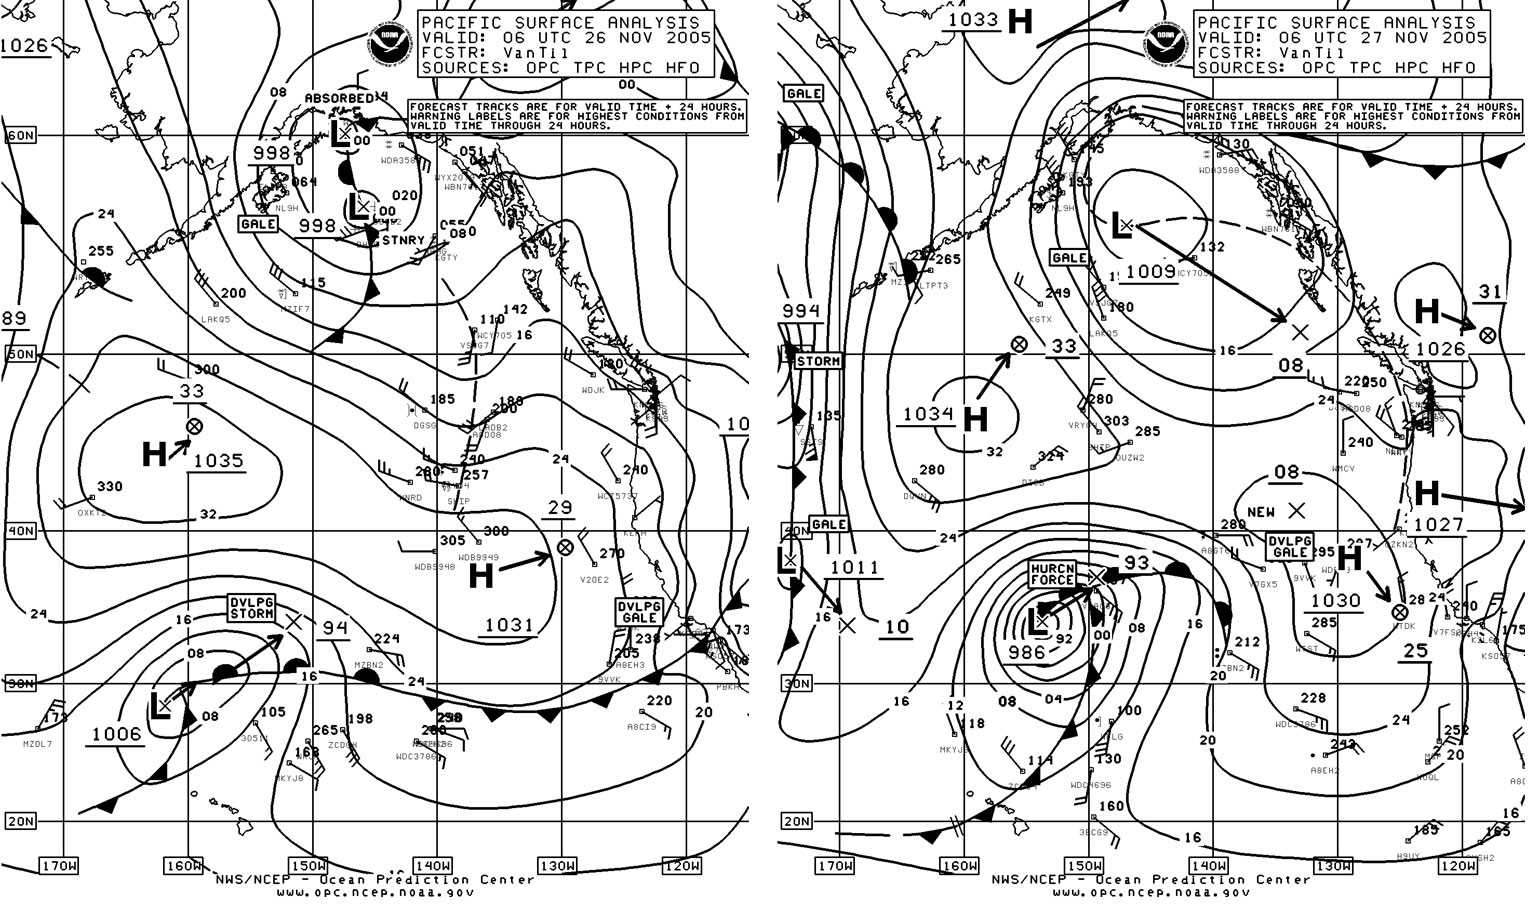
Figure 11. (above) OPC North Pacific Surface Analysis charts (Part 1) valid 0600 UTC November 26 and 27, 2005.
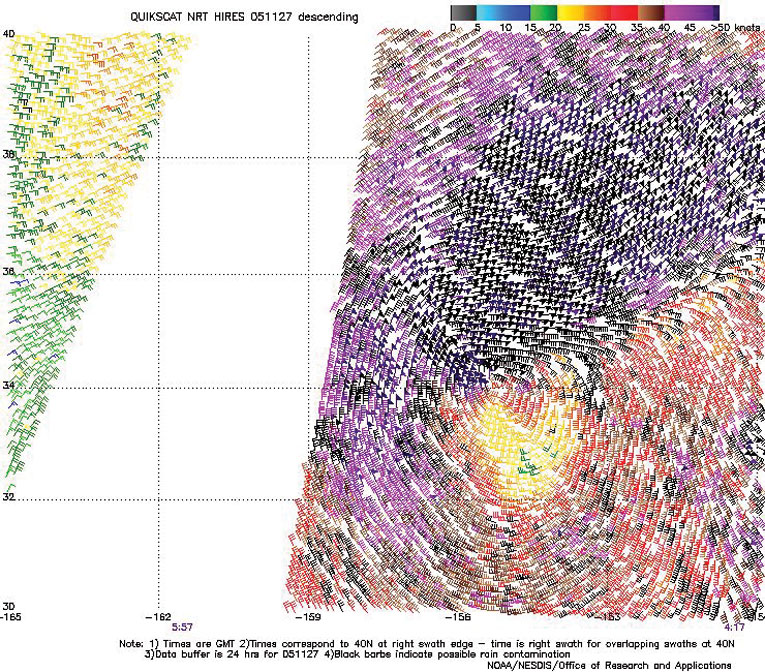
Figure 12. High-resolution QuikScat scatterometer image of satellite-sensed winds around the storm shown in the second part of Figure 11. The valid time of the pass is 0417 UTC November 27, 2005, or less than two hours prior to the valid time of the second part of Figure 11.
Image is courtesy of NOAA/NESDIS/ Office of Research and Applications.
Eastern North Pacific Storm, December 8-9: The first hurricane-force storm of a very active December was a marginal event, with a low deepening to 970 hPa early on the 9th after originating in the southern waters near the dateline late on the 7th. The low was briefly classified as hurricane-force from 0600 to 1200 UTC on the 9th, before the system weakened to a gale in the Gulf of Alaska later that day. The ship Mahimahi (WHRN) (45N 155W) reported southwest winds of 45 kts at 0600 UTC December 9.
North Pacific Storms, December 12-15: For the second time during the four-month period, two hurricane-force lows appeared simultaneously. The two formed as secondary lows south of a large complex storm southeast of the Kamchatka Peninsula on the 12th. Figure 13 valid 0000 UTC December 14 shows the two hurricane-force lows, one following the other, tracking eastward then more northeast across the Pacific. The most noteworthy ship and buoy reports were from the eastern low. The ship APL Singapore (WCX8812) (45N 164W) encountered west winds of 55 kts and 10.7 m seas (35 ft) at 0000 UTC on the 14th. Twelve hours later the ship Sea-Land Developer (V7HZ7) (50.5N 155.5W) encountered southwest winds of 60 kts and 12.2 m seas (40 ft). Buoy 46633 (47.1N 165.7W) reported northeast winds of 60 kts at 1700 UTC on the 13th. Ship Westwood Victoria (C6SI6) reported north winds of 50 kts near 42N 171W at 1800 UTC on the 14th, with the western storm. Figure 14 displays high-resolution QuikScat scatterometer winds around the stronger eastern storm, including wind barbs of at least 75 kts on the south and southwest sides of the storm center. The eastern low subsequently weakened to below hurricane force six hours later, with the western low maintaining hurricane-force winds until 0000 UTC on the 15th. The eastern low turned northwest into the Bering Sea on the 15th, where it dissipated, while the other low moved into southwest Alaska early on the 16th as a gale.
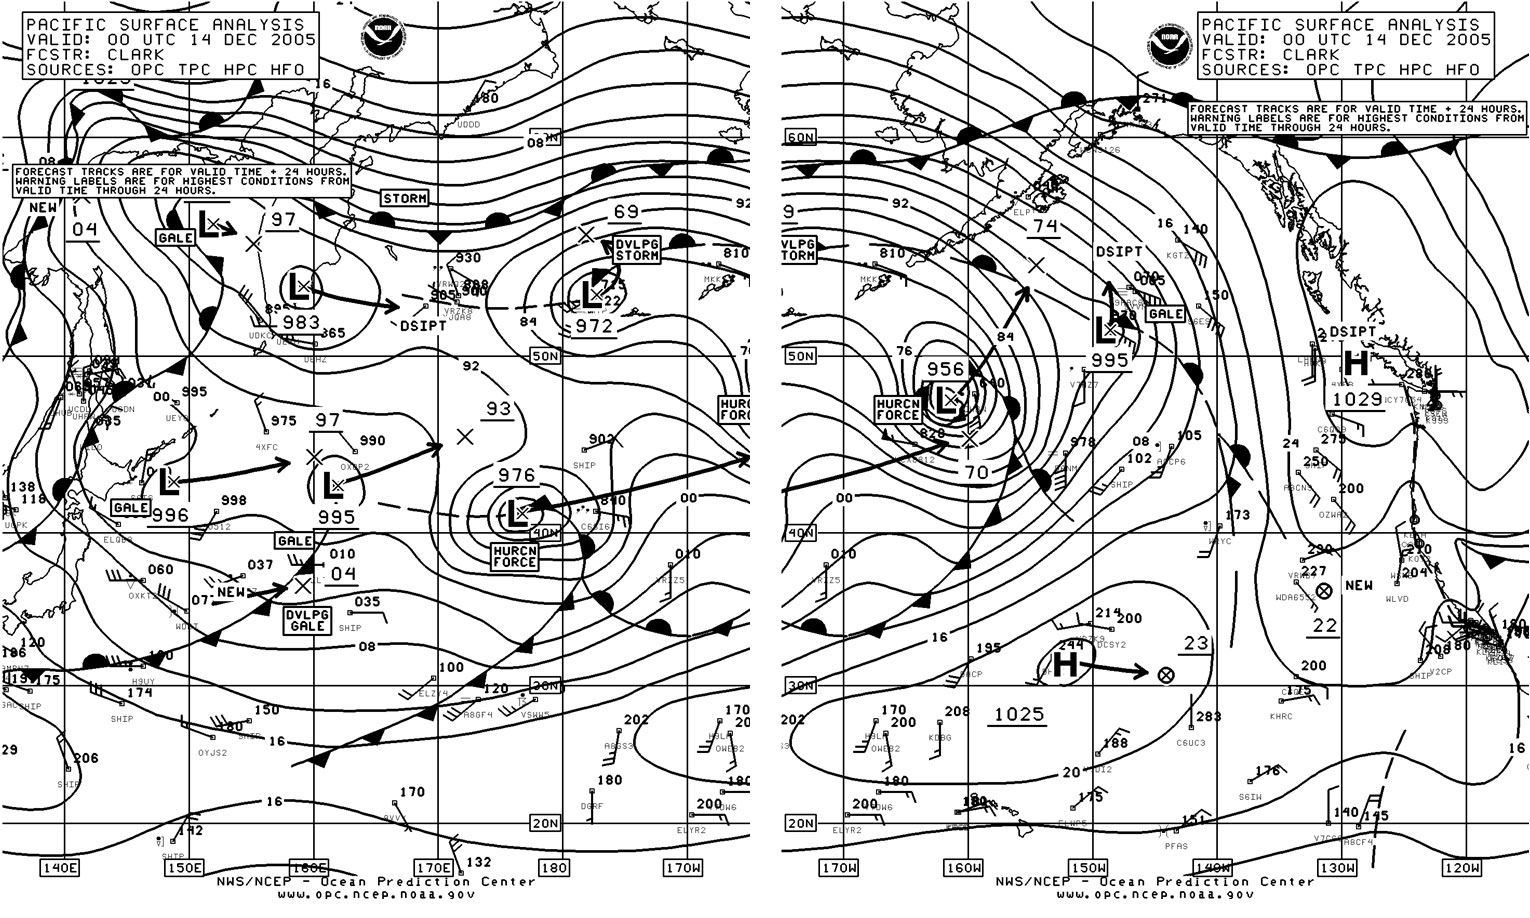
Figure 13. OPC North Pacific Surface Analysis charts (Parts 1 and 2) valid 0000 UTC December 14, 2005. This is another depiction of two hurricane-force storms occurring simultaneously, near maximum intensity.

Figure 14. High-resolution QuikScat scatterometer image of satellite-sensed winds around the eastern storm shown in the second part of Figure 13. The valid time of the pass is 1704 UTC December 13, 2005, or about seven hours prior to the valid time of the second part of Figure 13.
Image is courtesy of NOAA/NESDIS/ Office of Research and Applications.
Southeastern North Pacific Storm, December 18-20: This storm developed rapidly in the southeastern high seas waters, aided by a strong southern jet stream. Figure 15 shows this development. Some impressive ship reports are listed in Table 4. The system subsequently turned north and attained a lowest central pressure of 960 hPa near 46N 139W at 1200 UTC on the 20th. Weakening followed, with the low dissipating near the southern Alaska coast December 22.
| OBSERVATION | POSITION | DATE/TIME(UTC) | WIND(kt) | SEAS(m/ft) |
|---|---|---|---|---|
| Patmos Senator (ELTZ7) | 31N 150W 31.5N 150W 31N 149W 31N 148W |
19/0500 19/0800 19/1100 19/1400 |
W 55 NW 70 W 60 W 65 |
12.2/40 7.0/23 |
| Lurline (WLVD) | 30.4N 142W | 19/1800 | W 45 | 12.2/40 |
| Greenwich Maersk (MZIF7) | 36N 135.5W | 20/0000 | SW 55 | 9.5/31 |
| Dirch Maersk (OXQP2) | 38N 133W | 20/0000 | S 40 | 11.3/37 |
| Zim Texas (ELTY6) | 47N 126W | 20/1800 | S 40 | 9.0/30 |
| Table 3. Selected ship observations taken in the storm of December 18-20. | ||||
Western North Pacific Storms of December 21-26: The development of this cyclone is depicted in Figure 16 which covers a thirty-six hour period of initial rapid intensification. The central pressure lowered by 39 hPa in the twenty-four hour period ending at 1200 UTC on the 22nd. The storm maintained hurricane-force winds for a relatively long period, from 1200 UTC on the 22nd to 0600 UTC on the 24th. The strongest wind reported by a ship was west 55 kts from CSAV Ningbo (ELWP5) (32N 144E) at 1200 UTC December 22. The vessel OOCL Long Beach (VRY04) (37N 159E) reported west winds of 50 kts and 10.1 m seas (33 ft) at 0600 UTC on the 23rd. Another vessel, SHIP (53N 169E) encountered northeast winds of 45 kts and 11.3 m seas (37 ft). QuikScat scatterometer winds were available (not shown) from 1953 UTC December 22 and show a pattern similar to that shown with the October 21 storm (Figure 7) with highest wind on the southwest side, up to 75 kts. The storm deepened further to 945 hPa (50N 176E) at 0000 UTC December 24 before turning east along 50N and weakening, making it the deepest of the period in the North Pacific. Another weaker system followed this, passing east of northern Japan on the 25th and briefly developing hurricane-force winds near the southern Kurile Islands early on the 26th before stalling and then turning east on the 28th with a weakening trend.
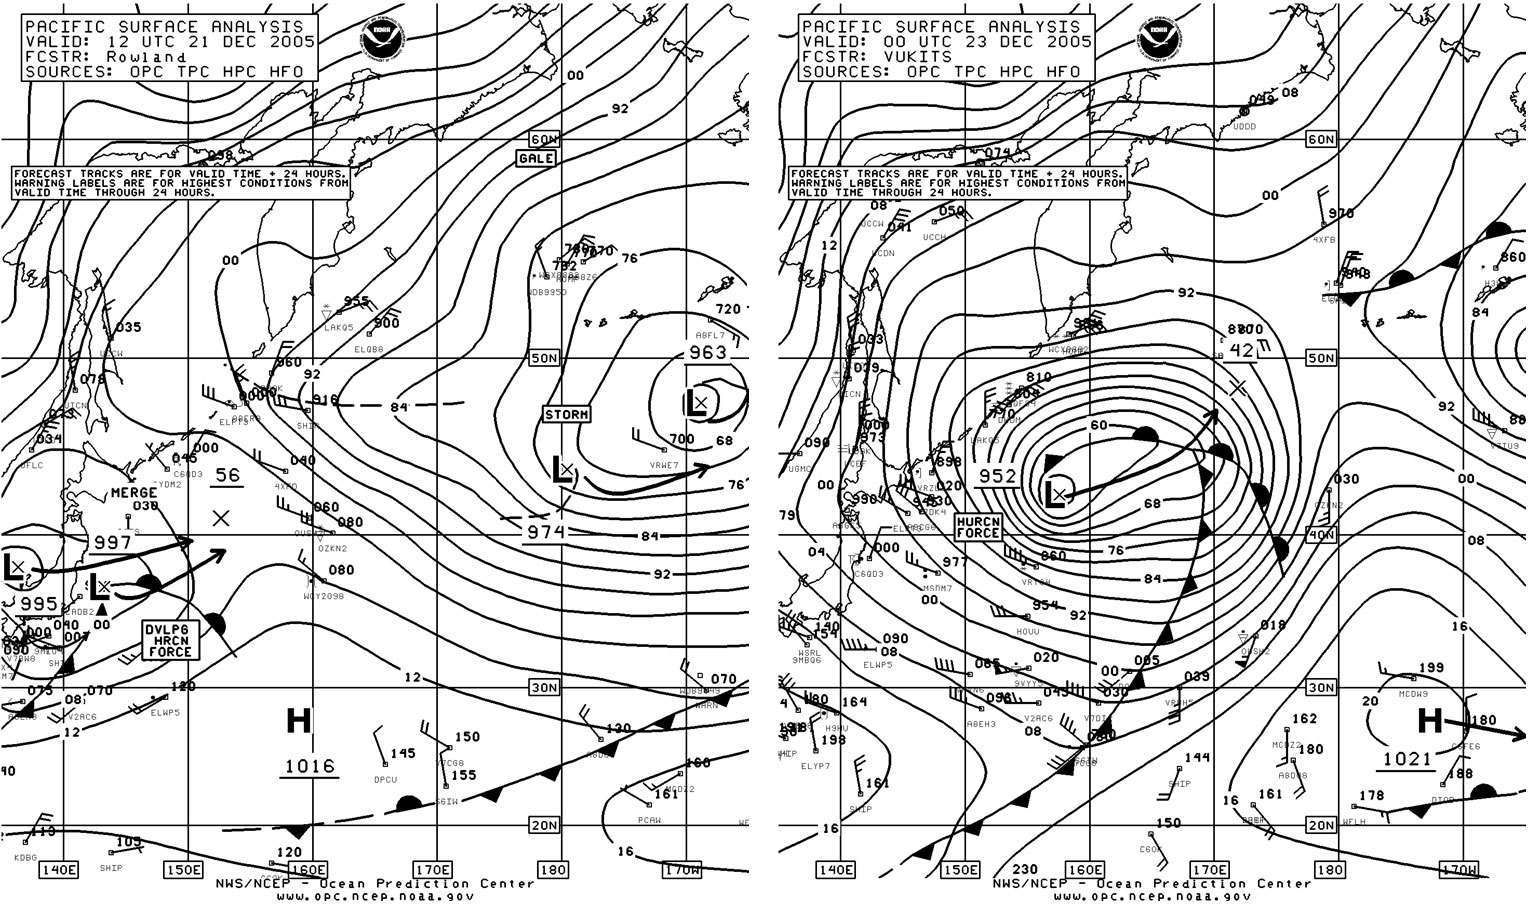
Figure 16. OPC North Pacific Surface Analysis charts (Part 2) valid 1200 UTC December 21 and 0000 UTC December 23, 2005.
References
- From Tropical Prediction Center website, http://www.nhc.noaa.gov/aboutsshs.shtml.
- From Tropical Prediction Center website, http://www.nhc.noaa.gov/archive/2005.
- Sienkiewicz, J. and Chesneau, L., Mariner's Guide to the 500-Mb Chart (Mariners Weather Log, Winter 1995).