Mean Circulation Highlights and Climate Anomalies September through December 2005
A. James Wagner, Senior Forecaster, Climate Operations Branch, Climate Prediction Center /NCEP/NWS/NOAA.The circulation pattern over the Northern Hemisphere during September and October was characterized by generally lower than normal 500 mb heights and sea level pressures at high latitudes, especially over northern Russia, the extreme northern Pacific, Alaska and the adjacent Arctic Ocean. Middle tropospheric heights were above normal over most of the eastern half of North America throughout most of the two-month period. An unusually large area of somewhat below normal SLP extending from the western Caribbean Sea and eastern Gulf of Mexico northeastward along the south Atlantic Coast and adjacent Atlantic Ocean reflects the tracks of many tropical and extratropical systems that gave rather wet weather to much of the eastern Seaboard during October. Lack of a corresponding reflection in the slightly above normal middle tropospheric heights shows the predominance of warmer than normal tropical air masses in this area. Over Europe, both middle tropospheric heights and SLP were well above normal, reflecting strongly anomalous anticyclonic conditions shifted across northern Europe. Over both oceans, stronger than normal westerlies at high latitudes and generally weaker than normal westerlies or stronger than normal easterlies at subtropical latitudes depicted the persistence of a pattern more typical of summer far into the fall season.
The generally above normal heights over eastern North America during September were associated with above normal temperatures and a continuation of summer-like conditions when tropical air masses continued their dominance. During October the average SLP showed that an anomalous westward extension of the Bermuda High was replaced by a break in the ridge that reflected the passage of numerous storms, both tropical and extratropical. The precipitation pattern responded to conditions in the lower atmosphere, as dry conditions that had prevailed over the Northeast in September were followed by a record wet October in some locations, with flooding in parts of New England. Temperatures were generally above normal over Alaska during both months, and most of the State was very wet in September with a strong southwesterly flow off the Bering Sea, where ridge conditions during most of the summer had built up anomalously warm sea surface temperatures. Generally drier than normal weather prevailed over eastern portions of the southern Great Plains and lower Mississippi Valley, continuing to intensify an area of drought that developed earlier in the year. Over the Pacific Northwest, long-term drought persisted through September but timely early fall rains moved into the area during October in response to a deepening trough just off the coast of British Columbia that shows noticeably on the two-month mean circulation patterns both at the surface and in the middle troposphere.
The Tropics
Conditions over the equatorial Pacific remained in a neutral ENSO state, but drifted slowly in the direction of a weak La Nina. This, along with the currently active phase of the interdecadal cycle of tropical storm activity that began in 1995, extensive areas of well above normal SSTs in the Atlantic-Caribbean Basin, and less than normal shear between winds in the lower and upper troposphere over the tropical Atlantic, all contributed to what was already a record number of named tropical storms, exhausting the available English names and requiring use of the Greek Alphabet by the end of October.
November-December 2005
During these late fall and early winter months, unusually fast zonal westerlies prevailed across the western and central Pacific at middle latitudes to the south of a large area of below normal 500 mb heights. By December, however, practically the entire northern Pacific Ocean was covered by below normal middle tropospheric heights and sea level pressures, with frequent vigorous, rapidly moving storms crossing the entire ocean basin. These storms were in part fueled by very cold air moving southward out of Siberia. In fact, the Arctic Oscillation became strongly negative during December, with well above normal heights and SLP dominating high latitudes in all sectors of the Northern Hemisphere, especially the Asian side. The two-month average again obscures important differences in the two months. In November, the high-latitude blocking was strongest over eastern Siberia, while in December blocking was centered over central Asia. Temperatures were unusually cold over Alaska during November under the influence of a trough east of the Siberian ridge, but in December milder conditions developed due to influences of maritime air from the active storms tracking across the Pacific and often ending in the Gulf of Alaska, as shown by the deeper than normal eastward-displaced Aleutian Low.
A trough prevailed over eastern North America during this period, but November temperatures averaged above normal over most of the country, when the trough was relatively weak and there was little cold air in Canada for it to bring southward into the U.S. The December pattern, however, with a strong trough over the eastern U.S. and above normal middle tropospheric heights over northern Canada favoring the formation of significant Arctic air masses at the surface, which were steered southeastward into the central and eastern U.S., dominates pattern the two-month mean map, showing an early start to winter over much of the eastern half of the country. Although not reflected in the two-month mean map, many of the vigorous Pacific storms continued on into the U.S., especially during December, causing gales and floods in coastal areas and bringing wet conditions well inland, removing the last vestiges of the long multi-year drought that had plagued interior sections of the Western States. To the east, much of the storm activity shifted from the Great Lakes area in November to the Atlantic Coast in December, and a number of early season snowstorms were observed. With northerly anomalous flow aloft and westerly anomalous flow at the surface, most of the precipitation missed the southern Great Plains and western Gulf area, which continued to suffer from an unusual intensifying winter drought that had begun to develop during the warmer part of the year.
Over the eastern part of the Atlantic Basin, the subtropical ridge was unusually strong and displaced north of its normal position, and higher than normal middle tropospheric heights and sea level pressures prevailed during most of this two-month period. Storms, may of them tropical or subtropical in nature, tended to stall over the eastern Atlantic at low latitudes in the vicinity of the Azores.
The Tropics
Conditions in the equatorial Pacific continued to move slowly towards a weak La Nina, with SSTs over the eastern and central equatorial Pacific becoming progressively colder relative to normal. By the end of the year, all of the equatorial Pacific east of the Date Line had below normal SSTs, and some of the atmospheric circulation indices were beginning to respond. However, the circulation at middle latitudes over the Pacific-North American (PNA) sector was more typical of what is often observed during El Nino, especially during December, with an abnormally deep southward-displaced Aleutian Low and a strong Pacific jet stream extending across most of the ocean. The Madden-Julian Oscillation (MJO) continued to be very inactive and for all practical purposes non-existent. Although no more hurricanes or tropical storms in the Atlantic sector had substantial effects on the U.S., during this period, several more formed during this two-month period in an area of low vertical wind shear and above normal SSTs over the eastern Atlantic. The final storm, named, culminating in Zeta, was the 27th named storm in a record-breaking season and briefly became a minimal hurricane over the eastern Atlantic and persisted into January of 2006.
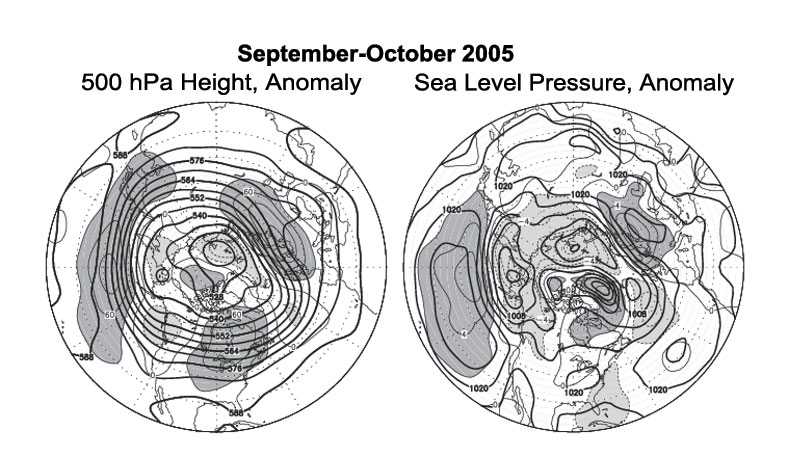
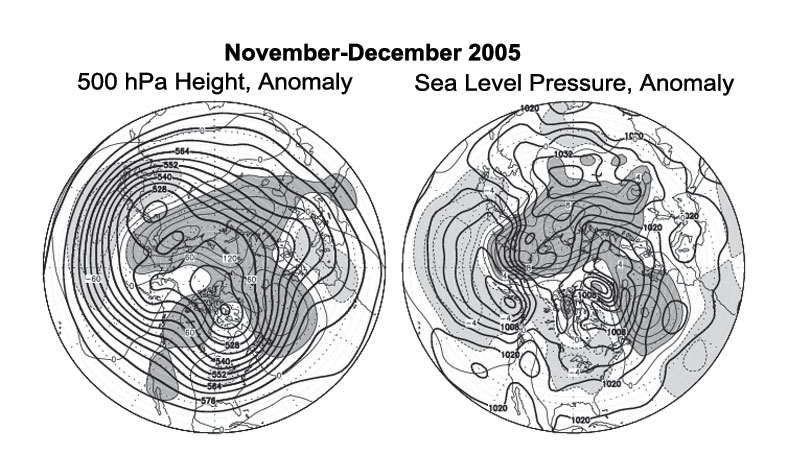
Figure legends and description of units:
The charts on the left shows the seasonal mean 500 hPa height contours at 60 m intervals in heavy solid lines, with alternate contours labeled in decameters (dm). Positive height anomalies are contoured in light solid lines at 30 m intervals, and light dashed lines show negative height anomalies. Areas of mean height anomalies more than 30 m above normal have heavy shading, and areas of mean height anomalies more than 30 m below normal have light shading.
The charts on the right show the seasonal mean sea level pressure (SLP) at 4 hPa intervals in heavy solid lines, labeled in mb at selected intervals. Anomalies of SLP are contoured in light lines at 2 hPa intervals, with dark shading and solid lines in areas more than 2 hPa above normal, and light shading with dashed lines in areas greater than 2 hPa below normal.