Marine Weather Review - North Atlantic Area September 2002 to February 2003
George P. Bancroft, Meteorologist
Ocean Prediction Center (OPC)
Introduction
The period from September to early October was typical of late summer and early fall, with the main storm track shifted north and much of the tropical activity of the 2002 Atlantic hurricane season concentrated in this period. Some of the tropical cyclones were Gulf of Mexico systems which did not directly affect OPC's marine area but later redeveloped as intense extratropical lows in the northwest Atlantic off Labrador. By late October, the storm track shifted south as a more winter-like pattern set in over the western North Atlantic. An El Niño-driven southern branch of the jet stream contributed to frequent development of lows off the U.S. East Coast during the remainder of the period. The most active period for significant weather events was December to February, when hurricane-force lows were most frequent.
Tropical Activity
Tropical Storm Edouard: Edouard affected the far southwestern OPC waters early in September and originally developed from a non-tropical low early on 2 September off northern Florida. Edouard drifted north and stalled about 150 nmi south of Cape Romain during a 24-hour period ending at 1800 UTC 3 September, before drifting southwest into northern Florida late on 5 September. The intensity briefly peaked at 55 kt for maximum sustained winds, with gusts to 65 kt as of the 1500 UTC 3 September advisory time when the center was stalled near OPC's forecast waters.
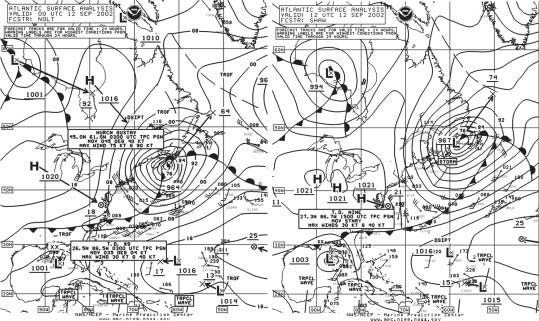
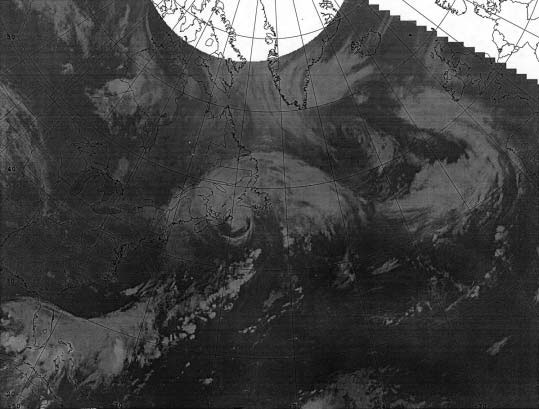
Hurricane Gustav: Gustav, the first hurricane of the 2002 Atlantic hurricane season, formed just south of OPC's waters early on 8 September as a subtropical depression, then moved northwest and strengthened into a subtropical storm upon crossing into OPC's waters near 72W. The system turned north and became a tropical storm right before passing just east of Cape Hatteras around mid-day 10 September, with maximum sustained winds of 50 kt with gusts to 60 kt. Gustav then turned northeast and intensified to a hurricane about 200 nmi south of Nantucket at 1500 UTC 11 September, with maximum sustained winds of 65 kt with gusts to 80 kt. Diamond Shoals reported a northwest wind of 48 kt with gusts to 56 kt at 0100 UTC 11 September after the center passed. NOAA Buoy 44004 (38.5N 70.5W) reported a pressure of 977.5 hPa at 1300 UTC 11 September as Gustav passed nearby. The buoy reported winds which increased to northwest 37 kt with gusts to 60 kt one hour later, and a peak gust of 62 kt at 1500 UTC 11 September. Seas were as high as 6.5 m (21 ft) one hour later at this buoy. At Buoy 44011 (41.1N 66.6W) the pressure bottomed out at 972.4 hPa at 1900 UTC 11 September, and winds reached 45 kt with gusts to 60 kt from the northwest, one hour later. The ship Tellus (WRYG) encountered southwest winds of 59 kt near 38N 68W at 1800 UTC 11 September. Gustav attained a maximum intensity of 80 kt with gusts to 95 kt at 2100 UTC 11 September before becoming extratropical over the island of Newfoundland at 1200 UTC 12 September (Figure 1). Figure 2 is an infrared satellite image of Gustav when it is about to become extratropical. Note that the system still has a circular central dense overcast typical of hurricanes but is also developing frontal structure. Extratropical Gustav subsequently moved north into the Davis Strait and weakened early on 15 September.
|
|
Tropical Storm Josephine: Tropical Depression 11 formed about 600 nmi east of Bermuda on the afternoon of 17 September and moved north-northeast, becoming Tropical Storm Josephine near 35N 52W twelve hours later. The cyclone developed maximum sustained winds of 50 kt with gusts to 60 kt about 500 nmi southeast of Cape Race early on the 19th before merging with a frontal system and becoming an extratropical gale, which moved to near Greenland on the 20th before weakening.
Hurricane Kyle: Kyle formed as a subtropical depression south of OPC's waters on 20 September and then drifted north-northeast to 31N 52W as a subtropical storm early on the 21st with maximum sustained winds of 40 kt with gusts to 50 kt. The cyclone then drifted northeast to near 33N 49.5W and became Tropical Storm Kyle at 2100 UTC 22 September, before looping back to the southwest and following a meandering course westward, occasionally dipping south of 31N. Kyle became a hurricane south of OPC's waters from 25-28 September but varied between weak tropical storm and depression strength; however, north of 31N Kyle made a final turn north into OPC's waters as a tropical storm near the Georgia coast early on 11 October, moved inland over North Carolina later that day, and then moved out into the Atlantic as an extratropical gale on 12 October. The ship C6QK (40N 69W) reported east winds of 40 kt northeast of Kyle at 1200 UTC 12 October. The remains of Kyle later merged with a developing strong cutoff low over the eastern Atlantic on 17 October. It is interesting to note that Kyle ranked third in longevity (22 days) among Atlantic tropical cyclones of record (See Reference 1).
Other Significant Events of the Period
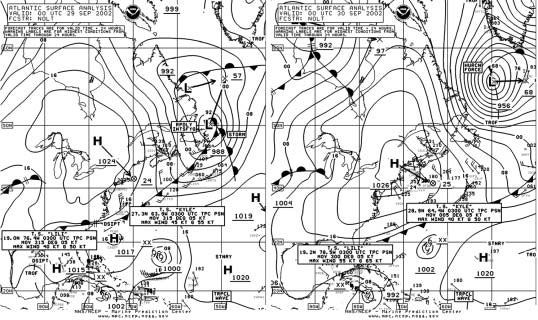
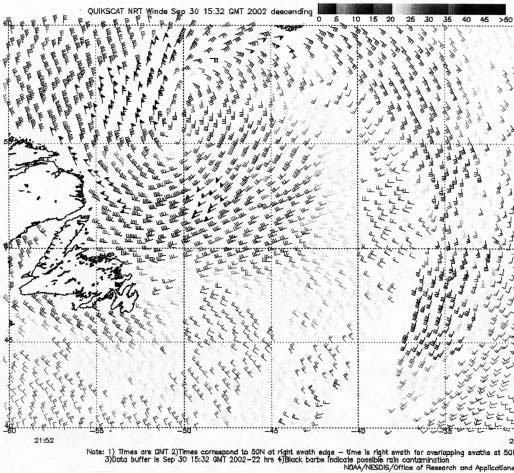
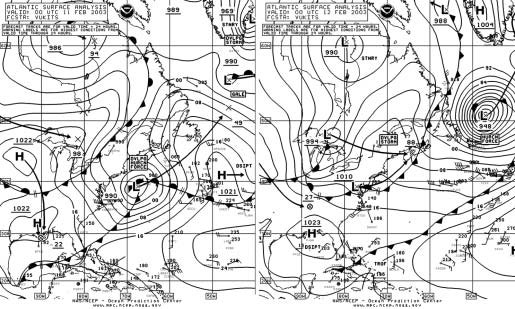
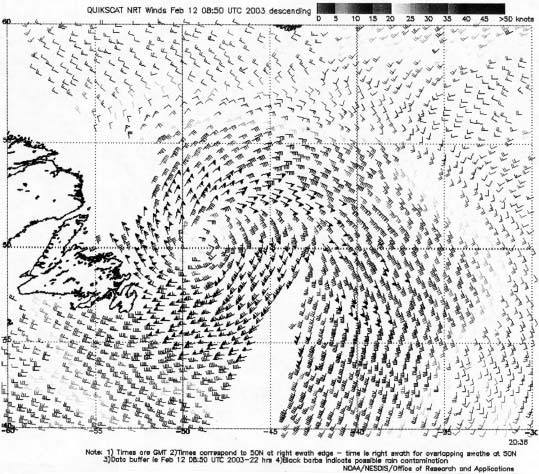
Northwest Atlantic Storm, late September: Tropical Storm Isidore moved ashore in Louisiana on 26 September, weakened over land, and then re-intensified after merging with a frontal zone. Figure 3 depicts the remains of Isidore rapidly intensifying after emerging from the Canadian Maritimes, becoming a hurricane force low 24 hours later, unseasonably intense for September. The system moved into an area lacking in ship and buoy data, but the scatterometer data in Figure 4 revealed winds to 65 kt on the back side. The valid time of the pass is less than three hours prior to the chart time of the second part of Figure 3. The low subsequently turned east and weakened to a gale about two days later.
|
Strong Cutoff Low, Central and Eastern Atlantic 17-20 October:
Blocking high pressure at high latitudes encouraged the development of a cutoff low in the central and eastern waters on 17 October, formed from the merger of a northern low and the remains of Kyle mentioned earlier. The combined system deepened to 962 hPa near 45N 23W early on the 20th before drifting east-northeast and beginning to weaken. OPC analyzed it as having hurricane-force strength briefly on the 19th, and the Discovery (GLNE) reported a southeast wind of 50 kt near 49N 12W at 1800 UTC 19 October. The system then moved northeast and into Norway on 23 October.
North Sea Storm 27 October: This low, one of a series to pass across the British Isles in middle to late October, resulted in numerous reports of storm force winds south of the rapidly-moving center in the North Sea on 27 October. The low was centered near 56N 6W at 975 hPa at 1200 UTC 27 October, when the ship PDTM reported a southwest wind of 75 kt near 53N 3E, while Polarstern (DBLK) observed southwest winds of 55 kt at 52N 3E. By 28 October the system moved into Denmark.
|
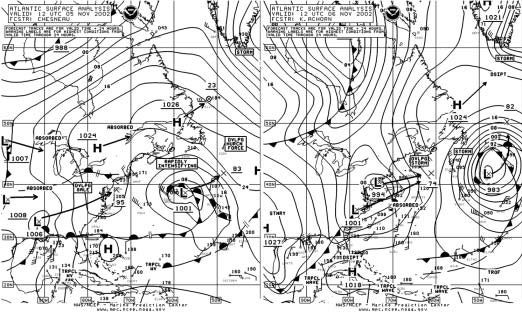
Figure 5. OPC North Atlantic Surface Analysis charts (Part 2) valid 1200 UTC 5 and 6 November 2002. |
North Atlantic Storm 5-9 November: Low pressure developed rapidly south of the Canadian Maritimes on the 5th and passed about 350 nmi southeast of Cape Race on 6 November with a 983-hPa central pressure, while another low moved off the New Jersey coast and intensified rapidly (see Figure 5). The second low developed a central pressure of 963 hPa when passing 150 nmi south of Cape Race at 1800 UTC 7 November. The second low absorbed the first late on the 8th to become a hurricane-force low about 360 nmi south of Cape Farewell, before stalling and slowly weakening. A QuikSCAT image taken at about that time showed a small area of hurricane-force winds, up to 75 kt, between the center and Cape Farewell. Among conventional data, the highest wind reported by a buoy was southeast 59 kt at 44602 (42.7N 47.8W) at 1500 UTC 7 November. Hibernia Platform (46.7N 48.7W) observed a northeast wind of 65 kt at 0900 UTC on 6 November, and buoy 44141 (42.1N 56.2W) observed seas up to 10.0 m (33 ft) at 1700 UTC 7 November.
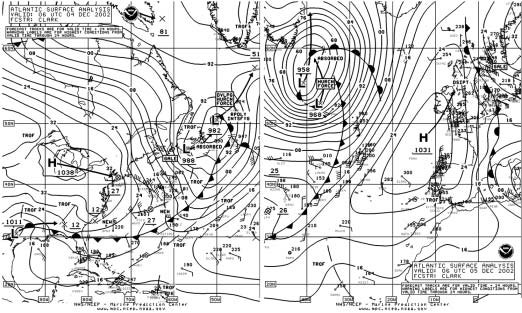
North Atlantic Storm 4-6 December: This development is illustrated in Figure 6 in which a complex area of low pressure moved off the Newfoundland coast at 0600 UTC on the 4th and became a hurricane-force low near 55N 40W 24 hours later. The ship PDHW (52N 34W) observed southwest winds of 70 kt at that time (plotted). The central pressure bottomed out at 944 hPa (27.88 inches) near 62N 36W 12 hours later, making this system the deepest of the 6-month period in the Atlantic. The cyclone then weakened while continuing to move north.
|
|
North Atlantic Storm 25-31 December: Figure 7 depicts the rapid early development of this low, with OPC analyzing it as a hurricane-force low only 24 hours after moving off the mid-Atlantic coast of the U.S. The Tanabata (WCZ5535) (35N 64W) observed southwest winds of 60 kt at 0600 UTC on 26 December. The buoy 44018 (41.3N 69.3W) reported northwest winds of 41 kt with gusts to 54 kt at 1100 UTC 26 December, and seas as high as 8 m (26 ft). Buoy 44029 (42.5N 70.6W) observed seas as high as 9.5 m (31 ft) in this event. The cyclone then moved northeast past Newfoundland and reached 50N 49W with 952-hPa central pressure 24 hours later before beginning to weaken and drift east. The low then became absorbed by another storm developing off the coast by month's end.
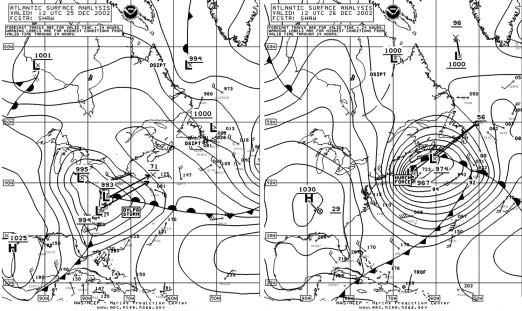 |
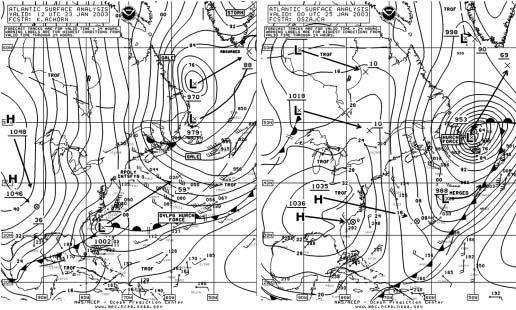
Figure 8. OPC North Atlantic Surface Analyses charts (Part 2) valid 1200 UTC 23 January and 0000 UTC 25 January 2003. |
North Atlantic Storm 23-27 January: Figure 8 shows the rapid development of this storm over a 36-hour period, the strongest in a series of lows to develop off the coast during this active month. A massive arctic high pressure area inland fed cold air into the system. It should be noted that the Canadian buoy 44140 broke loose in this storm; QuikSCAT data showed a maximum of 80 kt; and 44140 observed a peak wave of 81 ft (24.5 m and had a significant wave height increase from 13 ft (4.0 m) to 35 ft (10.7 m) in 2 hours (Reference 2). There is a wind report of southwest 85 kt at Hibernia Platform just southeast of the center in the second part of Figure 8. The system subsequently continued moving northeast and gradually weakened.
|
|
North Atlantic Storms of 7-12 February: Two fast moving rapidly-deepening lows moved off the mid-Atlantic coast of the U.S. and passed just east of Newfoundland. The second low was slightly deeper and is shown in Figure 9, attaining a lowest pressure of 948 hPa east of Newfoundland late on 11 February. The highest wind reported by a ship was a west wind of 75 kt from the Shenzhen Bay (MSDM7) (43N 55.6W) at 1500 UTC 8 February. The same ship observed seas as high as 19.8 m (65 ft) three hours later. At 0600 UTC 9 February, the vessel PDHW encountered west winds of 70 kt and 14.3-m seas (47 ft). Canadian Buoy 44141 (42.1N 56.2W) reported a west wind at an impressive 62 kt with gusts to 76 kt at 1300 UTC 8 February, and seas as high as 11 m (36 ft). Hibernia Platform 6038 (46.4N 48.4W) observed winds as high as 68 kt in the first storm and 96 kt in the second storm. Early on the 11th, the SeaLand Quality (KRNJ) (38N 60W) and the Atlantic Compass (SKUN) (43N 58W) reported west winds of 65 kt. Also on the 11th, winds reached 47 kt with gusts to 60 kt from the southwest, and seas were up to 13.5 m (44 ft) at Buoy 44139 (44.3N 57.4W). Figure 10 is a satellite image of the second system at maximum intensity, with a well-defined circulation of higher clouds wrapping around the center near 50N 48W. The QuikSCAT image of Figure 11 reveals numerous 70-kt barbs south of the center. The second low subsequently lifted north and weakened over Greenland on the 14 February.
|
|

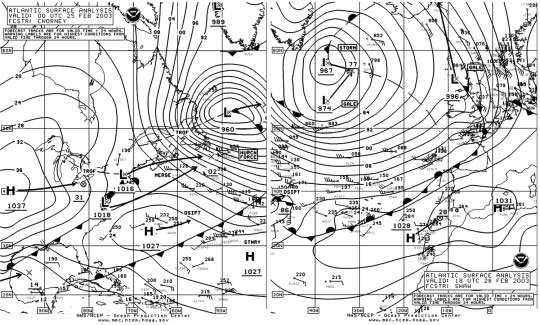
North Atlantic Storm 24-28 February: Although not among the deepest lows, this event was noteworthy as being prolonged, due to the slowing of the low-pressure system after it passed off the Newfoundland coast (see Figure 12. Platform VEP717 (46.7N 48.7W) reported west winds as high as 79 kt at 0900 UTC 25 February. C6QE7 (48N 46W) observed west winds of 65 kt as late as 1200 UTC on the 27th. The Atlantic Cartier (C6MS4) encountered west winds of 65 kt near 50N 38W at 1800 UTC on 28 February.
|
Figure 12. OPC North Atlantic Surface Analysis charts valid 0000 UTC 25 February (Part 2) and 1800 UTC 28 February (Part 1) 2003. |
References
1. Pasch, Richard J. and Lawrence, Miles B., Atlantic Hurricanes (Weatherwise, March/April 2003). (Return to Text)
2. Sienkiewicz, J., E-mail communication (January 28 and February 10, 2003). (Return to Text)
Page last modified: