Tropical Atlantic and Tropical East Pacific Areas
January - June 2003
Daniel P. Brown and Hugh D. Cobb III
Tropical Analysis and Forecast Branch,
Tropical Prediction Center
Miami, Florida
Atlantic, Caribbean and Gulf of Mexico:
In January, a large long-wave trough became established over the eastern United States. This trough allowed several strong cold fronts to move through the southeast United States and the Gulf of Mexico. Several of these fronts produced gale force winds over the Gulf of Mexico and western Atlantic. These cold fronts also brought unusually cold weather to the southeast United States and Florida. In February and early March, a more tranquil weather pattern occurred over the subtropical Atlantic and Gulf of Mexico, as there were no gale events south of 31 N. However, in late March, a strong cold front again produced gales over the Gulf of Mexico and northwest Caribbean Sea.
In April, a very unusual event occurred when the first Atlantic tropical storm of 2003 formed. Ana initially formed as an extra-tropical low between Bermuda and the eastern United States on 18 April. The extra-tropical low produced an area of gales mainly north of 31 N. The low remained nearly stationary on the 19th and became detached from any frontal systems on the 20th. Thunderstorm activity began forming near the center and the system was first classified as a subtropical storm early on the 21st. Ana eventually became a tropical storm on the 22th. Ana is the first April Atlantic tropical storm in history. A more detailed summary of Ana will be included in the yearly Atlantic Tropical Cyclone Review in the next edition of Mariner's Weather Log.
Western Atlantic Cold Fronts 1-2 January and 7-8 January: On the 1st of January, a strong low pressure center moved across the southeast United States and into the mid-Atlantic region. The trailing cold front moved rapidly across the eastern Gulf of Mexico, Florida and into the western Atlantic early on the 1st. Ahead of this front, the winds increased to gale force over portions of the western Atlantic shortly after 0600 UTC on the 1st. A QuikSCAT pass at 1059 UTC confirmed the presence of gale force winds as it detected south to southwest winds of 30 to 40KT north of 29 N west of 75 W. Sea heights of 5-meters (16 ft) were observed at buoy 41010 (near 29 N 78.5 W) at 1400 UTC. By 1800 UTC 1 January, the low was centered over Virginia, with the trailing front extending across eastern North Carolina. The front continued south across the western Atlantic through 31 N 77 W to south Florida. Another QuikSCAT pass at 2319 UTC indicated that the area of gale force winds extended eastward to 68 W. By 1200 UTC 2 January, the low pressure center had moved off the coast of New England. The trailing front extend through 31 N 70 W to the northern Bahamas. By this time winds decreased below gale force south of 31 N. Further north, the low produced heavy snowfall across Pennsylvania, New York, and portions of New England.
Another strong cold front moved off the southeast United States coast around 1200 UTC 6 January. Early on the 7th the front extended from 31 N 76 W across south central Florida. Strong high pressure began building southward behind the front. At 0600 UTC, winds increased to gale force north of 29 N west of the front. A 1004 UTC QuikSCAT pass detected gale force winds.
At 1800 UTC the front extended from near Bermuda across the central Bahamas to western Cuba. At the same time, the ship Liberty Star (call sign WCBP) encountered 35KT winds northwest of the front.
By 0000 UTC 8 January, the front reached from 31 N 62 W across the central Bahamas to central Cuba. At this time, winds decreased below gale force south of 31 N.
Gulf of Mexico and Western Atlantic Cold Fronts 16-17 January and 23-25 January: In mid to late January, two very strong cold fronts moved across the southeast United States and the Gulf of Mexico. The first cold front moved off the Texas coast shortly after 1200 UTC 16 January. Behind the front strong high pressure built southward, producing northerly gale force winds. At 0000 UTC 17 January, the front extended from extreme southeast Louisiana to near Tampico, Mexico. The ship Lykes Discoverer (call sign WGXO) observed northerly winds of 35KT off the coast of southeast Louisiana at 0600 UTC. Nearby, the C-man station at Southwest Pass, Louisiana (BURL1) reported 36 KT sustained winds. At 1200 UTC, the front extended from just north of Fort Myers, Florida to the Bay of Campeche. The ship Celebration (call sign H3GQ) encountered northerly winds of 35KT near 24 N 89 W. By 1800 UTC, the front extended from near 31 N 73 W in the western Atlantic, across the Straits of Florida to the Yucatan Peninsula. Shortly after this time, winds decreased below gale force over the Gulf of Mexico. However, a brief period of gales occurred over the western Atlantic north of 29 N northwest of the front until 0600 UTC 17 January. This front brought record cold weather to portions of the southeast United States and Florida.
The next strong cold front moved off the coast of Texas coast just before 1200 UTC 22 January. At 0000 UTC 23 January, the front extend from north Florida to the Texas-Mexico Border. As the front moved off the southeast U.S. coast a low pressure center developed rapidly along the front off the Georgia coastline. At 1200 UTC, the low deepened into a 1002 mb gale center near 32 N 75 W. The strong cold front extended southwest from the gale center across central Florida to near Veracruz, Mexico. At this time, strong high pressure began building southward, behind the front and gale center. The tight pressure gradient began producing gale force winds over the eastern Gulf of Mexico and western Atlantic northwest of the front. At 1800 UTC 23 January, the ship Tucano (call sign VRVP2) observed 40 kt westerly winds over the western Atlantic near 27 N 75 W. At 2000 UTC, buoy 41010 reported 34 kt winds with gusts to 42KT. Sea heights at the buoy built to 5.4-meters (18 ft) on 24 January. The Tucano and the Edyth L (call sign C6YC) both encountered 40KT winds at 0000 UTC 24 January. QuikSCAT data confirmed the ship observations when it detected a large area of 30 to 40KT winds north of 27 N between 68 W and 78 W.
At 0600 UTC 24 January, the gale center strengthened into a storm with hurricane force winds well north of 31 N. The trailing cold front extend through 31 N 62 W across central Cuba and the northwest Caribbean Sea. Two QuikSCAT passes between 0900 and 1200 UTC continued to detect 30 to 40KT winds over the western Atlantic north of 27 N. A visible satellite image from 1815 UTC 24 January (Figure 1) depicts the classic cold front draped across the Atlantic. Behind the front, cold air stratocumulus clouds covered the entire western Atlantic, northwest Caribbean, and much of the Gulf of Mexico. A 2145 UTC QuikSCAT pass continued to detect gale force winds north of 28 N west of the front to about 70 W.
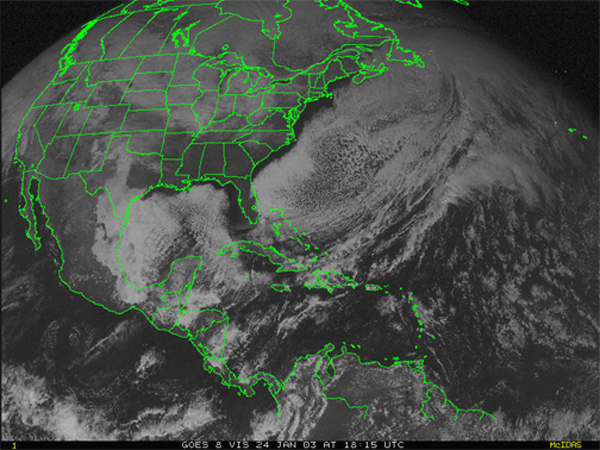 |
Figure 1. - GOES 8 visible image of the Atlantic cold front as 1815 UTC 24 January 2003. Note, the large area of stratocumulus colds that cover the Atlantic and Gulf of Mexico northwest of the front. |
At 0000 UTC 25 January, the front extend from 31 N 56 W across Hispaniola to the southwest Caribbean Sea. By 1800 UTC 25 January, winds finally decreased below gale force over the Atlantic south of 31 N. Not only did this system produce a large area of gales in the Atlantic, it also brought significant snowfall to much of the Carolinas, including the Outer Banks of North Carolina. The cold front brought some of the coldest temperatures to Florida since the Christmas freeze of 1989. Freezing temperatures were observed over most of the state including the interior sections of south Florida on the morning of the 24th.
Gulf of Mexico and NW Caribbean Strong Cold Front 29-31 March: A slow moving cold front moved off the Texas coast shortly before 1800 UTC 28 March. At 0000 UTC 29 March, the front extended from the Louisiana coast southwest to near Tampico, Mexico. Strong high pressure began building southward across Texas and the western Gulf behind the front.
Northerly gale force winds began blowing along the coast of Mexico shortly after 0600 UTC 29 March. An 1152 UTC QuikSCAT pass detected 30 to 35 KT winds south of 26 N west of 95 W. At 0000 UTC 30 March, the front extended from the Florida panhandle across the central Gulf of Mexico to the eastern Bay of Campeche. At 1200 UTC 30 March, the front reached from just north of Tampa to the northeast Yucatan Peninsula. A strong 1035-hPa high pressure center moved south into northeastern Mexico. The tight pressure gradient continued to produce gale force winds over most of the southern Gulf. Over the south-central gulf, two ships, the Nedlloyd Holland (call sign KRHX) and C6FM7 (name unknown), encountered 35KT winds at 1200 UTC 30 March. By 0000 UTC 31 March, the front extended across the extreme western Atlantic and western Cuba to near the Gulf of Honduras. Winds decreased below gale force over the Gulf of Mexico waters as northwesterly winds over the Yucatan Channel and the northwestern Caribbean Sea increased to 30 to 40KT.
A timely QuikSCAT pass from near 0000 UTC 31 March detected the presence of gale force winds. It is unusual for gales to occur in the northwestern Caribbean. However, during this event the strong high moved very far south into northern Mexico. At 0600 UTC and 1200 UTC, the ship Edyth L observed 40 kt winds off the coast of Belize. By 1800 UTC 31 March, the front extended across the Caribbean from eastern Cuba across Jamaica to Costa Rica. By this time, winds decreased below gale force over the Caribbean. However, strong north to northeast winds continued to blow across much of the western Caribbean through 2 April.
Southwest Gulf of Mexico Cold Front 8-9 April: Another strong cold front moved off the Texas coast just before 1200 UTC 8 April. High pressure began building southward behind the front and winds increased to gale force along the coast of Mexico late on the 8th. During this event, the high pressure center was much weaker than during the event in late March.
Therefore, gale force winds were confined to the extreme southwestern Gulf of Mexico. By 0000 UTC 9 April, the front reached from the Florida panhandle to just southeast of Veracruz. A 0106 UTC QuikSCAT pass detected 30 to 35 kt northerly winds south of 25 N west of 95 W. At 1200 UTC, the ship Pacific Explorer (call sign V7DN3) encountered 40KT winds just off the coast of Veracruz. By 0000 UTC 10 April, high pressure settled over the western Gulf and winds decreased below gale force.
Central Atlantic Gale 21-23 May: Late on 20 May, a cold front became stationary across the central and western Atlantic along 31 N 48 W - 25 N 63 W to the northern Bahamas. Early on the 21st, low pressure began forming on the front near 28 N 56 W. The low quickly strengthened and became a 1004 mb gale center near 30 N 54 W at 1800 UTC. A 2129 UTC QuikSCAT pass (Figure 2) detected gale force winds, mainly over the northeast semicircle.
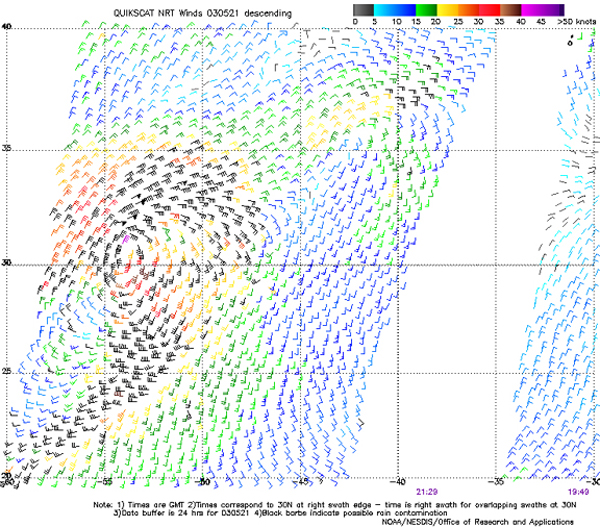 |
Figure 2. - QuikSCAT Image. |
At 0000 UTC 22 May, the gale became a storm near 31 N 53 W. However, the storm force winds remained north of 31 N. A cold front was analyzed from the storm center, south-southwest to near Puerto Rico. At this time, southwesterly gales developed east of the front and north of 28 N. These gales were confirmed by a 0843 UTC QuikSCAT pass. Gales also continued along 31 N within 240 NM west of the center. At 1200 UTC 22 May, the storm center was located well north of 31 N with the front trailing through 31 N49 W to northeast of the Leeward Islands. Gale force winds continued east of the front north of 29 N until 1800 UTC. Throughout the duration of this event there were very few ship observations near the storm center. The lack of ship data at the time suggested that most ships avoided the area due to the forecast of gale and storm winds.
Eastern North Pacific
The eastern North Pacific was affected by nine Gulf of Tehuantepec gale and storm events in the January through June 2003 (Table 1) period. Four were storm events. In addition, a gale center moving across the Pacific along 30N toward California spread gale force winds across the northern sections of the forecast area from 9-11 February. The storm of 30 March - 2 April was the strongest wind event ever observed in the Gulf of Tehuantepec since the advent of QuikSCAT data with hurricane force winds noted on the 2358 UTC 30 March QuikSCAT pass. See the significant storm event section below for additional details on this event. This event eclipsed the 17-19 November 2002 event discussed in the previous issue of Mariner's Weather Log. Overall, during the fall and winter Tehuantepec season of 2002-2003 (November-April) there were 20 gale and storm events. This is significantly higher than the average (15) over the past four years (Cobb et al, 2003).
Gulf of Tehuantepic Gale and Storm Events
January - June, 2003
| Event | Beginning | Ending |
| 1 | 0000 UTC 03 January | 1200 UTC 05 January |
| 2* | 0600 UTC 07 January | 1200 UTC 09 January |
| 3* | 1800 UTC 13 January | 1500 UTC 20 January |
| 4 | 0000 UTC 24 January | 1200 UTC 25 January |
| 5 | 1200 UTC 27 January | 0000 UTC 29 January |
| 6 | 0000 UTC 08 February | 0000 UTC 09 February |
| 7 | 0000 UTC 17 February | 1200 UTC 18 February |
| 8* | 0000 UTC 30 March | 0600 UTC 02 April |
| 9 | 1200 UTC 09 April | 0000 UTC 11 April |
Table 1. Estimated beginning and ending times for Gulf of Tehuantepec gale and storm events from January through June, 2003. Storm events are denoted with an asterisk(*).
The overall synoptic pattern featured a broad trough across the eastern half of the United States with frequent surges of polar and arctic air into the Gulf of Mexico and Bay of Campeche in January and early February. The pattern relaxed in late February and most of March. In late March a very deep trough for early spring moved across the southern United States bringing near record high pressures across northern Mexico.
Despite the number of cold air outbreaks, there were only a few instances where highs with pressures of 1035-hPa or greater moving out of the plains into the southern United States. A notable exception was during the severe storm event on 30 March where unusually strong high pressure extended well south into Mexico (Figure 3).
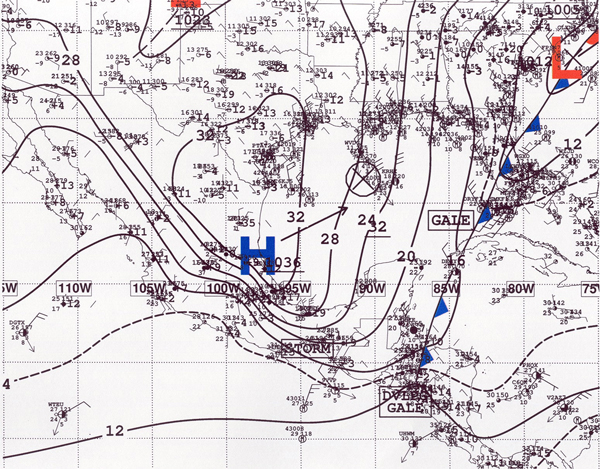 |
Figure 3 - Surface Analysis from 1800 UTC 30 March 2003 depicting 1036 millibar surface High over Tampico, Mexico with very tight pressure gradient across the Isthmus of Tehuantepec 6 hours before the onset of hurricane force winds in the Gulf of Tehuantepec. |
Gulf of Tehuantepec Storm Event 31 March - 2 April 2003: The hurricane force storm event of 30 March-1 April 2003 stands as the strongest Tehuantepec event observed since the advent of QuikSCAT data. The storm event began at 0000 UTC 30 March and lasted until 1200 UTC 1 April. A very sharp mid-to upper-level trough moved across the Central United States around 0000 UTC 30 March and was amplifying as it moved eastward, digging well into the Gulf of Mexico between 1200 UTC 30 March and 0000 UTC 31 March. The associated strong surface anticyclone moved from the central plains southward into northern Mexico by 1200 UTC 30 March with a central pressure of 1035 mb. This was one of the strongest anticyclones to move into Mexico. At 1800 UTC 30 March the anticyclone strengthened slightly to 1036 mb while located near Tampico, Mexico. Surface pressure rises of 25-hPa were common across the western Gulf of Mexico (Figure 4). At 0000 UTC a pressure gradient of 17-hPa across the Isthmus of Tehuantepec and Chevalis Pass resulted in hurricane force gap winds in the Gulf of Tehuantepec as indicated by a 2358 UTC 30 March QuikSCAT pass. QuikSCAT indicated a large area of 50 to 60-kt winds with a 65KT wind at the entrance of the Gulf of Tehuantepec. 18 hours later, the ship Stuttgart Express (call sign DGBE) reported NE winds of 60 kt and seas of 7-meters (23 ft) while located near 14.7 N 96.2 W.
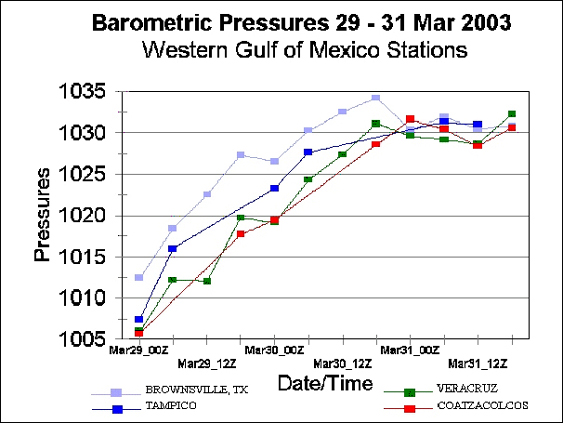 |
Figure 4 - Barometric Pressures 29 - 31 Mar 2003 |
Additional Gulf of Tehuantepec Events: The first three Gulf of Tehuantepec events occurred within the first two weeks of January and all attained storm intensity. The first event began at 0000 UTC 3 January and lasted until 1200 UTC 5 January. A QuikSCAT pass at 1142 UTC 3 January indicated 40 to 45 KT winds in the Gulf of Tehuantepec with a 50KT flag at the entrance of the Gulf. Another pass at 2348 UTC the same day indicated an expansion of the area of 50KT winds to include most of the Gulf of Tehuantepec. The ship Sea-Land Racer (call sign V7AP8) located near 13.5 N 94.5 W reported NNE winds of 35 KT and 4-meters (13 ft) seas at 1800 UTC 3 January. Another ship, the Skauboard (call sign LACF5) located near 14.5 N 96.2 W, reported northerly winds of 30KT and 5-meters (18 ft) seas at 0600 UTC 4 January.
The second event began at 0600 UTC 7 January and lasted until 0600 UTC 9 January. This event was considered the strongest of the three. A QuikSCAT pass, at 2345 UTC 7 January, once again indicated 45 to 50 kt storm force winds in the Gulf of Tehuantepec. There were several ship reports of storm force winds associated with this event. The ship Zim-Iberia (call sign 4XFP) located near 13.8 N 94.0 W reported northerly winds of 30KT and 4- meters (13 ft) seas at 0600 UTC 7 January.At 1200 UTC 7 January the same ship while located near 14.5 N 95.7 W reported northeast winds of 50KT and 6 meter (20 ft) seas.
The ship Overseas Joyce (call sign WUQL) reported north-northeast winds of 60KT and seas of 5-meters (18 ft) at 0000 UTC 8 January.
The final event in this series began at 1800 UTC 13 January and lasted nearly a week until 1200 UTC 20 January. This was one of the longest period of gale and storm force winds observed in the Gulf of Tehuantepec and coincided with an extended period of very cold temperatures across the southeastern United States. Gale force winds were observed on a number of QuikSCAT passes in this time period. Storm force winds were observed only on the 1159 UTC 14 January and 0015 UTC 15 January QuikSCAT passes. At 1800 UTC 16 January the ship Chevron Nagasaki (call sign C6FD6) located near 15.0 N 95.4 W reported northeast winds of 35KT and seas of 3.5-meters (11 ft). Another ship, the APL Turquoise (call sign 9VVY) located near 12.5 N 96.0 W reported northeast winds of 35KT and seas of 4.5-meters (15 ft) at 0000 UTC 18 January. At 1800 UTC 19 January the ship with call sign 3FEK9 (name unknown) located near 12.7 N 97.7 W reported northeast winds of 35KT and seas of 3 meters (10 ft).
The fourth event occurred within four days after the end of the extended third gale. The gale event began at 0000 UTC 24 January and ended at 1800 UTC 25 January. The ship Neptune Alexandrite (call sign 9VBA) located near 13.8 N 95.5 W reported near gale force east-northeast winds of 30 to 35KT but no sea heights were indicated.
The fifth event in the month of January began at 1200 UTC 27 January and lasted until 0000 UTC 29 January. A QuikSCAT pass at 2356 UTC 27 January indicated 30 to 35KT winds in the Gulf of Tehuantepec. At 0600 UTC 28 January, the ship Saga Spray (call sign VRWW5) located near 15 N 100 W reported northeast winds of 30 to 35KT. At 1800 UTC 28 January the ship with call sign Z6HU6 (name unknown) located near 14.7 N 96.0 W reported east-northeast winds of 30 to 35KT and seas of 3-meters (10 ft).
The first event for the month of February began at 0000 UTC 8 February and lasted until 0000 UTC 9 February. At 1800 UTC 8 February the ship Super Servant 3 (call sign PJPN) located near 14.5 N 95.8 W reported northeast winds of 30 to 35KT with a 2.5-meters (9 ft) sea.
The second event for the month of February began at 0000 UTC 17 February and lasted until 1200 UTC 18 February. A QuikSCAT pass from 0055 UTC 18 February indicated 30 to 35KT winds in the Gulf of Tehuantepec. There were no ship reports of gale or near gale force winds with this event.
The final event of this period began at 1200 UTC 9 April and lasted until 0000 UTC 11 April. A QuikSCAT pass at 0021 UTC 10 April indicated a large area of 40 to 45KT winds in the Gulf of Tehuantepec. There were no ship reports of winds of gale force or stronger associated with this event.
Southern California Gale 9-11 February: A very deep trough and associated low pressure area moved southward into the High Seas forecast area near 30 N135 W around 0000 UTC 9 February and moved east-southeastward to near 26 N130 W by 1200 UTC 11 February. Gale force winds were observed in the area for a period of 66 hours. The low/gale center was accompanied by 30 to 35KT winds and seas of 3 to 4.5-meters (10 to 15 ft) over the entire span of the event.
At 0600 UTC 9 February, the ship P&O Ned Lloyd Atacama (call sign ELZF7) located near 26.2 N 127.5 W or about 450 nm southeast of the Gale center reported SE winds of 30 to 35KT and 3 meters (10 ft) seas. At 0000 UTC 10 February several ships in the vicinity of the gale center reported near gale to gale force winds. The most notable was the ship OOCL Fedelity (call sign VRWG5) located near 25.0 N 123.7 W or about 400 nm east-southeast of the Gale center at that time. The ship reported ESE winds of 35KT and seas of 4-meters (15 ft). At 0600 UTC 10 February the NOAA ship Ka' Imimoana (call sign WTEU) located near 22 N121 W reported east-southeast winds of 35KT and seas 3.5 to 4.5-meters (12 to 15 ft). At 1200 UTC 10 February, the ship Lihue (call sign WTST) located near 26 N138 W reported northerly winds of 35KT and seas of 5-meters (17 ft). At 1800 UTC 10 February, the ship Sealand Navigator (call sign WPGK) located near 31 N133.7 W reported north-northeast winds of 35KT and seas of 4-meters (13 ft). At the same time there were at least 4 other ships reporting winds of 30 to 35KT or greater in the area from 25 N to 30 N between 135 W and 140 W. At 0000 UTC 11 February ship Lihue again reported gale force winds, this time near 35KT while located near 27.5 N134 W. Seas were 3.5-meters (11 ft).
References
Cobb, H.D. III, Brown, Daniel P. and Robert A. Molleda.
The use of QuikSCAT Imagery in the Diagnosis and Detection of Gulf of Tehuantepec Wind
Events 1999-2002. Preprints 83rd Annual AMS Meeting - 12th Conference on Satellite Meteorology and
Oceanography, p. 410.
Page last modified: