Season Severity by Three Variable Index: LAKI Area, Length of Season, Iceberg Population below 48° N
Cadet 1/c Victoria FutchDonald L. Murphy
Introduction
When International Ice Patrol (IIP) began to measure season severity, the main method was to count the number of icebergs crossing south of 48° N during the season. It is not clear why 48° N was chosen, but it is likely it was viewed as the latitude below which icebergs were considered a menace to the transatlantic mariners. The first time Ice Patrol took an interest in season severity measurements was in 1926 with the publication of Edward H. Iceberg Smiths,Summary of Iceberg Records in the North-West North Atlantic. In this publication, Iceberg Smith compiled actual iceberg counts of those crossing 48° N from 1880-1926. After this, the number of icebergs crossing 48° N became a standard statistic in IIPs annual bulletins. Over the years, this statistic has become the standard indicator of iceberg season severity.
However, the interpretation of the season severity measure has varied over the years. For example, Alfultis (1987) defined four iceberg-population severity classes starting at 300 icebergs or fewer for a light year and over 900 icebergs for an extreme year. Trivers (1994) modified the interpretation and defined a light year as one with 300 or fewer icebergs but defined an extreme year as 600 or more icebergs.
For the mariner, the number of icebergs present in the shipping lanes is not the only factor that indicates the severity of an iceberg season. The area enclosed by IIPs Limit of All Known Ice (LAKI), which defines the iceberg danger area, and the length of the iceberg season (LOS) are also very important factors to the mariners. If the iceberg population is widely distributed and persists over a long span of time, the mariner may also view the season as severe, even though there might not be an extraordinary number of icebergs south of 48° N. Each of the three factors costs the mariner money when they are forced to delay or divert due to ice. In an effort to create a more accurate description of season severity, a new index has been created using three variables: the area south of 48° N enclosed by LAKI, iceberg population south of 48° N and LOS.
Methods
The LAKI, LOS, and number of icebergs passing south of 48° N were taken from IIPs annual bulletins from 1975-2001. As part of Ice Patrols routine operations, LAKI is determined twice a day, every day during the entire ice season. It is a line that encompasses all known icebergs in the northwestern Atlantic Ocean, thus defining the iceberg danger area. A typical LAKI originates near the coast of Newfoundland, proceeds southeastward over the Grand Banks, and then northward to 52° N, where the Canadian Ice Service takes over the responsibility for defining the iceberg danger area.
The bulletins from 1981 to 2001 contain LAKI plots for the 15th and 30th (or last) day of each month. Before 1981, the LAKI plots were not consistently published on any particular day, but there were enough plots to produce a twice-a-month record. Data from 1975-1980 were taken from the day as close to the 15th or 30th of the month as possible. Exact dates are nominal, and the slight difference between dates in some months does not affect the results of the calculations. In the annual bulletins before 1975 the LAKI information was not as regular as the more recent bulletins and could not be used.
The geographic coordinates that form the LAKI were hand-measured from the plots in the bulletins and entered into the program created by Wright (2002). This program simply divides the area enclosed by the LAKI into sub-areas, calculates the area of each sub-area and sums the results. The computation is based on three assumptions: (1) that the area of interest is between the LAKI and 48° N latitude, (2) for each sub-area integrated, the average latitude was used to determine the east-west distance, and (3) the land area included in the calculation is negligible. Assumption (3) is required because the most common origin of the LAKI is near the southern or southwestern Newfoundland coast; thus, a part of Newfoundlands landmass becomes incorporated into the computed LAKI area. If the origin of the LAKI is far to the west on Newfoundland, it will result in a large LAKI area, therefore minimizing the effect of the land. If the origin is far to the east, the landmass enclosed by the LAKI will be small, again minimizing the error. So, although a portion of Newfoundland is in the result of every calculation, this error is not significant.
Before combining the three factors into the season severity index, each factor was normalized using the mean value for the 27-year record. The LAKI area was first averaged by month for each of the years (1975-2001) and then by year (all months during ice season). The mean value of the LOS and number of icebergs that passed south of 48° N were also computed. Finally, all three were combined to form the Normalized Season Severity Index (NSSI):
NSSI = LAKI Area/90,234 + LOS/143 + S48N/702
where LAKI area is the average area covered by the limits of all known ice during the ice season, LOS is the length of season, and S48° N is the iceberg population south of 48° N. The three denominators are the 27-year means for LAKI area, LOS, and icebergs south of 48° N.
Discussion
Normalized Season Severity Index (NSSI) Accuracy
An aggregate plot of all seasonal computations (Figure 1) shows the characteristic behavior of the LAKI area throughout a season, with a peak area in late spring. The plot was created with monthly LAKI areas from 1975-2001. The ideal normal curve season would open in early March, peak in late May, and dwindle down to a close in mid to late August. The NSSI uses an average length of season of 143 days to normalize the LOS data. The average season length allows an early March opening and late July ending of the ice season.
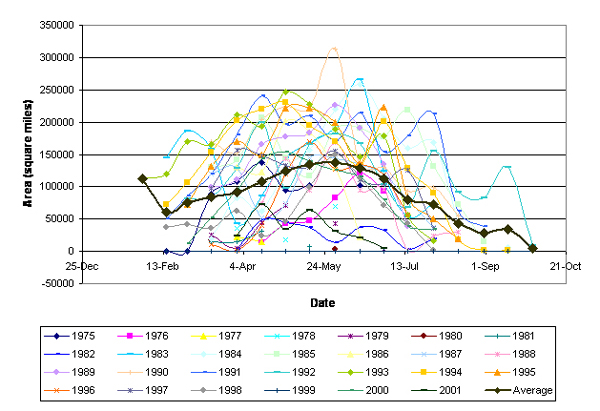 |
Figure 1. LAKI Area Compilation (1975-2001). |
Figure 2 shows the NSSI for all years from 1975 to 2001. The noticeable severe years by the NSSI were the years 1984, 1991 and 1993 with NSSI values of 5.72, 5.77 and 5.48, respectively. The least severe year was 1999 with an NSSI rating of 0.03. When compared to the previously used index of season severity, icebergs south of 48° N, the three most severe years of the study period were 1984, 1991, and 1994 with iceberg populations of 2202, 1974 and 1765 respectively. The lightest years were 1977, 1980 and 1999 with 22, 24 and 22 icebergs, respectively.
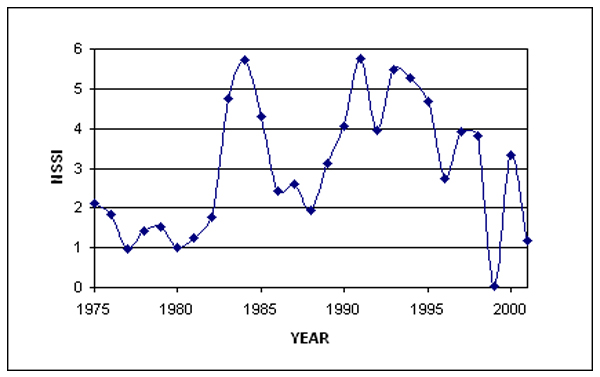 |
Figure 2. Normalized Season Severity Index (1975-2001). |
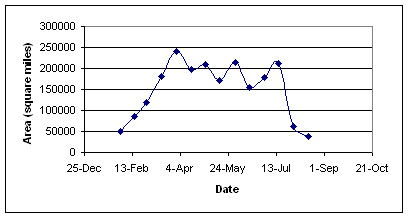
Although the number of icebergs that pass south of 48° N during a year plays a large role in the overall NSSI value, the additional factors of LAKI area and LOS can cause different relative rankings among season severities. Take the three most severe years by iceberg count and NSSI. By iceberg count alone, the most severe years are 1984, 1991, then 1994. Using the NSSI, the most severe year is 1991 followed by 1984, then 1993, thus reversing the positions of 1984 and 1991 as the year considered to be the worst iceberg year in IIPs history. Table 1 shows a detailed comparison between the 1984 and 1991 iceberg seasons. It shows the contributions of each of the three factors (LAKI area, LOS and iceberg count) to the NSSI and the ranking in each of the areas. The 1991 ice season had an average LAKI area of 151,234 nm2 (Figure 3) with a season lasting 183 days. Both of these factors contributed to its place as the most severe iceberg season during the study period severity of the 1991 season. In comparison, the year 1984 had 2,202 icebergs south of 48° N, an average LAKI area of 125,802 nm2 (Figure 4) and a season lasting 170 days.
| Year | LAKI area (nm2) | NSSI rating/rank (area) | Length of season | NSSI rating/rank (LOS) | Icebergs south of 48°N | NSSI rating/rank (icebergs) | Overall NSSI rating/rank |
| 1984 | 125,802 | 1.39 / 10 | 170 | 1.19 / 7 | 2202 | 3.14 / 1 | 5.72 / 2 |
| 1991 | 151,234 | 1.68 / 3 | 183 | 1.28 / 4 | 1974 | 2.81 / 2 | 5.77 / 1 |
Table 1. Differences in NSSI ratings between 1984 and 1991
Figures 3 and 4 show how the LAKI area changed throughout the 1991 and 1984 iceberg seasons, respectively. In the case of 1991, the LAKI area was near 200,000 nm2 for the period from early April through mid July. The LAKI area distribution for 1984 was close to the classic normal distribution with a peak in late May. Using the iceberg count alone, this effect is not considered, thus the severity of the season from the standpoint of the mariner was not represented. From the mariners viewpoint, the 1991 iceberg season was somewhat more severe than 1984 because the iceberg danger area was very large for a greater length of time, despite the fact that in 1984 there were over 200 more icebergs during the season.
|
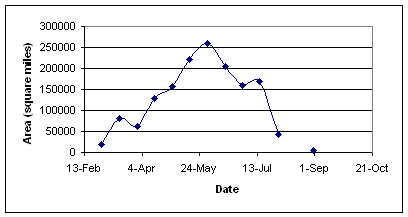 |
Figure 3. 1991 LAKI Area. | Figure 4. 1984 LAKI Area. |
Another example of the differences between the NSSI and iceberg count is the difference between the ranking of the years in 1997 and 1998 (Table 2). In 1998, the season had almost half of the average LAKI area of 1997. This made a large impact on the season severity, but was countered by the higher number of icebergs in the 1998 season as compared to 1997. By NSSI, they had very similar values, 3.83 and 3.71, respectively. By iceberg count alone, 1998 would have been considered to be a much more severe season than 1997 because it had over 30% more icebergs south of 48° N.
| Year | LAKI area | NSSI rating/rank (area) | Length of season | NSSI rating/rank (LOS) | Bergs south of 48° N | NSSI rating/rank (bergs) | Overall NSSI rating/rank |
| 1997 | 119,436 | 1.32 / 11 | 164 | 1.12 / 8 | 1011 | 1.44 / 10 | 3.83 / 10 |
| 1998 | 60,358 | 0.67 / 19 | 168 | 1.14 / 7 | 1380 | 1.96 / 6 | 3.71 / 9 |
Table 2: 1998 and 1997 comparison
NSSI Parameters
The parameters for the NSSI were created using a stem and leaf plot to find the 25th, median, 75th, and 90th percentiles for each variable in the NSSI. The values (Table 3) provided grounds to calculate the various levels of season severity. Below the 25th percentile is used for a light season. Moderate is from the 25th to the 75th percentile, a heavy season is 75th to 90th percentiles and an extreme season is over the 90th percentile.
| LAKI Area | Length of Season | S48N | |
| 25th % | 44,419 | 122 | 98 |
| Median | 111,041 | 152.5 | 309.5 |
| 75th % | 159,201 | 168 | 1135 |
| 90th % | 201,755 | 182.9 | 1757 |
Table 3. 1975-2001 Iceberg Percentiles
By entering the percentile variables into the Season Severity Index, the ratings given can be used to define an accurate severity to each year (Table 4). By using the averages of the data for each variable, the normal season severity was found to have an NSSI rating of 3.00 where the median had an NSSI rating of 2.69 showing a slight right skew in the data. This skew is due to a large quantity of data on the lower end of the NSSI spectrum.
| Normalized Season Severity Index | |
| Light | < 1.45 |
| Moderate | 1.45 4.25 |
| Heavy | 4.25 5.00 |
| Extreme | 5.00 |
Table 4. Final NSSI Rating Categories
The percentiles were used as guides to create the rankings for light, moderate, heavy, and extreme years, but they were not the deciding factor. The averages for each variable and frequency of occurrence were taken into account to create a more accurate representation of season severity.
Comparison of NSSI to Previous Standards
Most recently, Trivers (1994) updated the International Ice Patrols season severity classification based on the number of icebergs that passed south of 48° N during a season. Trivers based his data upon Alfultis (1987) results on season severity, but tried to take into account the difference in iceberg data collection methods. He examined the difference between the pre-SLAR (Side-Looking Airborne Radar) years and the SLAR years. In the pre-SLAR years, Trivers notes that an extreme year in the terms that Alfultis set are average under SLAR years. This difference could be the result of either better detection due to increased technology or natural variations in iceberg counts and distribution. If the increase is due to technology, then this may have an effect on the results of the NSSI, however Trivers found that the pre-SLAR years had not been undercounted. Trivers created new iceberg population severity classes as shown in Table 5. By comparing these severity classes by the data used for the NSSI, the severity classes used by Trivers seem to be low compared to the NSSI data. The average number of icebergs below 48° N was 702 for NSSI years whereas in Trivers the extreme year was classified as 600 plus icebergs. Using Trivers (1994) standards to classify the NSSI data, 13 of the 27 years would have been classified as extreme, whereas using NSSI rankings, only 4 years were classified as extreme.
| Trivers (1994) Iceberg Population Severity Classes | |
| Light | < 300 icebergs south of 48° N |
| Moderate | 300-600 icebergs south of 48° N |
| Extreme | 600 icebergs south of 48° N |
Table 5. Trivers (1994) Severity Classes
Conclusion
The NSSI rating combines the three most important variables into a single number that indicates of the severity of an iceberg season: LAKI area, LOS and the number of icebergs that passed south of 48° N. The previously used indicator, the number of icebergs south of 48° N, provided information only on the number of icebergs that entered the shipping lanes, without regard to how far they spread or how long they persisted. The NSSI focuses on the severity of an iceberg season from the standpoint of the transatlantic mariner, IIPs most important customer, because it represents the areal and temporal extent of the iceberg threat during a given season.
The NSSI is also a good indicator of the effort required for IIP to provide its services during a season. A season with a large number of icebergs concentrated near the Grand Banks is far less challenging than a season with a smaller number of widely distributed icebergs. The most important result of a wide iceberg distribution or a long season is the requirement for a greater number of aircraft hours needed to conduct reconnaissance. Thus, the NSSI can be used to compare iceberg seasons with differing iceberg populations in an effort to determine trends in IIPs efficiency.
There are some drawbacks to using the NSSI as an indicator of season severity. The most significant is that the information required to calculate the NSSI is not available for as long a period as the iceberg counts. The iceberg count extends to the late 1800s, while the NSSI can be computed with confidence back to 1975. In addition, many users of the season severity information are interested only in a specific area, so the iceberg count is a satisfactory indicator. These users include the offshore oil industry and other local marine interests.
References
Alfultis, M., 1987: Iceberg Populations South of 48N Since 1900, Report of the International Ice Patrol Services in the North Atlantic, Bulletin No. 73, Appendix B, pp. 52-62.
Smith, E., 1926: Summary of Iceberg Records In the North Western North Atlantic, 1880-1926, Report of the International Ice Patrol Services in the North Atlantic, Bulletin No. 15, pp 75-77.
Trivers, G., 1994: International Ice Patrols Iceberg Season Severity, Report of the International Ice Patrol Services in the North Atlantic, Bulletin No. 80, Appendix C, pp. 49-59.
Wright, Greg, 2002: LakiArea2 program
![]()
Page last modified: