MARINE WEATHER REVIEW - North Pacific Area
March to August 2003
By George P. Bancroft
Introduction
The weather of the period was most active in March with some variability due to occasional blocking high pressure over the eastern Pacific and over the eastern Bering Sea. Most of the lows tracked northeast off Japan with some turning north toward the Kamchatka Peninsula while others proceeded east-northeast across the Pacific toward the Gulf of Alaska. There were a few that became trapped under blocking high pressure and stalled or moved in from south of 30N as cutoff lows. There were fewer lows producing hurricane-force winds than in the North Atlantic, with all occurring west of 170W. In OPC's high seas area east of 160E and north of 30N there were two brief hurricane-force events in March and April with another event approaching hurricane-force off the U.S. West Coast in Mid-March. There were three western North Pacific tropical cyclones, two of which quickly became extratropical upon reaching the area of Japan in June and August and the other actually moving into the southwest high seas waters of OPC in May.
Tropical Activity
|
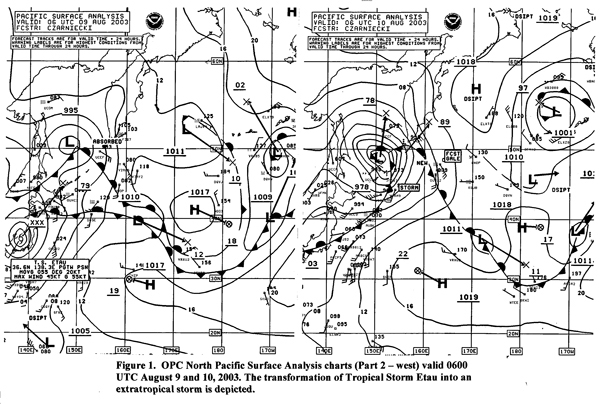
| Figure 1. OPC North Pacific Surface Analysis charts (Part 2 - west) valid 0600 UTC August 9 and 10, 2003. The transformation of Tropical Storm Etau into an extratropical storm is depicted. |
Typhoon Etau: Etau approached Japan from the southwest as a weakening typhoon early on August 8, and then moved over Japan near 35N 136E with maximum sustained winds of 65KT with gusts to 80KT at 0000 UTC August 9. At this time the Essen Express (DHEE) reported southwest winds of 45KT near 34N 137E. The cyclone weakened to a tropical storm six hours later, before becoming an extratropical gale near 41N 144E at 1800 UTC August 9. The system then re-intensified into a storm with a central pressure of 978-hPa (Figure 1) at 0600 UTC August 10 after absorbing the low north of the Kurile Islands (first part of Figure 1).
The Salvia Ace (3FIQ7) near 47N 153E reported south winds of 50KT at that time. This was the only report of storm-force winds in an extratropical low during the June-to-August period. The cyclone then moved to the west of the Kamchatka Peninsula and weakened, with a new center forming to the east in the Bering Sea by the 11th and tracking east into Alaska on the 13th.
Tropical Storm Soudelor: Soudelor crossed the southern Sea of Japan on June 19 and became an extratropical gale near 40N 138E at 0000 UTC June 20. The Arctic Sun (ELQB8) near 36N 143E reported southwest winds of 40 kt six hours later. The center moved east to 39N 162E by 1200 UTC on the 23rd before becoming blocked by a ridge to the north, and then turning west and weakening.
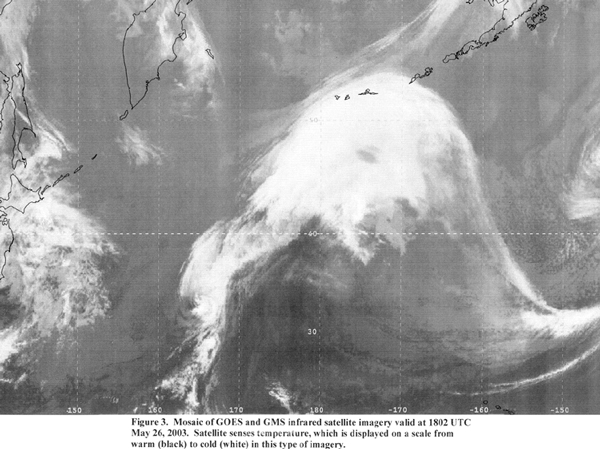
Typhoon Chan-Hom and Subsequent Extratropical Development: This typhoon appeared on OPC's oceanic surface charts early on May 23 near 16N 151E with maximum sustained winds of 115KT with gusts to 140KT, and maintained this intensity while moving northeast to 23N 155E at 0000 UTC May 25. Chan-Hom then began to weaken, becoming a tropical storm upon reaching the southwest corner of OPC's high seas area near 30N 160E at 0600 UTC May 25 with maximum sustained winds of 55 KT with gusts to 70KT. Meanwhile, a non-tropical low formed on a front to the north of Chan-Hom near 40N by this time. By 0000 UTC May 27 this low moved northeast to 45N 180 while Tropical Storm Chan-Hom approached the front, about to become extratropical six hours later (Figure 2). Figure 3 is an infrared satellite image taken six hours prior to the valid time of Figure 2, showing Chan-Hom still rather distinct near 32N 164E and approaching the frontal cloud band. Chan-Hom subsequently weakened as an extratropical low but may have contributed to the development of the low to the north (992-hPa) in Figure 2 by feeding tropical moisture into the developing storm prior to this.
|
|
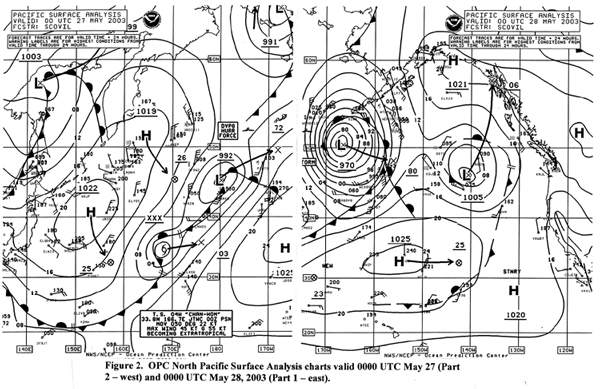
The northern low deepened by 22-hPa in the following twenty-four hours to become the 970-hPa storm in the second part of Figure 2, unseasonably strong for late May. Buoy 46072 (52N 172.1W) reported sustained north winds of 39KT and 5.0-meter seas (16 feet) at 2000 UTC May 27, a peak wind of 52KT one hour later, and maximum seas of 7.5 meters (25 feet) at 0500 UTC May 28. The Hatsu Eagle (ZNZH6) reported northeast winds of 40KT near 54N 171W at 0000 UTC May 28. At 0600 UTC May 28 the ship 3ETX6 (53N 158W) encountered east winds of 44KT. Six hours later the vessel 3FEY7 (46N 168W) reported northwest winds of 45KT and 10-meter seas (32 feet), the highest seas reported in this storm. A QuikSCAT image of the storm (Figure 4) reveals 50KT winds on the southwest side of the center. The system then slowly weakened while moving slowly east-southeast, before turning northeast into the Gulf of Alaska as weak low by the end of the month.
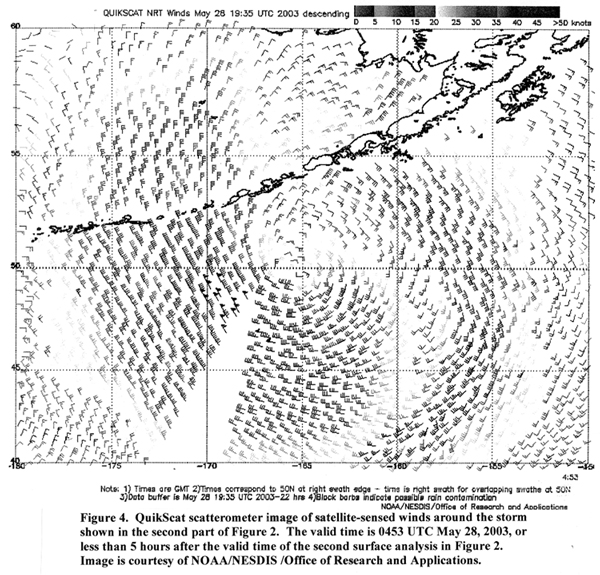 |
Figure 4. QuikSCAT scatteromter image of satellite-sensed winds around the storm shown in the second part of Figure 2. The valid time is 0453 UTC May 28, 2003, or less than 5 hours after the valid time of the second surface analysis in Figure 2. Image is courtesy of NOAA/NESDIS/Office of Research and Applications. |
Other Significant Events
Western North Pacific Storm, March 7-9: This system was perhaps the most significant of the period in terms of generated winds and seas, forming relatively far south and affecting a high-traffic area. Figure 5 depicts the developing storm coming from south of Japan by 0000 UTC March 7, and then deepening to 974-hPa in thirty-six hours. The maximum intensity of 972-hPa was reached six hours later near 40N 150E. Some ship observations in this storm are given on page 43.
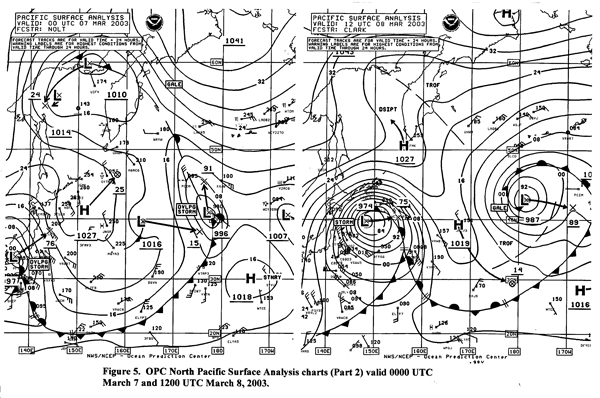 |
The storm system subsequently moved east-northeast and slowly weakened, becoming a large multi-centered gale in the central North Pacific on the 11th with the circulation covering much of the North Pacific on OPC's oceanic analysis area. This system would later redevelop near the west coast of the U.S. and Canada as described on the following page.
| SHIP | POSITION | DATE/TIME(UTC) | WIND | SEAS(m/ft) |
| Chastine Maersk (OZZB2) | 34N 147E | 7/1200 | SE 60 | |
| APL Korea (WCX8883) | 39N 149E | 7/1800 | SE 50 | 13.0/42 |
| APL Korea | 39N 145E | 8/0000 | SE 60 | 11.0/36 |
| APL Thailand (WCX8882) | 37N 146E | 8/0600 | W 55 | 10.5/35 |
| Marie Maersk (OULL2) | 42N 151E | 8/1200 | E 65 | 10.5/35 |
| APL Korea | 41N 155E | 8/1200 | ESE 60 | 11.5/38 |
| President Adams (WRYW) | 43N 147E | 8/1800 | N 50 | 13.0/42 |
| President Jackson (WRYC) | 37N 152E | 9/1200 | NW 50 | 15.0/49 |
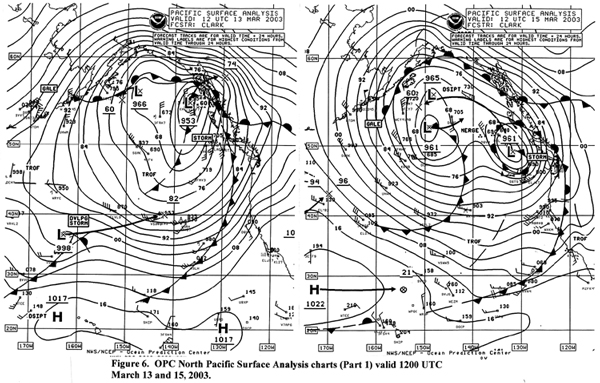
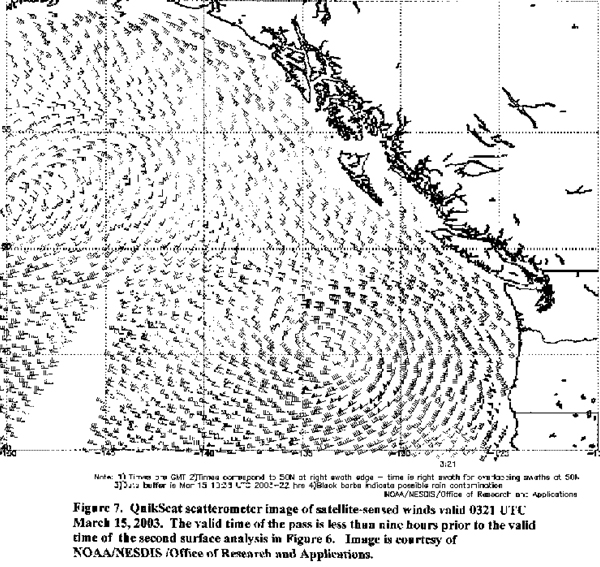
Eastern North Pacific Storms, March 12-16: The complex central Pacific system mentioned above redeveloped eastward to a new center near 46N 146W (974 mb) at 0600 UTC March 12 and deepened rapidly to 954 mb twelve hours later while tracking northeast, to reach a maximum intensity of 953 mb off Southeast Alaska at 1200 UTC March 13 (Figure 6, first part). This was the most intense low of the six-month period in the North Pacific, in terms of central pressure, with a broad circulation covering much of the eastern North Pacific. Twelve hours prior to the valid time of the first part of Figure 6, the Sea-Land Patriot (KHRF) reported north winds of 45KT and 10.5-meter seas (35 feet) near 50N 148W, while to the east the Westwood Borg (LAON4) encountered south winds of 35KT and 9.0-meter seas (29 feet) near 51N 134W. By 1200 UTC March 13 the stronger winds with this storm became concentrated near the coast ahead of the approaching cold front (Figure 6). The Horizon Tacoma (KGTY) reported a south wind of 60KT at 1800 UTC March 13. Buoy 46015 (42.7N 124.8W) had south winds of 45KT with gusts to 56KTat 0900 UTC March 13, and maximum seas 8.5 meters (28 feet) six hours later. To the north, Buoy 46050 (44.6N 124.5W) reported south winds of 41KT with gusts to 56KT and maximum seas of 10.0 meters (33 feet) at 1300 UTC March 13. Among C/MAN stations, Tatoosh Island reported the strongest wind, south 53KT with gusts to 69KT, at 1700 UTC March 13, and a peak gust of 70KT. The second part of Figure 6 shows the situation 48 hours later. While the 953-hPa low drifted north and weakened near the coast, the new developing storm near 37N 163W in the first part of Figure 6 moved east-northeast and deepened rapidly before turning north about 300 nm off the coast. The central pressure dropped 32-hPa to 961-hPa near 42N 137W in the twenty-four hour period ending at 1800 UTC March 14. At 1800 UTC March 14 the ship ELVL9 near 39N 139W reported west winds of 50KT, while Buoy 46006 (40.9N 137.5W) reported west winds at 50KT with gusts to 59KT. Seas were as high as 9.0 meters (29 feet) at this buoy six hours later.At 0000 UTC March 15 the APL Japan (43N 128W) reported south winds of 50KT. By 0400 UTC March 15 Buoy 46002 (42.5N 130.3W) developed southwest winds 39KT with gusts to 56KT with maximum seas of 11.0 meters (36 feet) coming two hours later. A QuikSCAT pass valid near this time (Figure 7) reveals winds of 50 to 60 kt south of the storm center and 50-kt south winds near the coast ahead of the front, shown inland in Figure 6. Near the coast, Buoy 46207 (50.9N 129.9W) reported southeast winds of 41KT with gusts to 60KT at 1400 UTC March 15 and maximum seas of 8.0 meters ( 26 feet). The central pressure of the storm bottomed out at 957hPa near 46N 132W six hours prior to passing west of Vancouver Island (second part of Figure 6) and turning more northwest. The center then merged with the gale to the west near 52N 151W on the 16th before lifting north and slowly weakening on the 17th.
|
|
North Pacific Storm, March 17-20: Low pressure developed east of Japan near 150E at 0600 UTC March 17 and rapidly intensified to 966hPa near 40N 169E at 0600 UTC March 18, a drop of 32hPa in a 24-hour period. The ship 4XFN (34N 173E) encountered southwest winds of 45KT and 9-meter seas (30 feet) at this time. OPC analyzed this system as a hurricane-force storm from 1200 to 1800 UTC on the 18th while the center was near 42N 177E. The Marit Maersk (OZFC2) reported west winds of 45KT near 38N 179E, about 250-hPa south of the center, at 0000 UTC March 19. The system then tracked northeast into southeast Alaska by late on the 21st and weakened.
Cutoff Southern Storm, March 26-28: Low pressure passing south of Japan late on the 21st tracked east until reaching 35N 163W on the 26th, where it stalled and intensified to 986 mb. Limited ship data showed winds of 40 to 45 kt, but seas were quite impressive. The Mahimahi (WHRN, near 31N 163W) reported west winds of 45KT and 13-meter seas (42 feet) at 0000 UTC March 27. At 1800 UTC March 27 the same ship near 31N 156W encountered west winds of 40KT and 12-meter seas (39 feet). The storm subsequently drifted northeast, then weakened and elongated into Gulf of Alaska on the 28th, before moving into Alaska on the 30th.
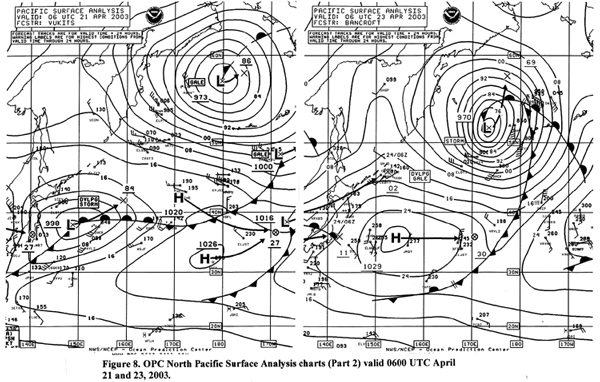 |
Figure 8. OPC North Pacific Surface Analysis charts (Part 2) valid 0600 UTC April 21 and 23, 2003. |
North Pacific/Bering Sea Storm, April 21-24: This system was the strongest of a series of lows to affect the North Pacific and Bering Sea after developing east or northeast of Japan. Figure 8 shows the development of this storm over a 48-hour period. The center developed a central pressure as low as 967-hPa in the central Bering Sea at 0000 UTC April 24, before starting a weakening trend and moving inland over Russia by the 25th.
At 1800 UTC April 22, the ship C6SI4 (48N 166E) reported north winds of 45 KT and 10.5-meter seas (34 feet). Twelve hours later the same vessel near 48N 171E (plotted in Figure 8) reported west winds of 60KT and seas of 16 meters (53 feet). The author cannot confirm the accuracy of the reported sea height, which was much higher than other reports. The ship ZNZH6 reported a southwest wind of 65KT and 7.5-meter seas (24 feet) near 52N 178W at 1800 UTC April 23. The same ship encountered southwest winds of 50KT and 10-meter seas (33 feet) near 52N 179W six hours later.
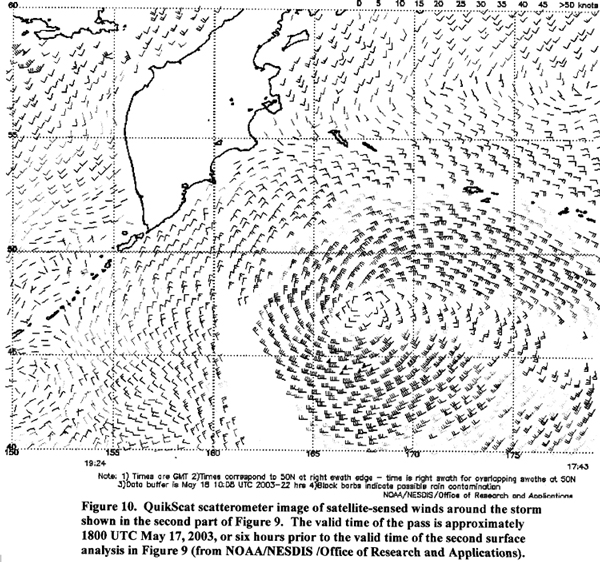
North Pacific Storm of May 17-18: The development of this storm is depicted in Figure 9 with the center tracking northeast off Japan before turning more east, just south of the central Aleutians. Limited ship data showed winds of no more than 35KT, but QuikSCAT data (Figure 10) valid about six hours prior to the valid time of the second part of Figure 9 reveals 50KT winds south of the center.
|
|
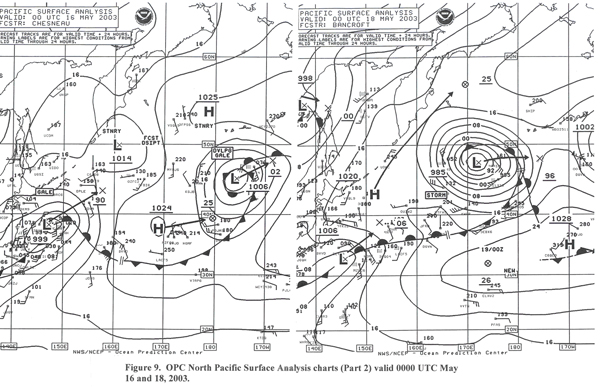
The ship ELXZ9 (45N 175W) reported 8-meter seas (26 feet) along with 30-kt west winds at 1800 UTC May 18. The system later weakened in the southern Gulf of Alaska late on the 21st.
References
1. Rippey, Brad, Weatherwatch (Weatherwise, July/August 2003)
2. Luke, Robert (NDBC), E-mail communication ("Deep Low Pressure Systems from MWL, September 13, 2002)
3. Sienkiewicz, J. and Chesneau, L., Mariner's Guide to the 500-Mb Chart (Mariners Weather Log, Winter 1995)
Page last modified: