Tabular Icebergs: Ice Season 2002 and the Past
LT Scott A. Stoermer, U.S. Coast GuardMr. Pip Rudkin, Provincial Airlines Limited
Introduction
Exceptionally large icebergs, commonly referred to as ice islands, came again into the public eye recently with the breaking loose of a portion the Antarctic ice sheet roughly ten times the size of the island of Manhattan (Dykstra, 2002). The glaciers of the North Atlantic, specifically along the western coast of Greenland, are not as conducive to very large iceberg generation as southern hemisphere ice fields, but do occasionally produce "Antarctic" size icebergs.
Ice Season 2002 (February 17, 2002 through July 15, 2002) saw some of the largest North Atlantic icebergs on recent record. These icebergs were actively tracked for a period of approximately two months during the summer, were photographed, and were even examined with side-scan sonar instruments. This brief report documents this season's sightings and provides some historical data and context for these phenomena.
Background
The International Ice Patrol has monitored icebergs that drift south along the coast of Labrador and onto the Grand Banks of Newfoundland region since the sinking of the Titanic in April of 1912. The Labrador Current carries the icebergs that calve, or break away, from glaciers in Greenland and northern Canada southward from Baffin Bay and Davis Strait. Several glaciers are capable of producing icebergs that end their journey on the Grand Banks. Specifically, the Ward Hunt ice shelf, the Humboldt Glacier, and the Petermann Glacier are likely sources of ice islands as the basin conditions seem to favor the production of large tabular icebergs (Robe, 1977).
As defined by Bowditch, an ice island is a piece of glacial ice that rises roughly 10 meters above the ocean's surface and has an overall thickness of about 50 meters. Often, ice islands will have a wave-like surface, appearing ribbed from the air. The surface area of an ice island can range from a few thousand square meters to hundreds of square nautical miles. Thusly, ice islands are not necessarily huge, in terms of surface area, but are unusually thin and flat-topped.
No matter the source, tracking and monitoring the danger posed by icebergs to transatlantic shipping interests is the responsibility of the International Ice Patrol. The offshore oil and gas industry has a keen interest in typical iceberg drift tracks as well as average iceberg mass and size distribution as more facilities, both fixed and mobile, are being moved onto the Grand Banks. Ice islands, due to their limited draft, pose a unique threat for the oil and gas industry as they can drift into much shallower water than other icebergs. This possibility increases the risk to current facilities as well as for the placement of new facilities, even as many move to locations on the Grand Banks. The sheer mass of an ice island makes its threat to a facility very great and limits many currently employed iceberg management techniques (i.e. towing). The needs and concerns of the oil industry and the responsibilities of the International Ice Patrol make the study of ice islands, similar to that tracked during the 2002 season very interesting.
One of the agencies that is highly involved in iceberg tracking for a number of different organizations is the Environmental Services division of Provincial Airlines Limited (PAL). PAL is a privately owned Canadian company that performs contract sea ice and iceberg reconnaissance for the Canadian Ice Service, Department of Fisheries and Oceans Canada (DFO) as well as private industry clientele. PAL, during the height of the ice season, engages in iceberg reconnaissance and management for the Grand Banks offshore oil and gas industry. Specifically, PAL tracks icebergs in the vicinity of oil and gas facilities and moves (tows) icebergs if necessary to eliminate the threat to platforms and rigs.
Ice Season 2002
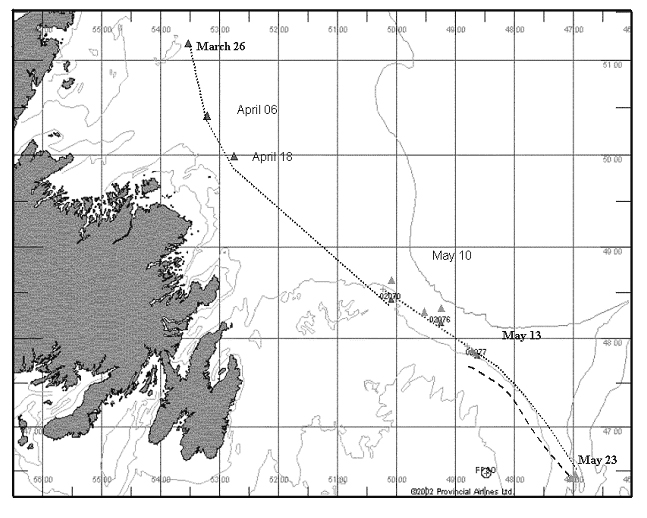 |
Figure 1. Sighting history of very large tabular iceberg as provided by Provincial Air Lines. |
During Ice Season 2002, the International Ice Patrol, Provincial Airlines Limited and the DFO
tracked a very large tabular iceberg during its journey from above 51°N until it was lost south
of 46°N at which point it had broken into a number of smaller pieces. The last recorded position
of the largest piece of the ice island was recorded on 27 May in position 46°18'N / 46°33'W.
Figure 1 graphically depicts the sighting/drift history of the ice island. While IIP was interested
in this ice island throughout its transit through the North Atlantic, of special importance is the
fact that this ice island crossed south of 48°N on about May 12, 2002, where it began to potentially
threaten the normal transatlantic shipping routes. A rough idea of the iceberg's drift speed can be
calculated from the approximate date and position that the ice island emerged from sea ice to its last
recorded position. Using the iceberg's position on April 18 (49°53'N / 52°45'W) and May 24
(46°18'N / 46°33'W) we can infer generally southeasterly drift at .3 knots (15 cm/s).
1
In situ measurements of iceberg size are not simple data to collect. In the case of the ice island,
size information was gathered during aerial observation and is therefore a best estimate. Given a
known speed over ground, PAL aircraft recorded the amount of time it look to fly from one edge of the
ice island to the other along its main axes, thus the sizes noted in Table 1. Table 1: Summary of sighting information. The size information available to IIP for the ice island on 27 May was gathered in a different,
more accurate way, producing the iceberg "growth" noted in the table. This ice expansion is most
probably the result of differing measurement techniques and is not terribly important except to note
that the largest piece of the ice island was still enormous as far south as 46°N. The size
measurements can be used to determine estimates of iceberg mass. Using the simple expression where l and w represent length and width respectively. Thickness is not listed in Table 1 and .9
represents a nominal value for the mass of 1 cubic meter of ice. Mass estimates are listed in Table 1.
The size measurements recorded on dates previous to May 10 were too crude to facilitate any mass
calculations. The extensive data collected throughout the rich history of IIP make it fairly easy and quite
interesting to consider the ice island of 2002 in relation to similar sightings of the past. To put
this iceberg into an historical framework, one must consider the reputable sightings recorded over
the period being discussed. Potentially there is not a source more reputable than the annually
produced report of the International Ice Observation and Ice Patrol Service in the North Atlantic
Ocean. This report documents the activities and findings of IIP for every year in which the Ice
Patrol service has been operated. An interesting and enlightening story regarding an ice island
occurred in May of 1945 and was reported in Bulletin No. 32: International Ice Observation and Ice
Patrol Service in the North Atlantic Ocean - Season of 1946: Several very large flat-topped bergs were reported, an example of which was the berg reported on the
27th in position 43°08'N / 49°18'W. This berg measured about 4,500 feet long, 3,300 feet wide,
and its above-water height was approximately 50 feet. Growlers and debris from the huge block of ice
were scattered over a radius of 5 miles. One of the last of the large North Atlantic convoys approached
this great floating mass while in dense fog of the 27th and in the confusion that followed 21 ships were
damaged. Two of these ships were reported to have suffered damage in collisions with ice and the remaining
19 to have suffered damage in collisions with each other.
All ships were able to proceed under their
own power and no loss of life resulted. The impact from the ice island, both figuratively and literally, was immediately felt as the Admiralty
and Chief of Naval Operations issued, on May 28, 1945, a joint order that abolished convoys and forced
all merchant ships to burn navigation lights at full brilliancy and not darken ship. Additionally, even though North Atlantic ice patrol services had not been officially re-established, the
United States Atlantic Fleet inaugurated twice-daily broadcasts from Argentia, Newfoundland at 0200 and
1400 GCT to shipping commencing on 8 June, 1945 as well as detailing a surface vessel patrol to the Grand
Bank region (GPO, 1947). While having not quite the same impact on transatlantic shipping as the ice island of 1945, the iceberg
of 2002 is interesting in its own right. The documentation maintained by IIP and the research completed
by Newell (1993) allow a fairly good picture of the ice island sightings since about 1912.2
For the purposes of his research, Newell (1993) defined ice islands in a much more specific manner than the
general characteristics noted in Bowditch (2002). Newell considered a flat-topped iceberg an ice island
if it was reported to be longer than 500 meters when north of 50ºN and one longer than 300 meters when
south of this latitude. The first documented sighting of an iceberg meeting these criteria was in 1911.
During June of that year, an iceberg more than two nautical miles (>3.7 km) long was noted off Southern
Labrador. This particular iceberg was stranded all season and rapidly diminished, deteriorating to
approximately .75 miles long by .25 miles wide and 60 ft high when it was photographed in July. Since
that date, documented sightings have been made quite often. Dramatically increasing with IIP and the
Canadian Ice Service patrols further north, very large iceberg sightings started increasing during after
the 1920's and with advent of aerial iceberg reconnaissance in 1946, the accuracy level of very large
iceberg reports has improved. Ice Season severity, as determined by the Ice Patrol, does not seem to be a good indicator of years
in which ice islands are sighted in the vicinity of the Grand Banks. Based on many years of data,
season severity indicators were developed by Trivers (1994) and defined as mild, moderate and extreme
based on length of ice season and the count of icebergs crossing south of 48°N. Extreme years, or
those with more than 600 icebergs crossing 48°N and/or lasting more than 180 days, are not highly
correlated with the sighting of very large icebergs. This position is further supported by Newell
(1993), where he mentions that a very large iceberg could potentially have a dramatic effect on the
iceberg population on the Grand Banks if it were to break up. If one considers that a 3 km long by
1.5 km wide iceberg has a mass on the order of 100 million tons and a "standard" medium iceberg on the
Grand Banks might be 100 meters by 100 meters with a mass on the order of 100,000 tons, it is easy to
see that the larger mass of ice could potentially produce ~1,000 medium icebergs. Fortunately, this does not seem to be the case or even a common occurrence as the correlation between
very large iceberg sightings and severe iceberg years is low. An additional conclusion that is possible
from this circumstantial data is that global warming does not seem to have an effect on the production of
very large icebergs. If global warming did tend to cause an increase in production of very large icebergs,
we would expect to see increased sightings in the vicinity of the Grand Banks as estimates of global
temperatures have risen. Ice island sighting data does not support such a claim. The work of Newell (1993) found that the maximum length of icebergs north of 50°N remains fairly
constant while the length decreases rapidly south of 50°N. Clearly a result of higher sea surface
temperatures and wave action (open water conditions), the rapid deterioration of very large icebergs
south of 50°N is a key factor for consideration by the oil and gas industry. Robe (1977) conducted
extensive photo-documentation of the deterioration of an ice island during May and June 1976. He noted
a tremendous effect from wave erosion, undercutting, and minor calving. Wave erosion had the most
profound effect as it tended to focus its energy on the small irregularities along the face of the
iceberg. Indeed, Provincial Airlines' interest (and more directly their clients') is easily justified
when one considers the fact that a piece of ice weighing approximately 30 million tons passed within
60 nm of a fixed oil production facility during late May. The very large tabular iceberg of 2002, while not the largest on record, is certainly one of the
largest seen in recent times by the International Ice Patrol and other operators on the Grand Banks.
These phenomena, while remarkable to behold, are not the "Jaws" of the transatlantic mariner as their
size and near vertical faces typically present excellent radar returns. Additionally, their size lends to more accurate tracking by the agencies responsible for monitoring
ice danger in the North Atlantic. ---------------------------------- 1The starting date and position used for this estimate of speed was very
close to the sea ice edge; however, the plotted distribution and extent did not seem to warrant
exclusion of this point as the limited sea ice would likely have had little impact on the drift of the
ice island. 2 As noted by Newell (1993), the ice island sighting record is potentially biased
by ice research programs and sighting methods (aircraft vs. ship) that have changed (i.e. made
identification easier and subsequently increasing the number of reports). The majority of data gathered
by Newell was obtained from International Ice Patrol iceberg sighting records. Acknowledgments:
Works Cited:
Dykstra, P., Monster iceberg breaks off Antarctic Shelf,
http://www.cnn.com/2002/TECH/space/05/09/iceberg.satellite, 10 May 2002. International Ice Observation and Ice Patrol Service in the North Atlantic Ocean - Season of 1946,
Bulletin No. 32, Government Printing Office, Washington, 1947. Newell, J. P., Exceptionally Large Icebergs and Ice Islands in Eastern Canadian Waters: A Review of
Sightings from 1900 to Present, Arctic, 46, 205-211, 1993.
Robe, R. Q., D. C. Maier, and R. C. Kollmeyer, Iceberg Deterioration, Nature, 267, 505-506, 1977. Trivers, G. A., International Ice Patrol's Iceberg Season Severity, Report of the International
Ice Patrol in the North Atlantic, 80, 49-59, 1994.
Date
Sighting Source
Description/Size
Notes 26 March
DFO
• 7 km long
06 April
DFO
• 2 km long
• 1.8 km long 18 April
DFO
10 May
PAL ice flight
• 1-2 km long
13 May
PAL ice flight
• 200 m long x 100 m wide
• 355 m long x 206 m wide
• 400 m long x 200 m wide
• 500 m long x 290 m wideSide-scar sonar
• ~1.3 Million Tons
• ~4.9 Million Tons
• ~5.3 Million Tons
• ~12.6 Million Tons23 May
Vessel
• 2 large pieces 27 May
National Ice Center
• 222 m long x 137 m wide
• 612 m long x 420 m wide • ~2.5 Million Tons
• ~30 Million Tons
LT Stoermer would like to thank Dr. Don Murphy for his insight and critical review of this article.
Bowditch, N., American Practical Navigator, Pub. No. 9, 2002.
Page last modified: