Marine Weather Review North Pacific Area
May to August 2010
Introduction
The period of May to August includes the late spring and summer months, a time of weaker cyclonic activity. For the North Pacific 2010 was no exception, with May being most active with five low pressure areas of non tropical origin producing winds of at least storm force, while June and July produced one each. August was overall the least active month with no low pressure systems of non tropical origin with winds exceeding gale force (higher than 47 kts).
Tropical activity normally picks up during this period as summer progresses but in 2010 only two western Pacific tropical cyclones affected OPCs ocean basin radiofacsimile chart area during the period. Both occurred in August, with Tropical Storms Dianmu in early August and Kompasu toward the end of the month. Dianmu later re intensified into a storm force post tropical (or extratropical) low as it approached the western Aleutian Islands. The tropical eastern North Pacific saw increased activity but unlike 2009, no tropical cyclones entered OPCs high seas area of responsibility north of 30N.
Tropical Activity
Tropical Storm Dianmu: Dianmu moved through the Sea of Japan as a weakening tropical storm and approached Japan as a t ropical depression at 0000 UTC August 12 near 38N 136E with maximum sustained winds of 30 kts with gusts to 40 kts. Six hours later Dianmu became extratropical upon passing over northern Japan. Figure 1 shows its subsequent re-intensification into an extratropical storm force low over a two day period as it moved toward the western Aleutian Islands. Table 1 lists selected ships reporting during this event. The cyclone briefly developed storm force winds on August 13 as it passed 250 nm east of the northern Kurile Islands. Post tropical Dianmu then passed about 300 nm south of the western Aleutian Islands as a gale late on the 14th, crossed the eastern Aleutians late on the 15th and then moved inland over mainland Alaska early on August 17.
| Observation | Position | Date/Time (UTC) | Wind | Seas (m/ft) |
|---|---|---|---|---|
| VRBX7 | 34N 140E | 12/0600 | SW 40 | 5.0/16 |
| Stuttgart Express (DGBE) | 37N 143E | 12/1200 | SW 40 | |
| A8BK6 | 51N 160E | 13/09600 | E 40 | 5.8/19 |
| VQIC2 | 48N 158E | 13/1200 | W 45 | 6.0/20 |
| Sea-Land Lightning (WDB9986) | 51N 164E | 14/0000 | NE 50 | 5.2/17 |
| SHJC | 39N 158E | 14/0600 | SW 40 | 5.5/18 |
| VRZL3 | 43N 171E | 15/0000 | W 35 | 7.3/24 |
Tropical Storm Kompasu: Tropical Storm 08W formed at 0000 UTC August 29 near the southwest edge of OPC oceanic radiofacsimile chart area near 21N 136E with maximum sustained winds of 40 kts with gusts to 50 kts. The cyclone was named Tropical Storm Kompasu twelve hours later as it passed near 22N 134E with maximum sustained winds of 45 kts with gusts to 55 kts. Kompasu then continued moving northwest away from the area to the end of the month.
Other Significant Events
North Pacific Storms, May 8-12: Figure 2 shows this event as two storm systems, with the first shown in the first part of Figure 2, near maximum intensity, originating about 300 nm to the southeast 0000 UTC May 8. Its northward progress was blocked by high pressure over the Bering Sea and the cyclone was forced to turn southwest and then southeastward as shown in Figure 2. Figure 3 is an ASCAT high-resolution image (25-km resolution) valid near the time of the first part of Figure 2 showing a broad area of gales around the west and north sides of the cyclone with some higher wind retrievals of around 40 kts on the north side. The increasing low bias of ASCAT winds at higher wind speeds leads to analysis of this system as a storm force low. The conflicting wind directions at the eastern edge of the image are from an earlier pass and may be erroneous. The cyclone then weakened to a gale force low early on the 9th and redeveloped toward the northeast late on the 9th, resulting in a new gale force low near 49N 163W 0600 UTC May 10. This new low later became the storm shown in the second part of Figure 2. The storm force winds with this cyclone were mainly ahead of the occluded front approaching the Alaskan coast as indicated by gusts at buoys such as those listed in Table 2 below. The cyclone subsequently drifted west and then southwest in the Bering Sea with a weakening trend (Figure 4) and dissipated by the middle of the month.
| Observation | Position | Date/Time (UTC) | Wind | Seas (m/ft) |
|---|---|---|---|---|
| V2MH | 45N 176W 45N 171W | 08/0900 09/0000 | E 40 E35 | 5.0/16 7.0/23 |
| 3ENU7 | 50N 173E | 09/0300 | NE 35 | 9.0/30 |
| Hong Kong Express (DHEB) | 53N 157W | 10/1200 | E 40 | |
| Ever Repute (3FRZ4) | 52N 151W | Oct-00 | SE 45 | 7.0/23 |
| Vienna Express (DGWF2) | 53N 148W | 11/0600 | SE 40 | 8.5/28 |
| Buoy 46061 | 60.2N 146.8W | 12/0400 | E 41 G51 Peak gust 54 | 5.0/16 Maximum 6.5/21 |
| Buoy 46082 | 59.7N 143.4W | 11/2100 | SE 37 G47 Peak gust 49 | 5.5/18 Maximum 6.5/21 |
| Buoy 46001 | 56.3N 148.0W | 11/0600 11/0500 11/0800 | SE 33 G41 Peak gust 43 | 5.0/16 Maximum 6.0/20 |
| Augustine Island | 59.4N 153.3W | 11/1700 11/1800 | NE 41 G47 | Peak gust 49 |
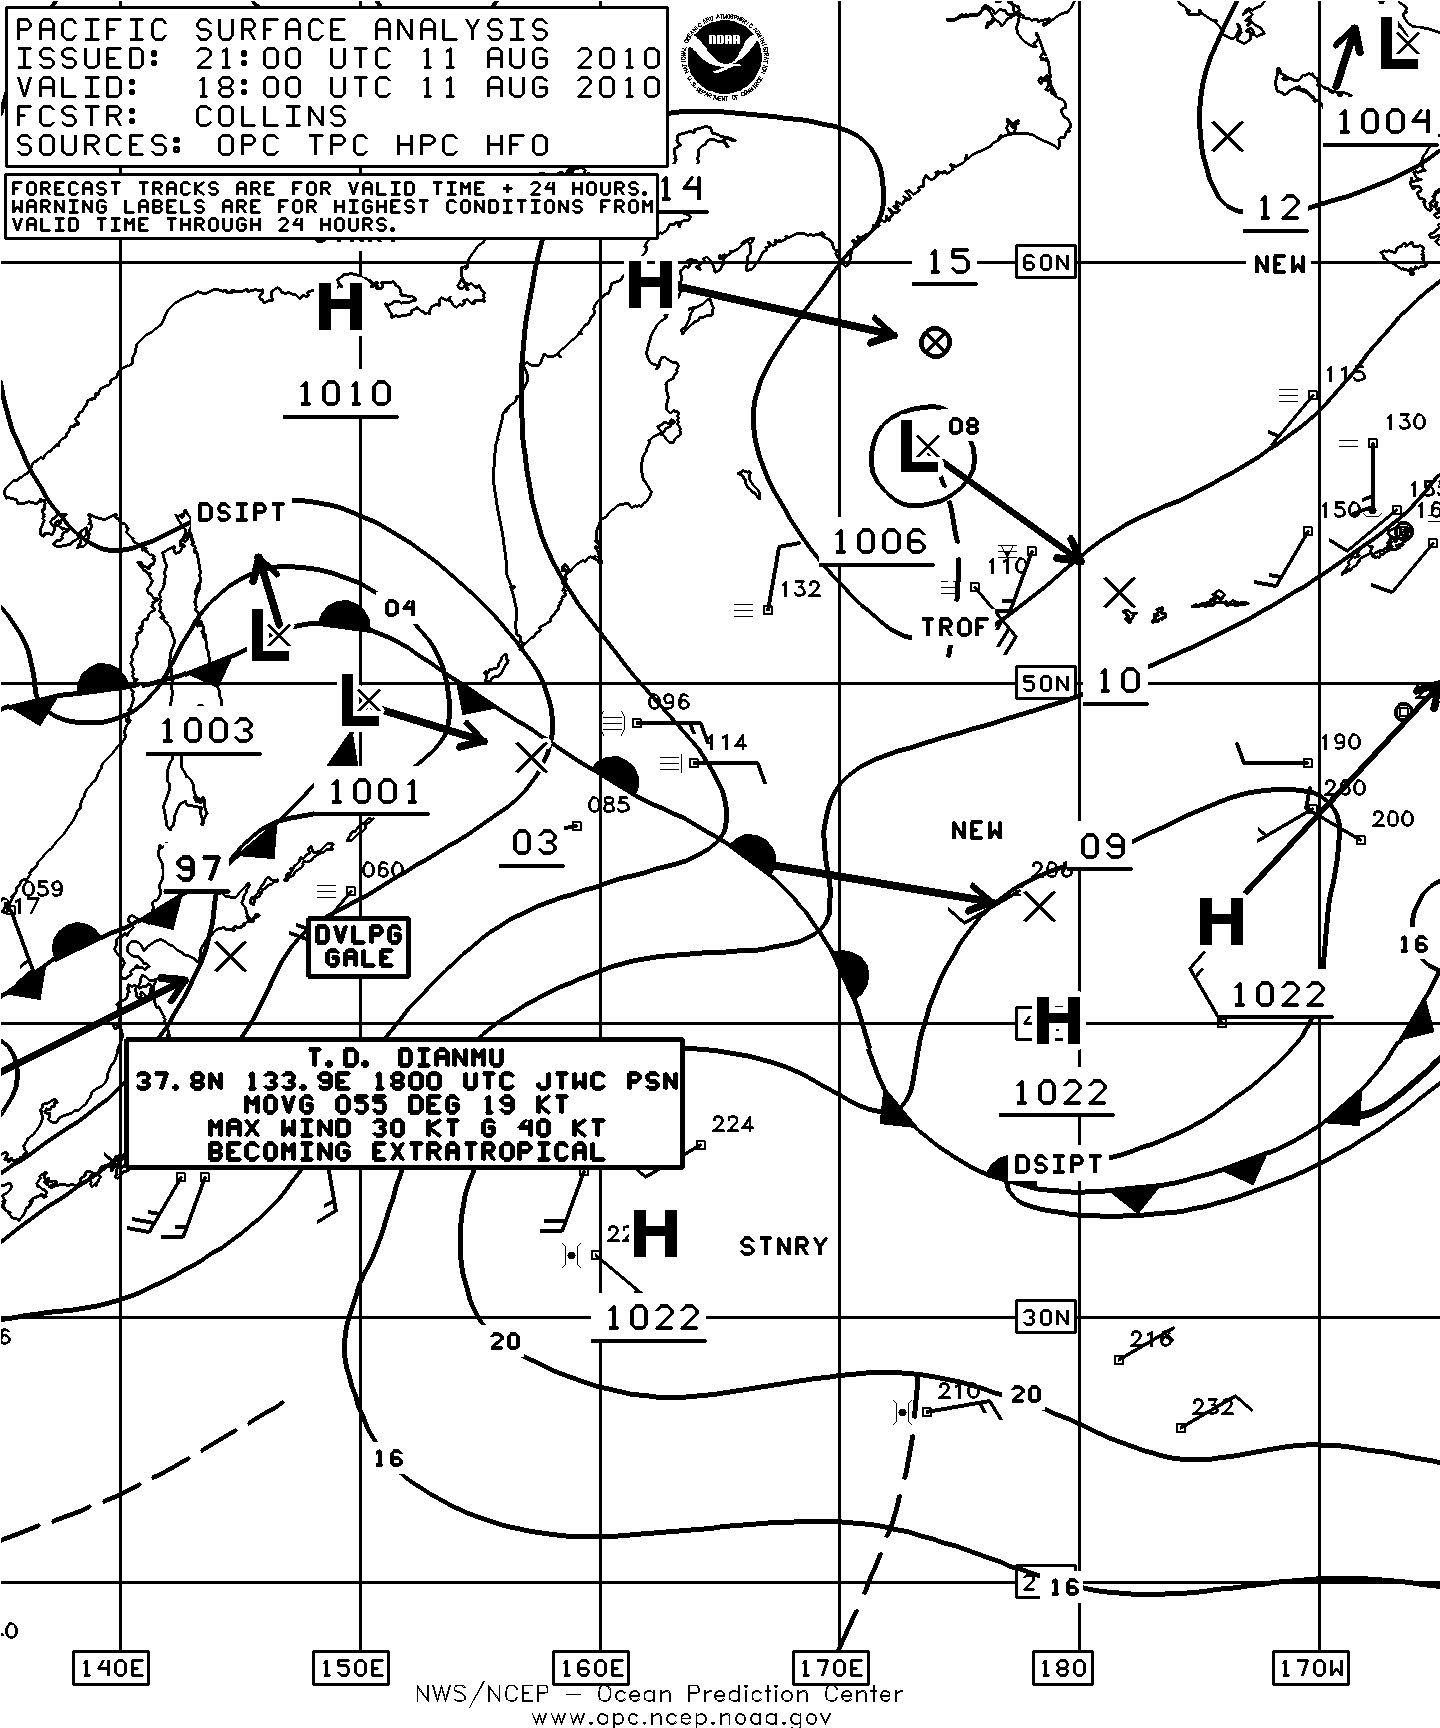
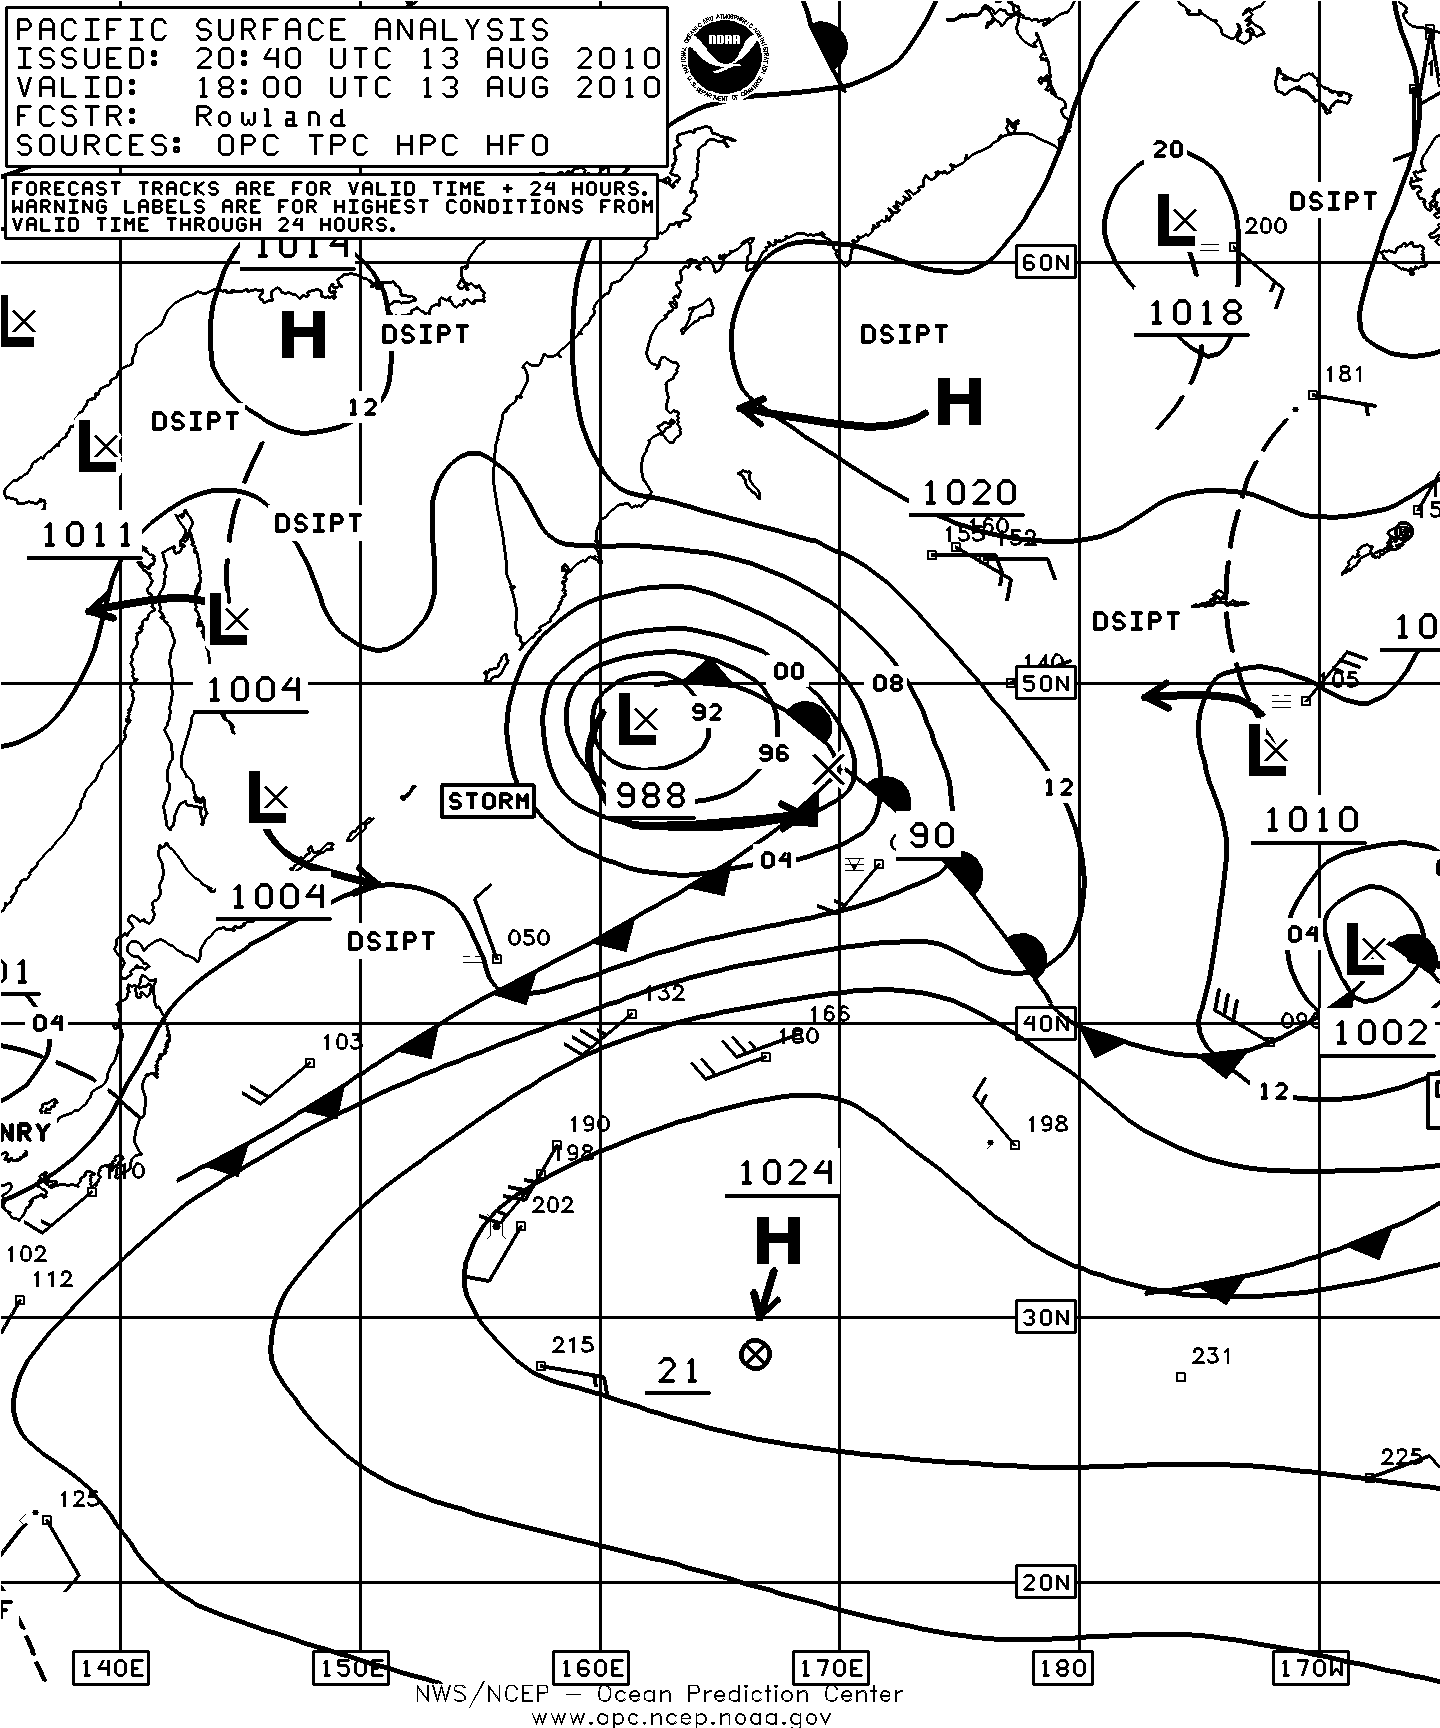
Figure 1. OPC North Pacific Surface Analysis charts valid 1800 UTC August 11 and 13, 2010.(Click to enlarge)
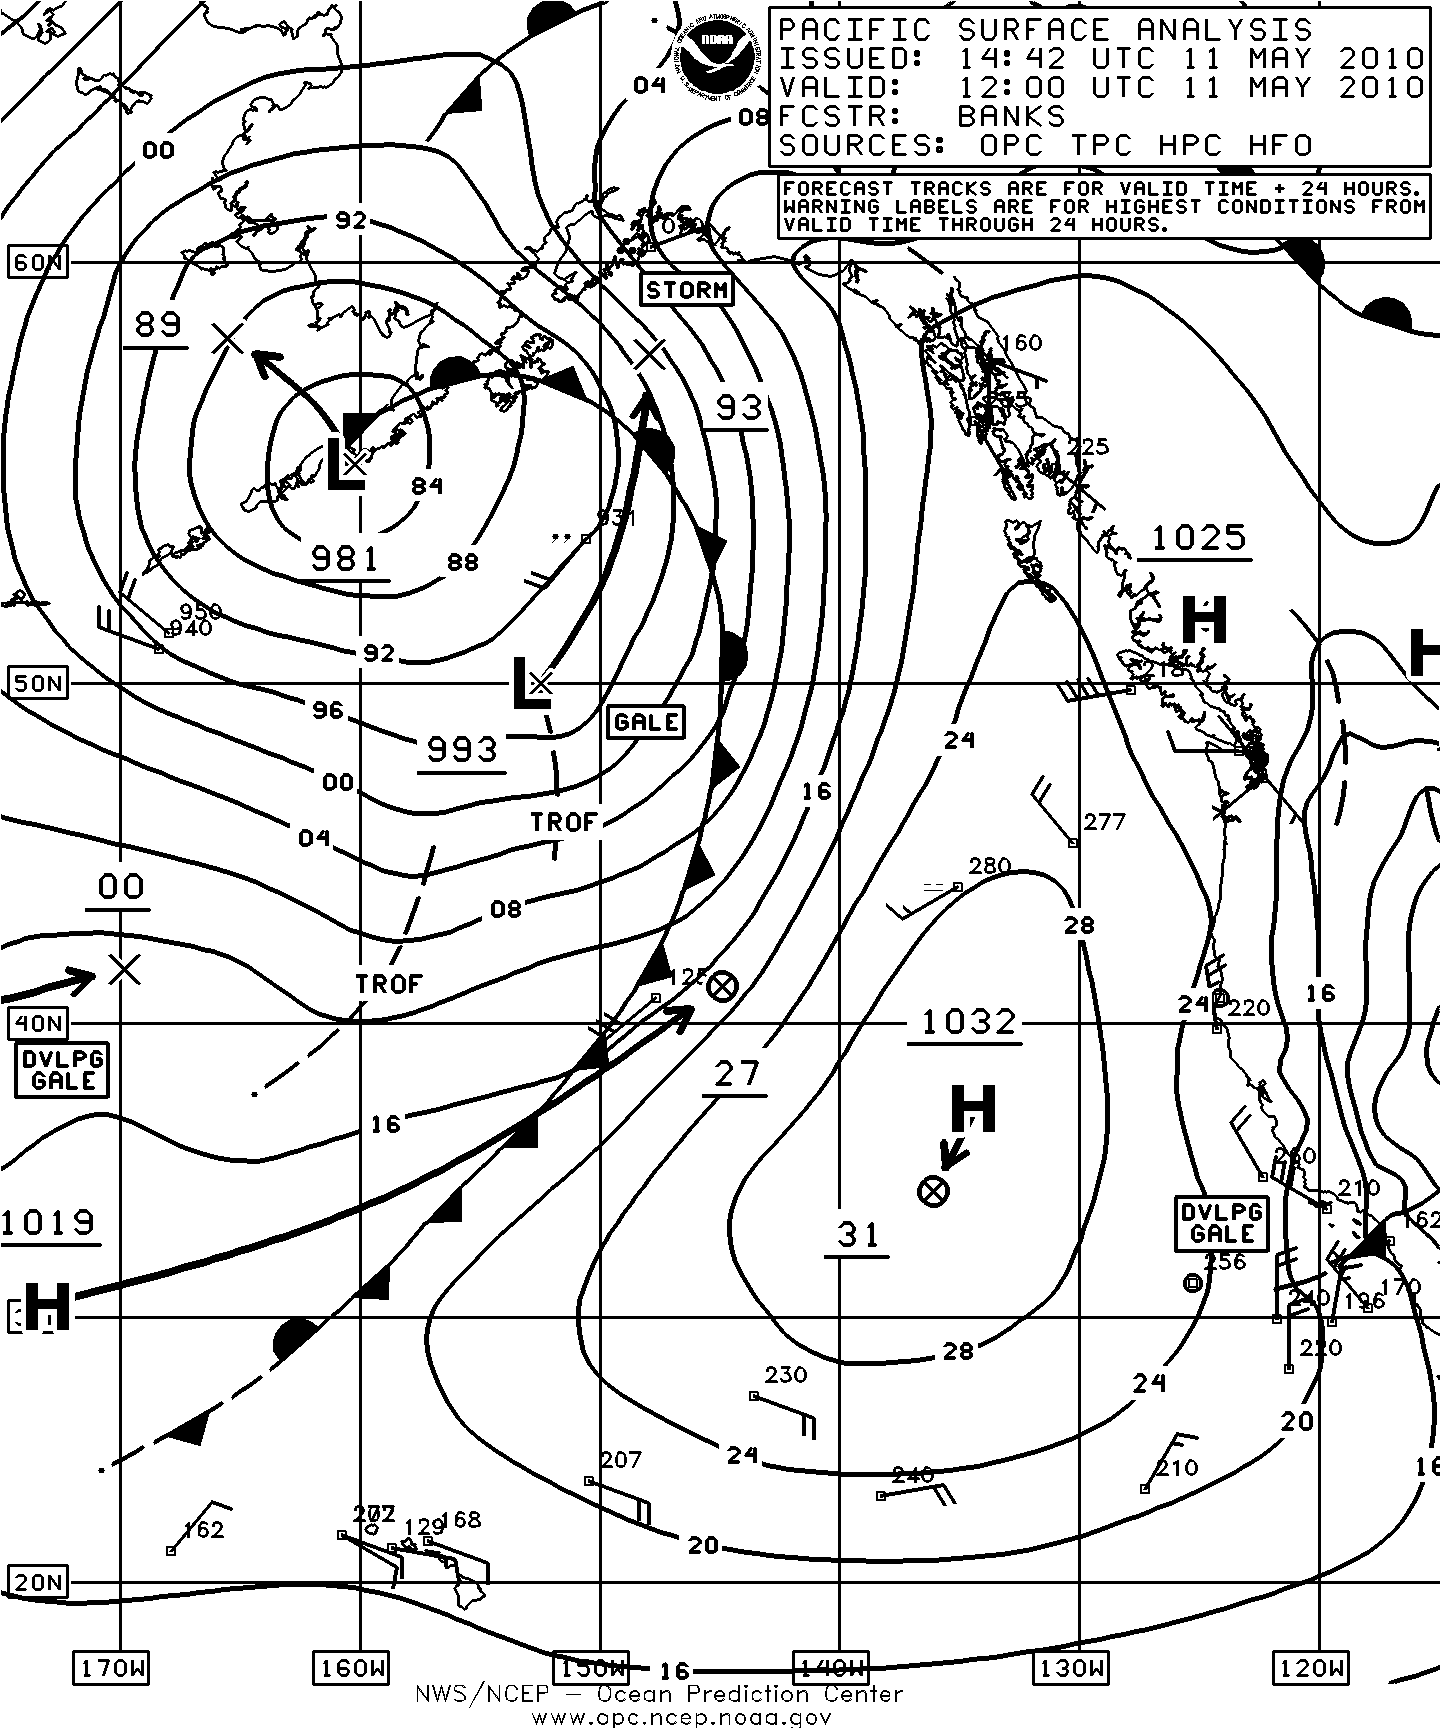
Figure 2. OPC North Pacific Surface Analysis charts valid 0000 UTC May 9 and 1200 UTC May 11, 2010.(Click to enlarge)
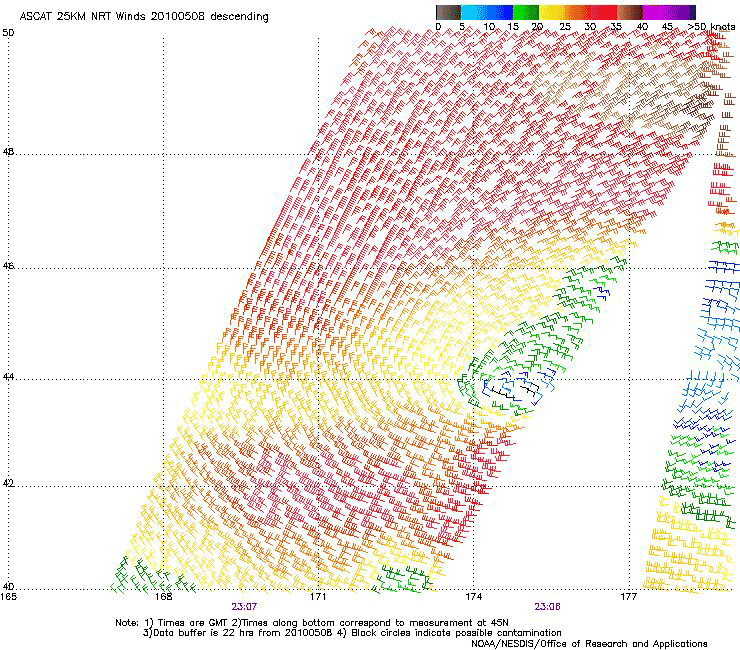
Figure 3.
ASCAT
scatterometer image
of satellite-sensed
winds around the
storm shown in the
first part of Figure
2. The resolution is
25 km, versus 50
km in the coarser
resolution version
of the imagery. The
valid time of the
pass is 2306 UTC
May 8, 2010, or
about one hour prior
to the valid time
of the first part of
Figure 2. Image is
courtesy of NOAA/
NESDIS Center for
Satellite Application
and Research
(Click to enlarge)
Western North Pacific Storm of May 11-13: The development of this small but potent cyclone is depicted in Figure 4. It originated as a wave on a front southwest of Japan late on the 9th and rapidly developed east of Japan. The second part of Figure 4 shows the cyclone at maximum intensity with its compact circulation developing a central pressure down to 983 hPa. Figure 5 is a high-resolution ASCAT pass revealing wind retrievals as high as 50 kts on the south side of the system. The Ryofu Maru (JGQH) reported a west wind of 45 kts and 4.6 m seas (15 ft) near 36N 147E at 1800 UTC May 12 and highest seas 7.3 m (24 ft) six hours later near 37N 147E. A Jason-2 satellite altimeter pass at 0655 UTC May 13 (Figure 6) detected seas as high as 29 ft (30 m) near 38N 150E. The cyclone subsequently weakened to a gale on May 13 while moving northeast, and approached the eastern Aleutians as a gale on the 15th, stalled in the southwest Gulf of Alaska from late on the 16th through the 18th. The cyclone then resumed eastward motion on the 19th with dissipation occurring later that day (Figure 7).
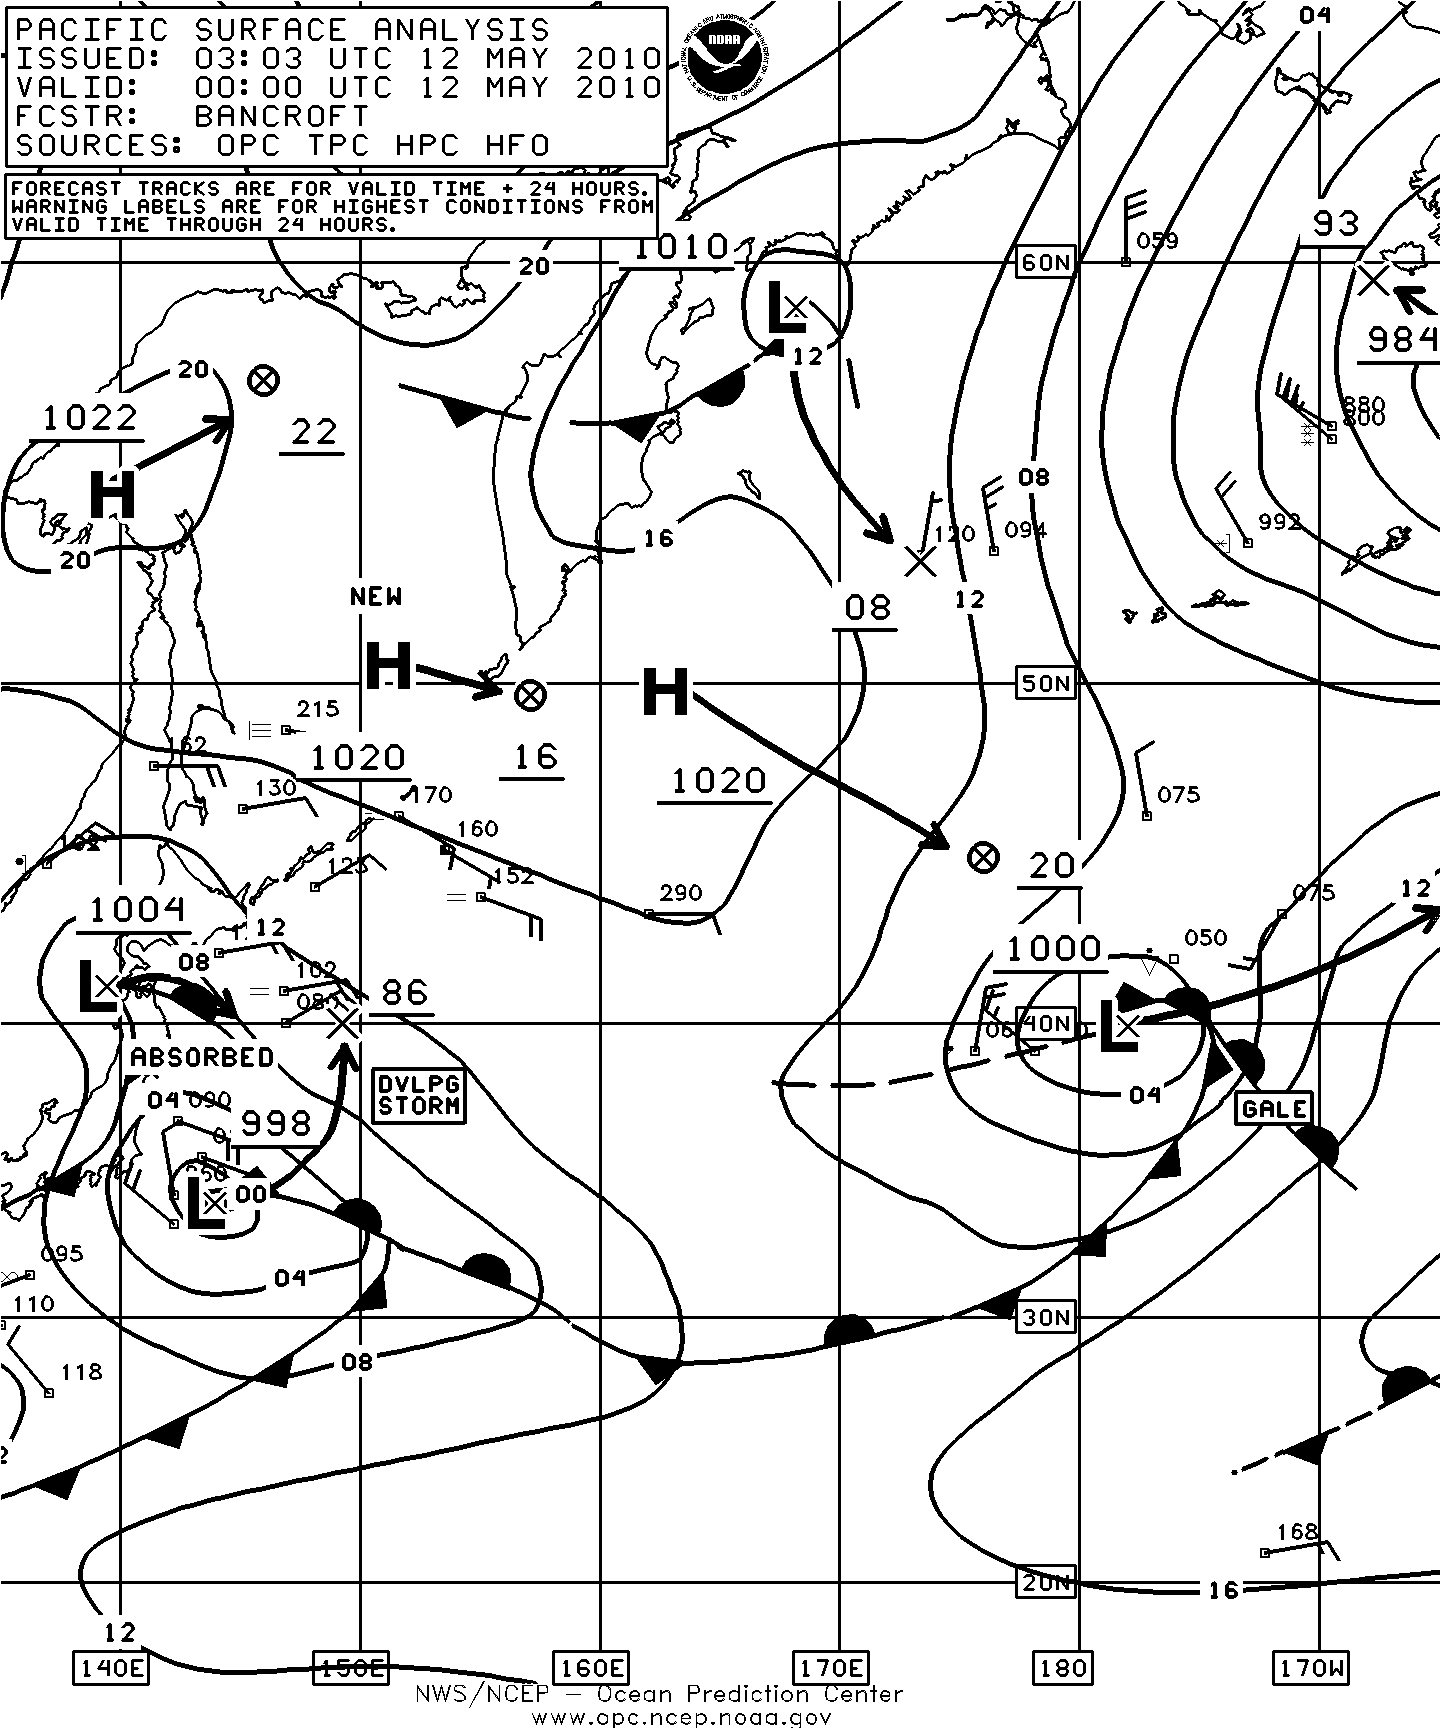
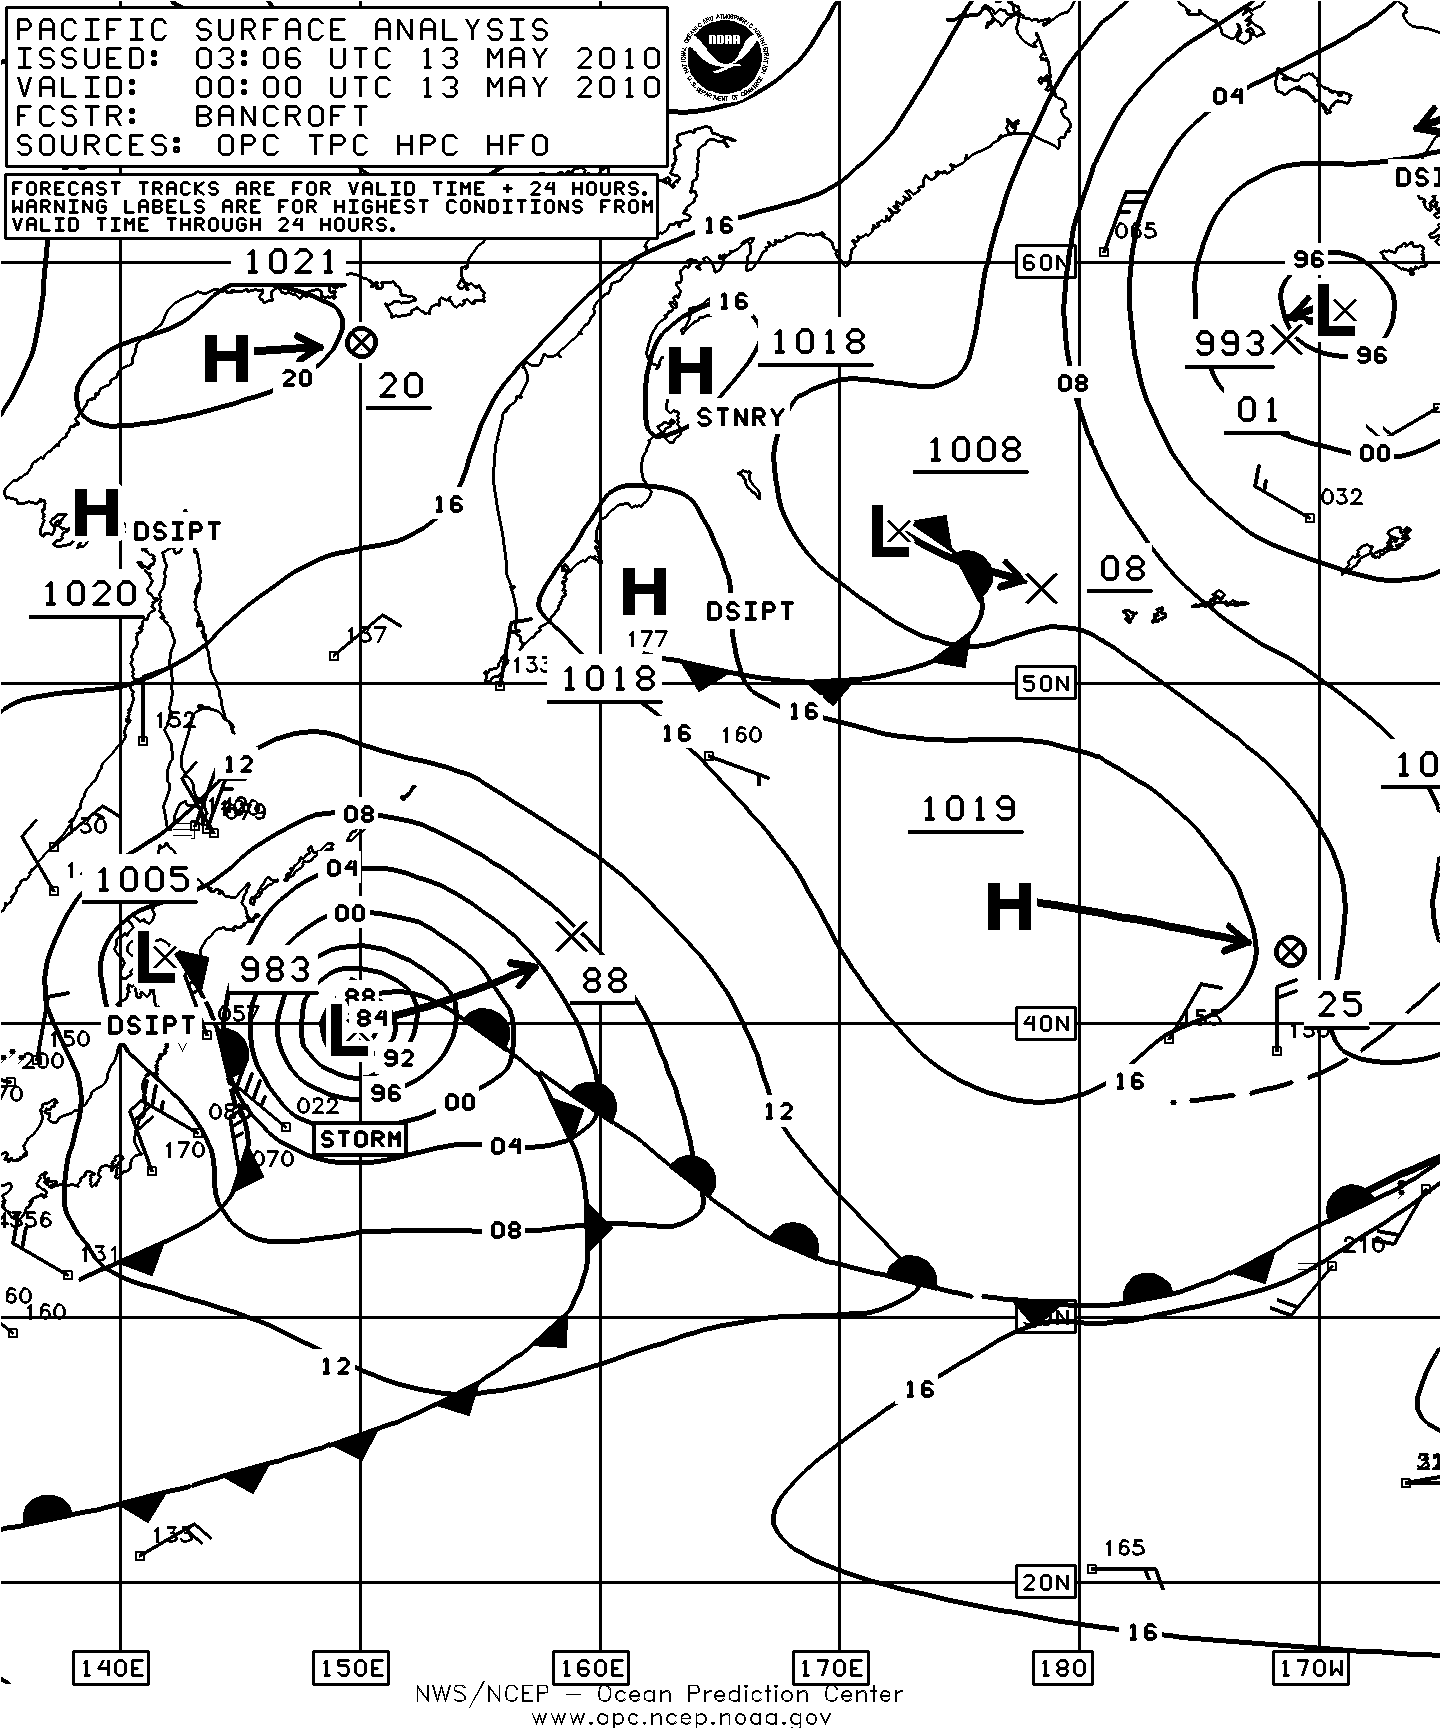
Figure 4. OPC North Pacific Surface Analysis charts valid 0000 UTC May 12 and 13, 2010.(Click to enlarge)
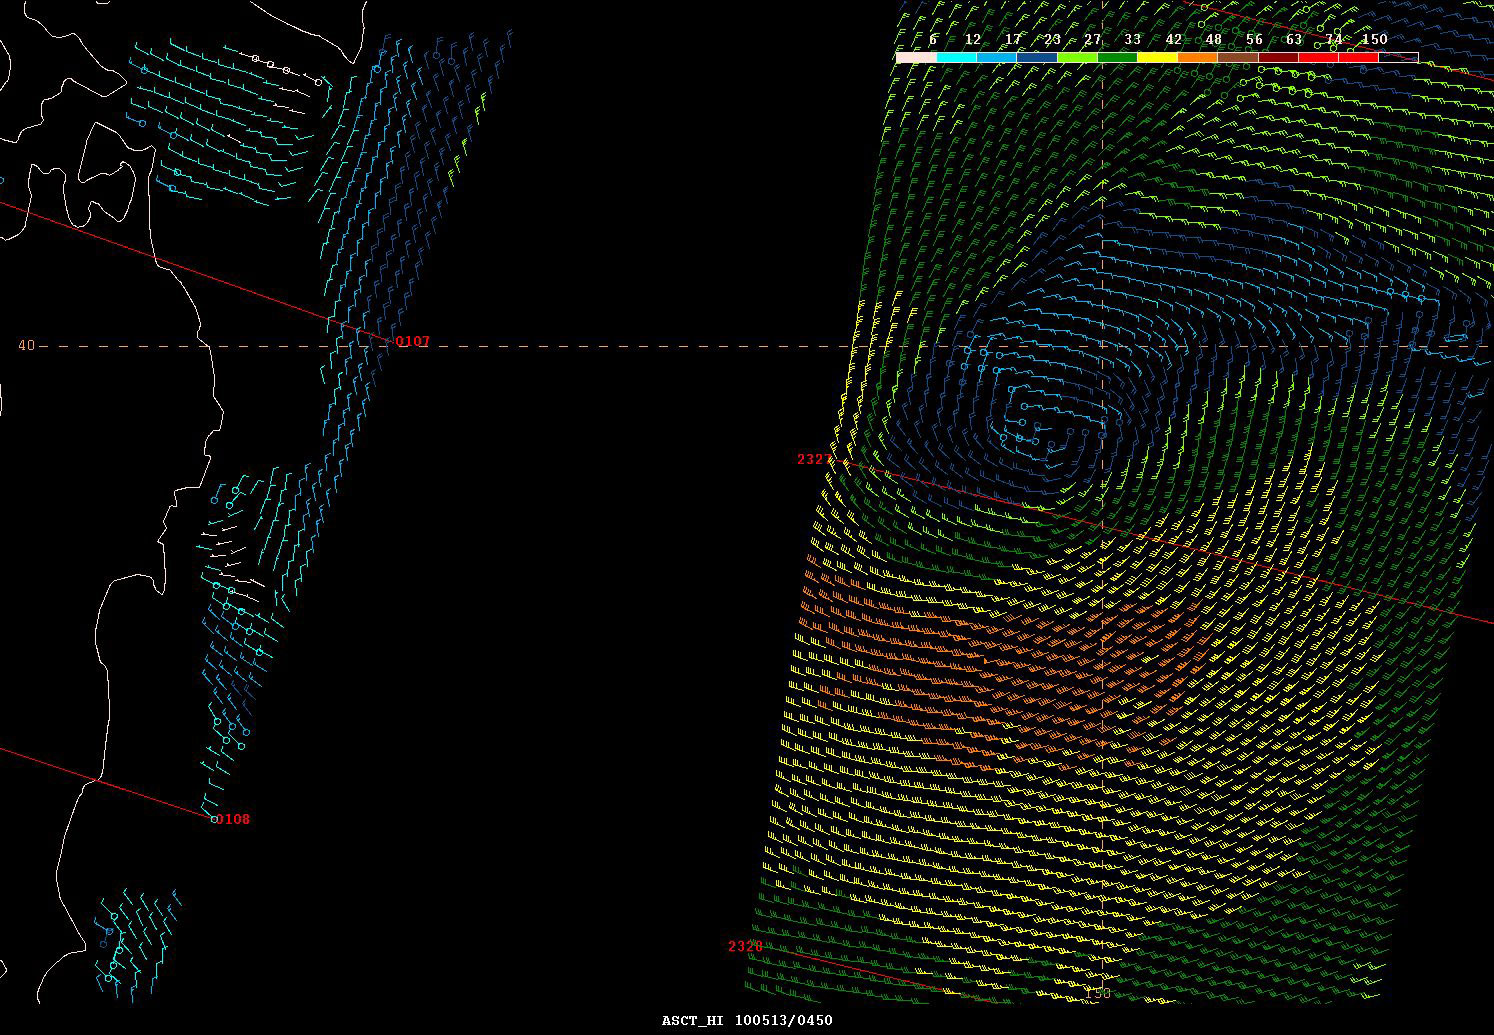
Figure 5. ASCAT 25 km scatterometer image of satellite sensed winds around the storm shown in the second part of Figure 4. The image contains portions of two passes with the eastern pass (valid about 2327 UTC May 12, 2010) containing the strongest winds and the center of the cyclone, near 40N 150E. A portion of northern Japan appears on the left side of the image. The valid time of the eastern pass is about one-half hour prior to the valid time of the second part of Figure 4. This form of the imagery adapted for OPC operational use contains numbered cross-track time lines (UTC) of the satellite. (Click to enlarge)
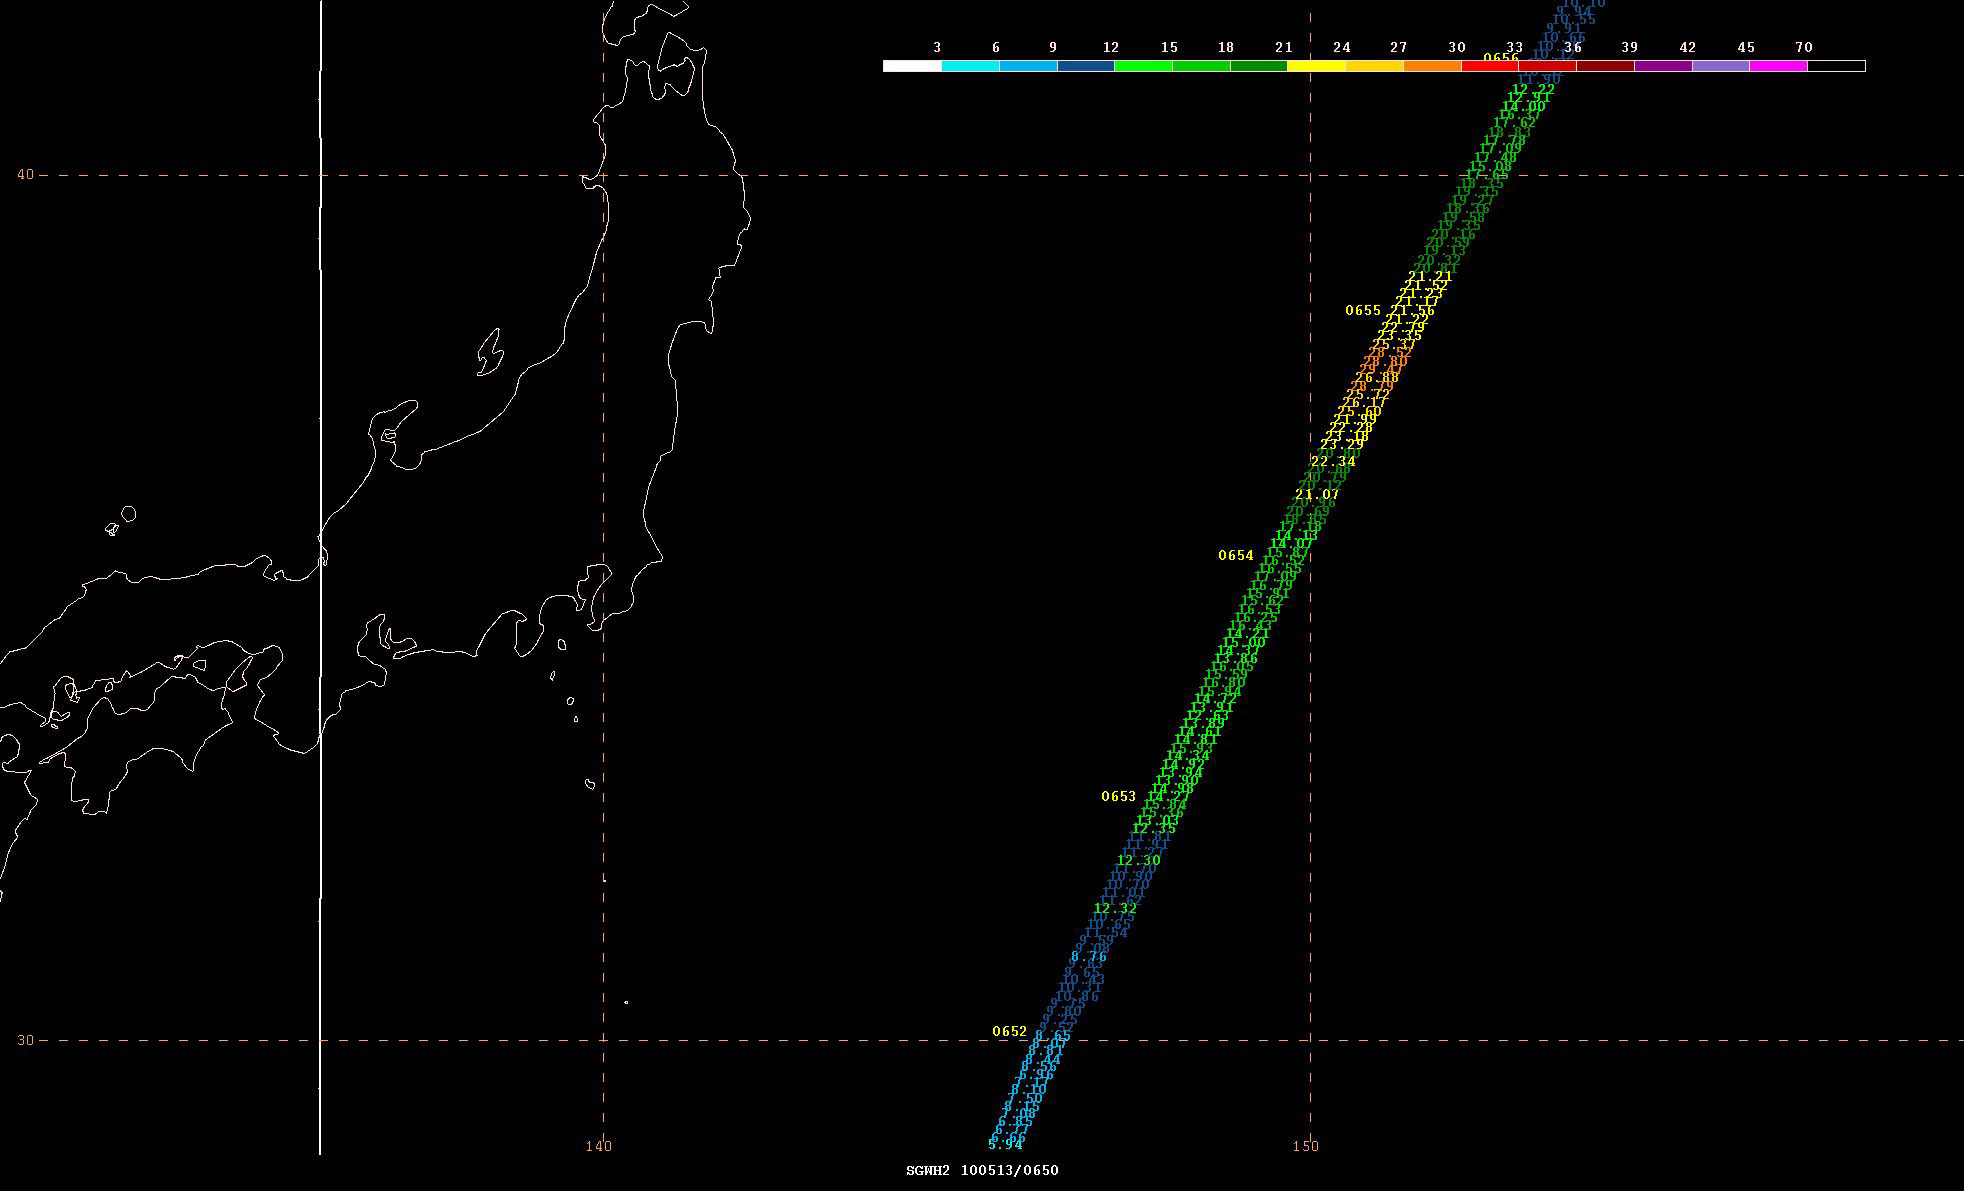
Figure 6. Jason-2 altimeter pass of satellite-sensed significant wave heights on the southwest side of the storm shown in the second part of Figure 4. The image contains a swath of numbers in ft with two decimal places and four digit satellite times (UTC) given to the left of the track. The highest seas, about 28 ft (8.5 m) appear near the center of the image. The valid time of the pass is approximately seven hours later than the valid time of the second part of Figure 4.(Click to enlarge)
Northeast Pacific Storm, May 19- 20: The development of this small but compact and potent storm is shown in Figure 7 over a twenty-four hour period in which its central pressure fell 18 hPa. It originated as a weak frontal wave of low pressure over the southwestern waters of the North Pacific on May 15. The cyclone was actually more impressive in its satellite presentation (Figure 8) with its intense and well defined cloud circulation in visible imagery) and winds reported by satellite and ships, than indicated from its central pressure in Figure 7. The 55 kts wind retrievals shown in the ASCAT imagery in Figure 9 are the highest that the author can recall seeing with any cyclone in the North Pacific during the four month period. Given the low biases of ASCAT winds especially at the higher wind speeds, this cyclone may have briefly developed hurricane force winds in a small area south of the center shortly after the map time in the second part of Figure 7. The central pressure was 988 hPa six hours later at 0000 UTC on the 20th. Some ship, buoy and coastal observations taken in this storm are listed in Table 3. The report of 70 kts from the Celebrity Infinity had a high bias of 7 kts. The cyclone was short lived, however, as it subsequently weakened to a gale near the Queen Charlotte Islands the next day, stalled and dissipated late on the 21st.
| Observation | Position | Date/Time (UTC) | Wind | Seas (m/ft) |
|---|---|---|---|---|
| Celebrity Infinity (9HJD9) | 49.5N 127.3W | 20/0600 | SE 70 | |
| Global Sentinel (V7KR4) | 48N 126W | 20/0600 | SW 47 | 10.7/35 |
| Buoy 46132 | 49.7N 127.9W | 20/0400 20/0700 |
E 35 G47 | 5.0/16 Maximum 6.0/20 |
| Buoy 46041 | 47.4N 124.7W | 20/0100 20/0400 |
39 G49 | 5.5/18 Maximum 8.5/28 |
| Buoy 46211 | 46.9N 124.2W | 20/0400 | SW 45 | 8.5/28 |
| Buoy 46029 | 46.1N 124.5W | 20/0000 20/0300 |
SW 37 G47 | 6.0/20 Maximum 8.5/28 |
| Buoy 46089 | 45.9N 125.8W | 19/2200 20/0000 |
S 43 G56 | 6.5/21 Maximum 9.5/31 |
| Buoy 46050 | 44.6N 124.5W | 19/1900 20/0300 |
S 35 G49 | 3.5/11 Maximum 7.5/25 |
| Buoy 46206 | 48.8N 126.0W | 20/0100 20/0500 |
SE 39 G51 | 4.0/12 Maximum 7.0/23 |
| Destructive Island (DESW1) | 47.7N 124.4W | 20/0200 | SE 53 G61 Peak gust 7 |
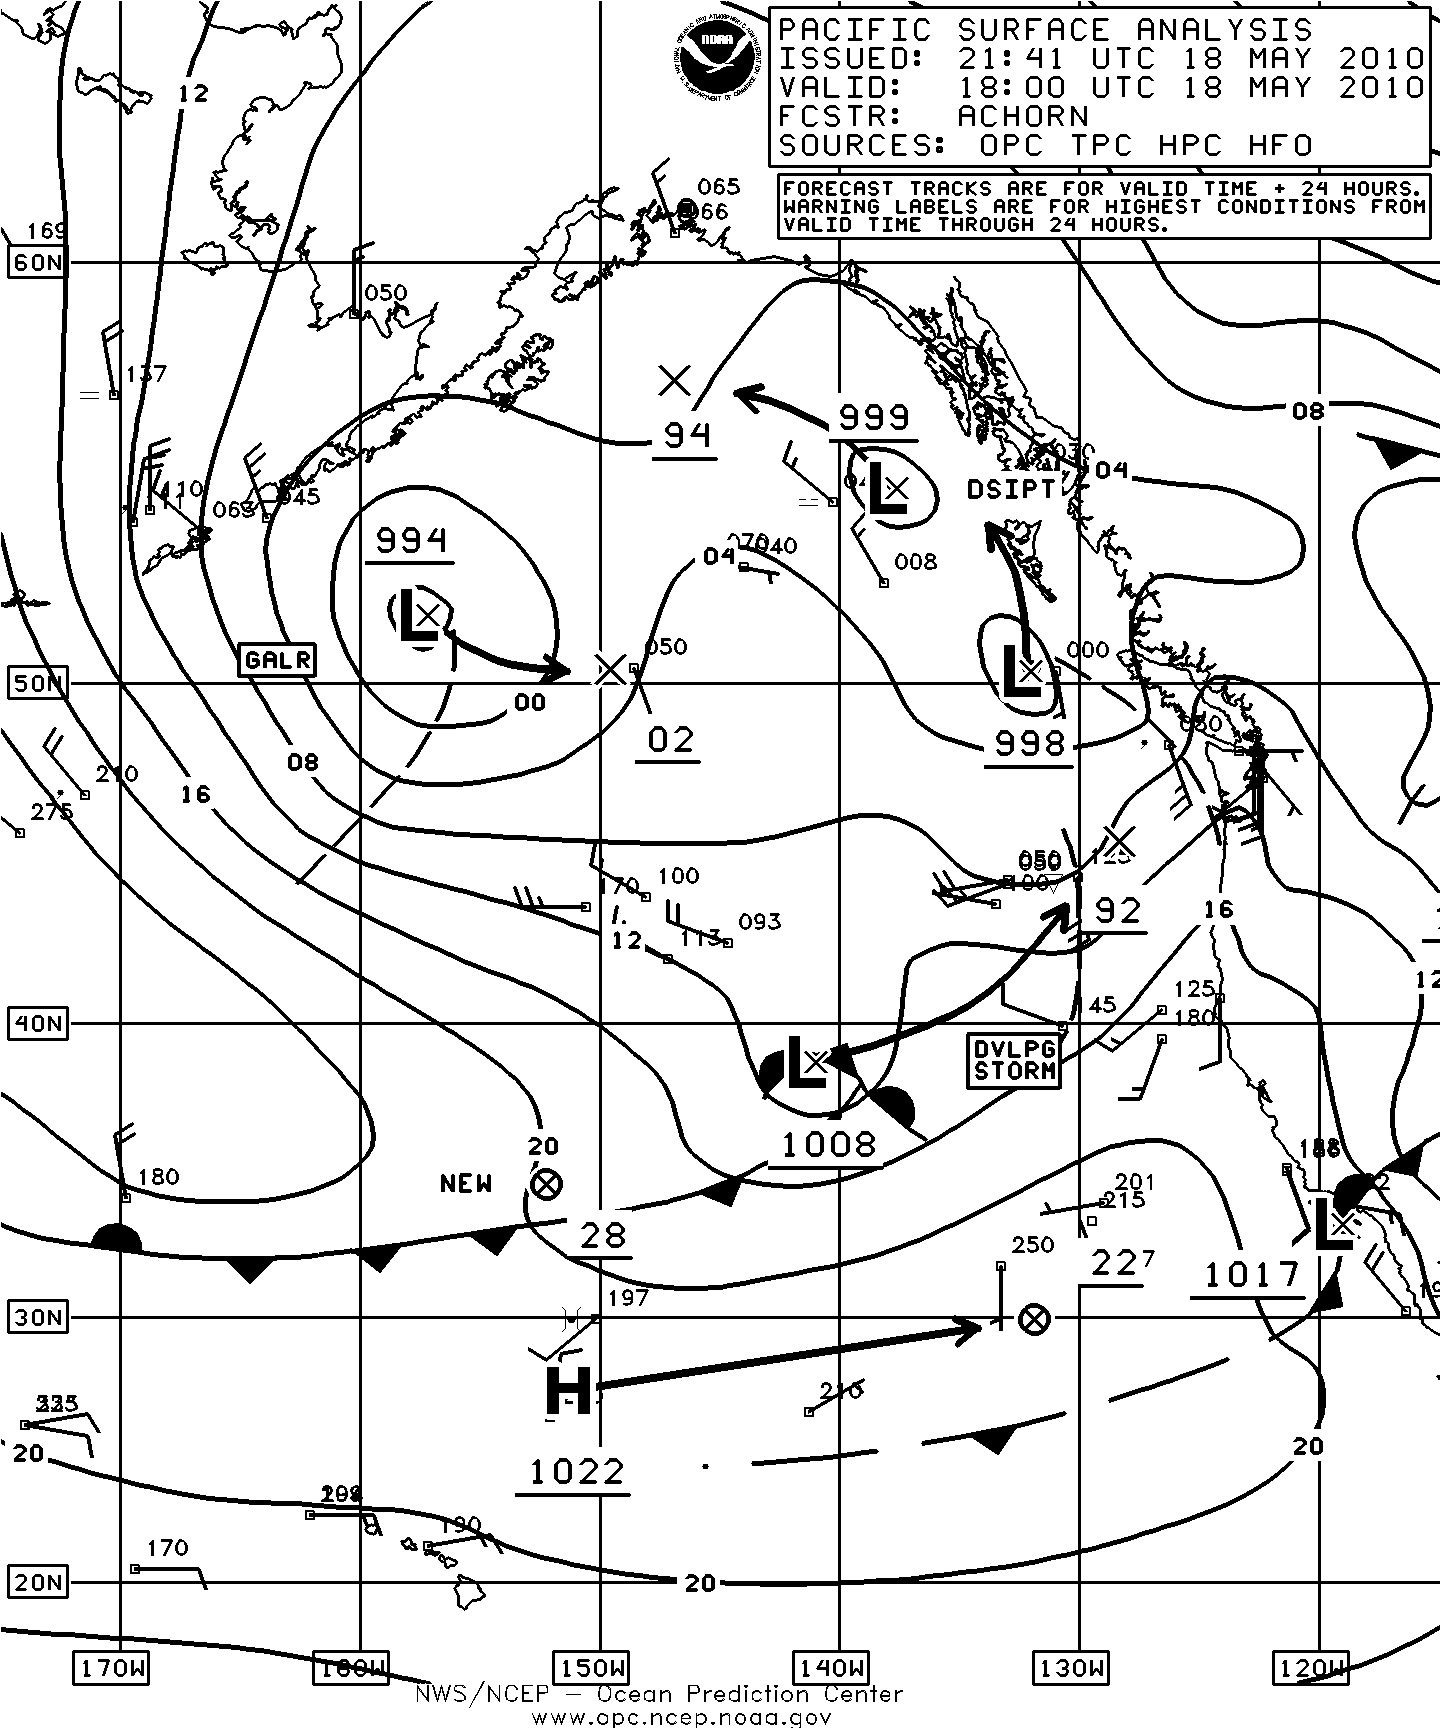
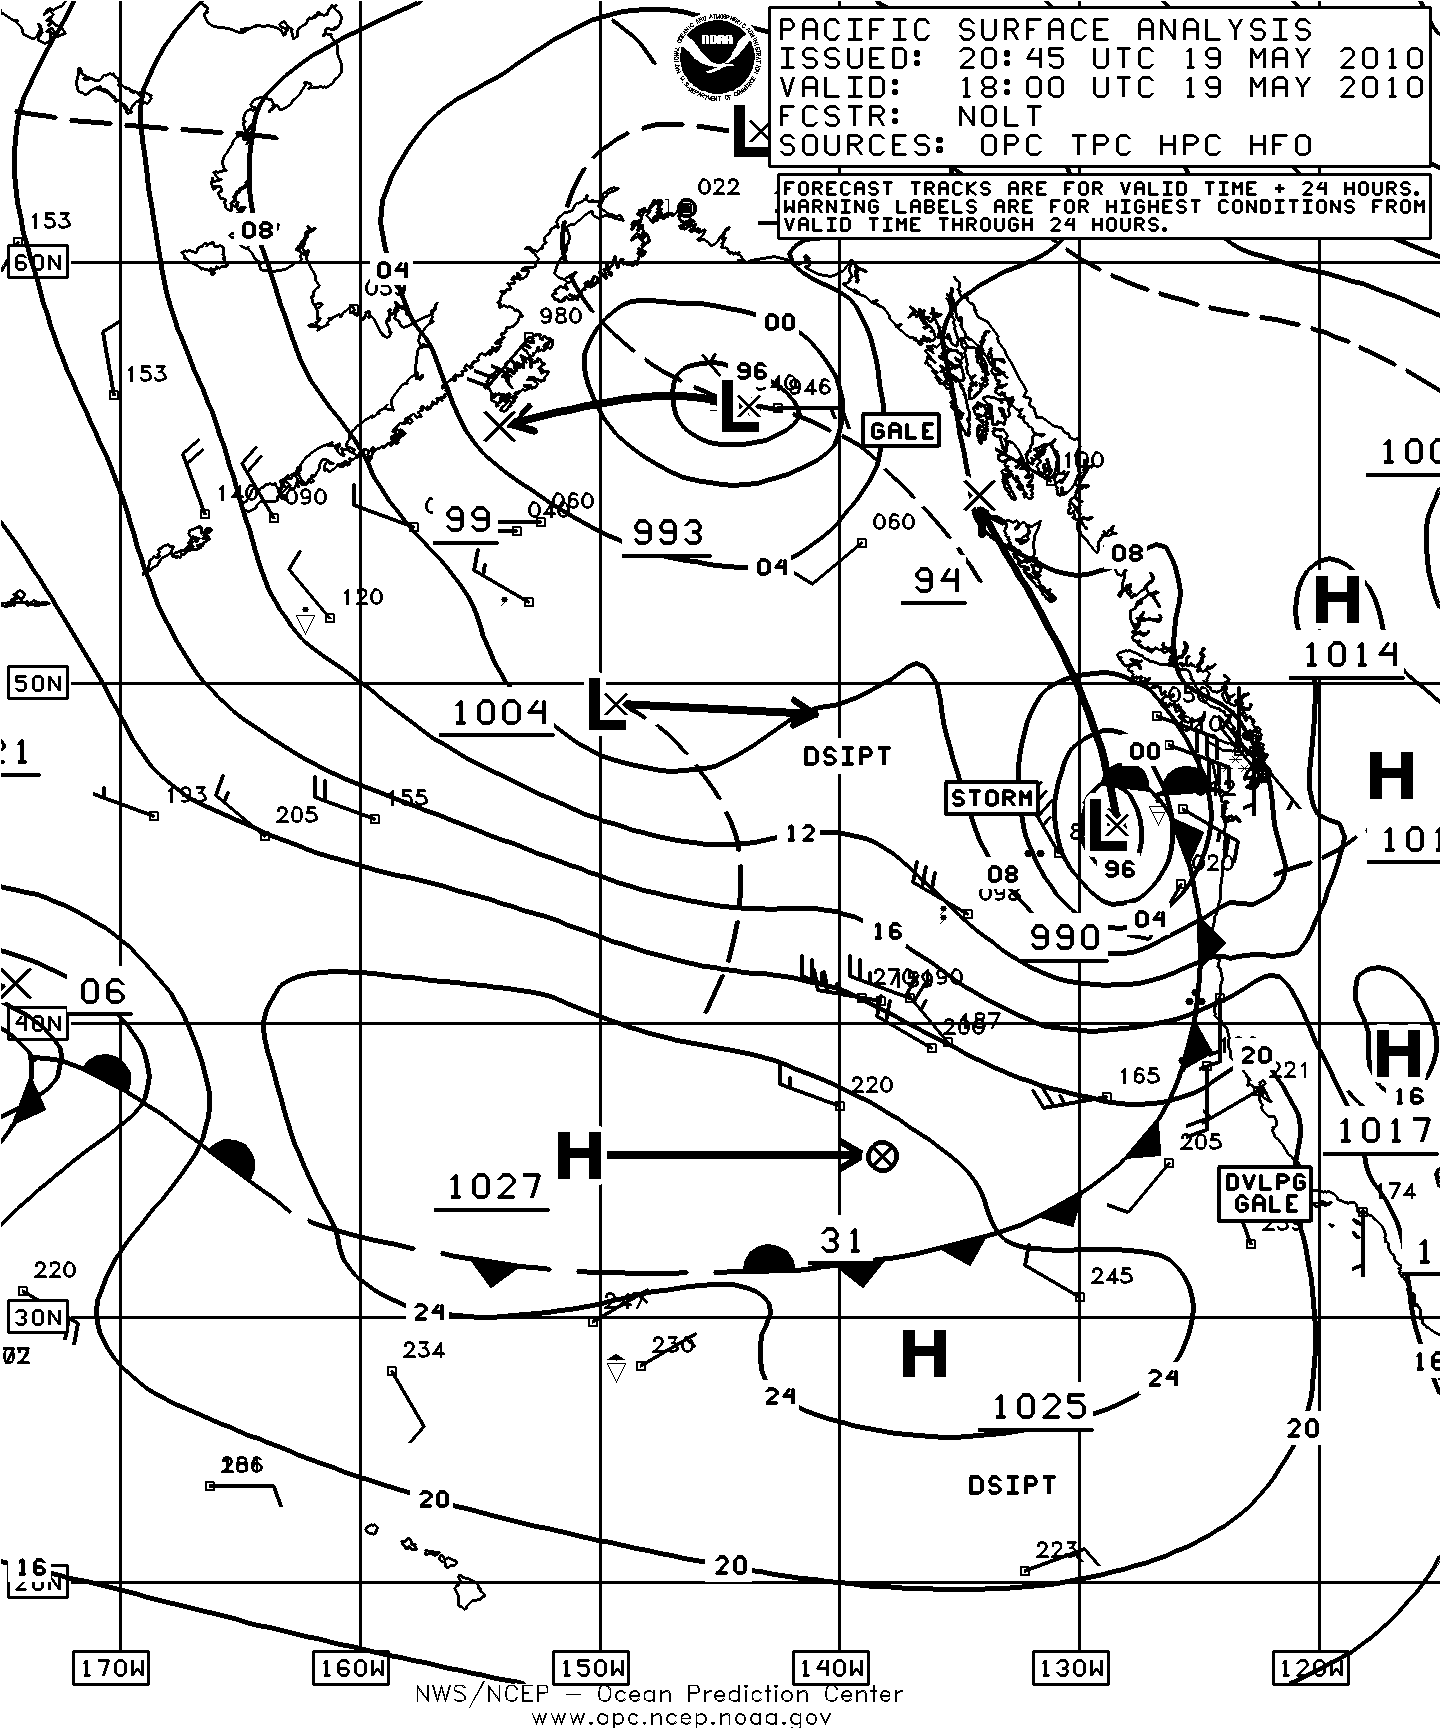
Figure 7. OPC North Pacific Surface Analysis charts valid 1800 UTC May 18 and 19, 2010.(Click to enlarge)
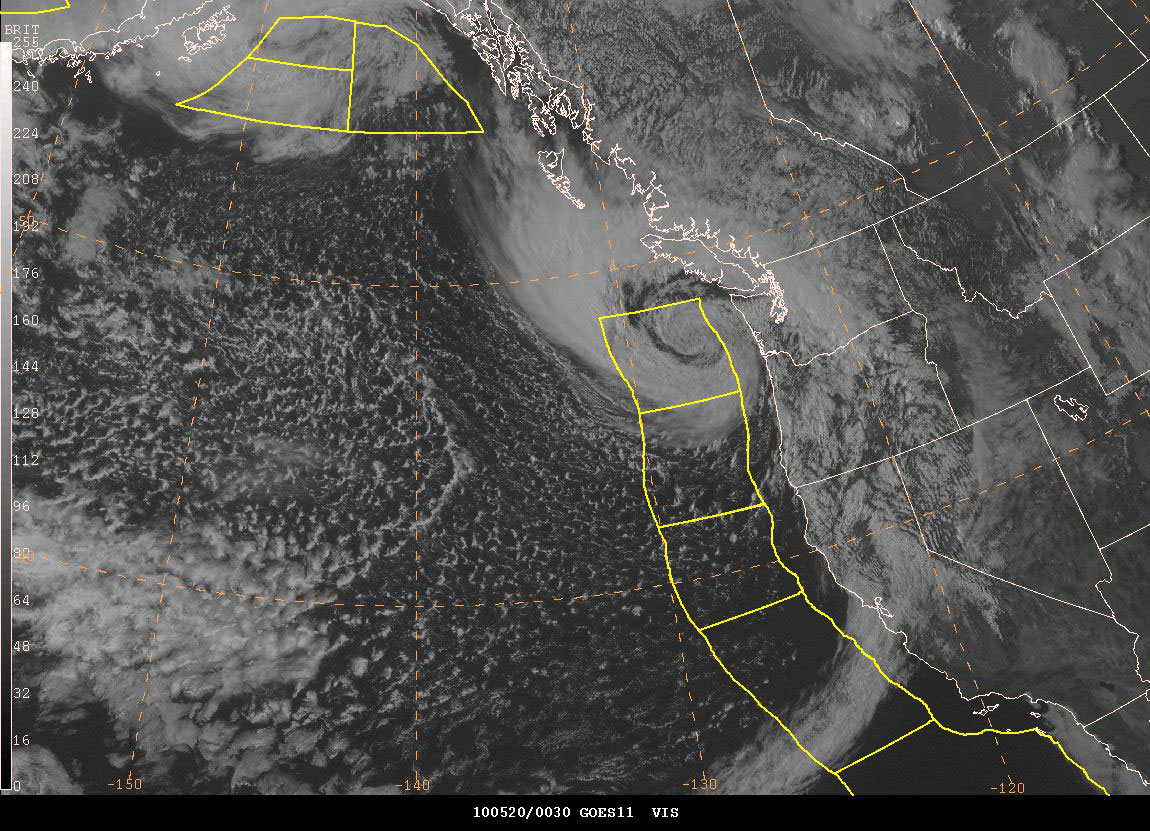
Figure 8. GOES11 visible satellite image of portions of western North America and the northeastern Pacific valid 0030 UTC May 20, 2010, or six and one-half hours later than the valid time of the second part of Figure 7.(Click to enlarge)
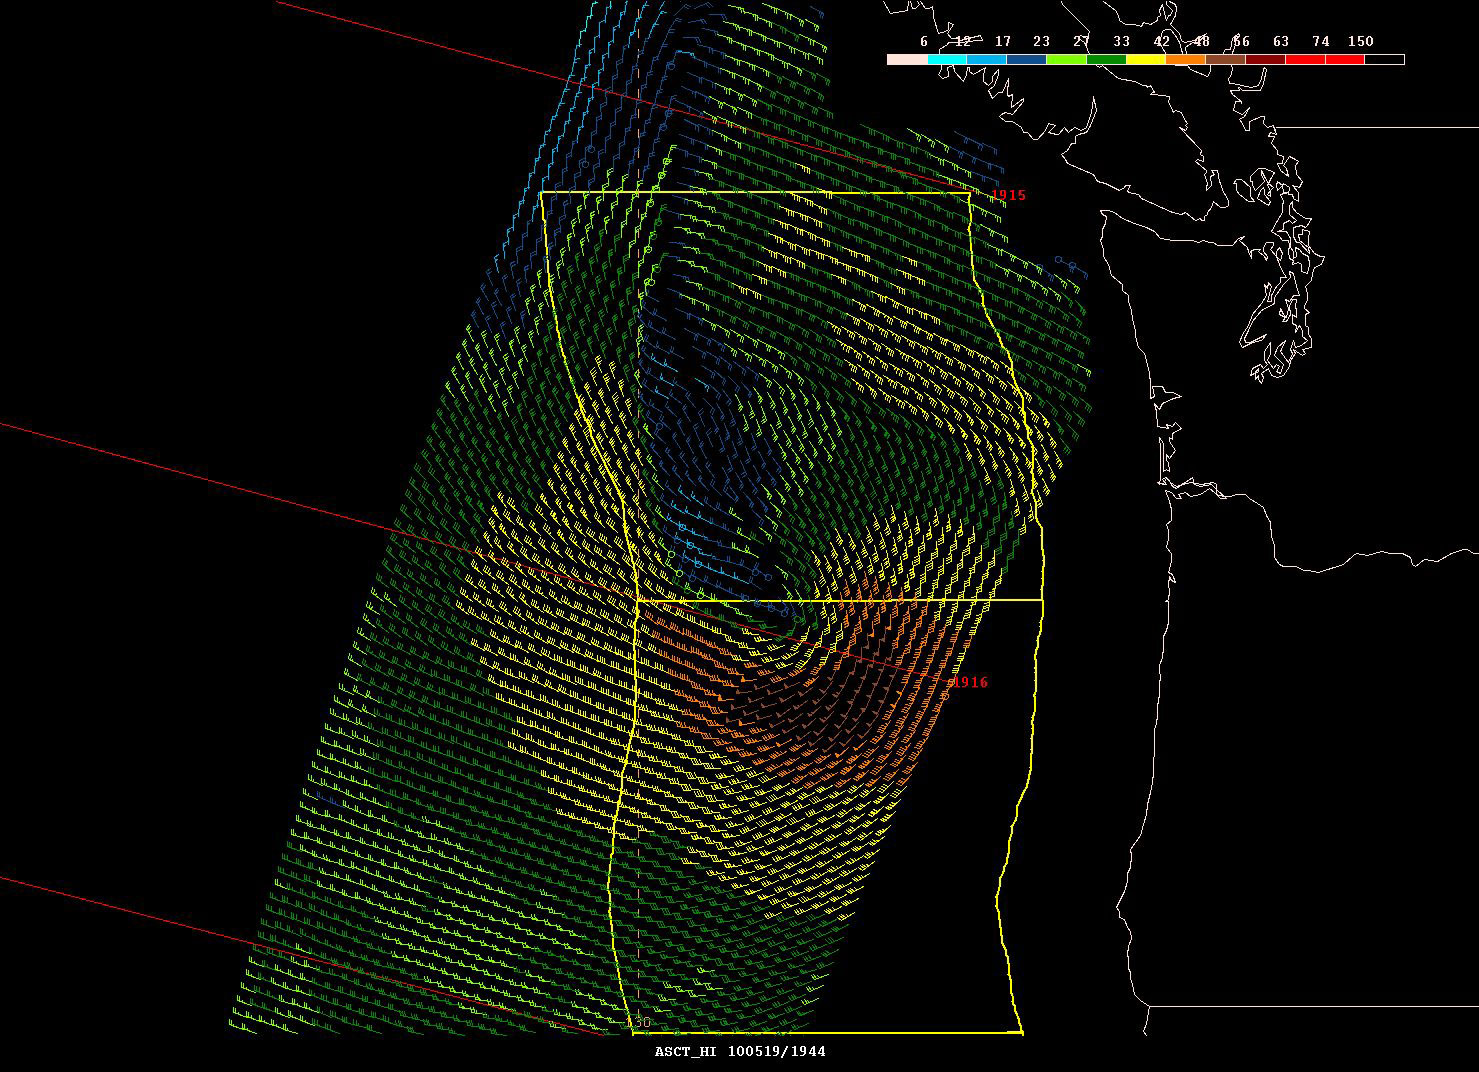
Figure 9. ASCAT 25 km scatterometer image of satellite-sensed winds around the storm shown in the second part of Figure 7. The valid time of the pass is about 1916 UTC May 19, 2010 or one and one-quarter hours later than the valid time of the second part of Figure 7. The center of the cyclone is near the center of the image, west of the northern Oregon coast. This form of the imagery adapted for OPC operational use contains numbered cross-track time lines (UTC) of the satellite and a color scale for the wind barbs on the upper-right side.(Click to enlarge)
North Pacific Storm, May 23-25: The development of this central North Pacific system is shown in Figure 10. This development was similar to that of the first storm in the May 8-12 period, and this cyclone was again blocked by a ridge to the north and forced to turn west on the 24th. The central pressure fell 19 hPa in the twenty-four hour period ending at 1200 UTC May 24. The MOL Velocity (9VVK) near 43N 172E reported west winds of 55 kts and 4.0 m seas (13 ft) at 0900 UTC on the 24th. By comparison, the ASCAT imagery in Figure 11 shows southwest winds around 40 kts just east of the vessel and similar winds, from the north and northeast, north and west of the cyclone center (near middle of image). A vessel using the SHIP identifier near 47N 179E reported southeast winds of 45 kts and 3.7 m seas (12 ft) at 1800 UTC on the 24th. The Hoechst Express (51N 171E) encountered east winds of 40 kts and 6.5 m seas (21 ft) at 0000 UTC on the 25th. The cyclone subsequently turned toward the southeast early on May 25 and dissipated later that day or became absorbed by a new gale force cyclone forming to the northeast near the central Aleutian Islands.
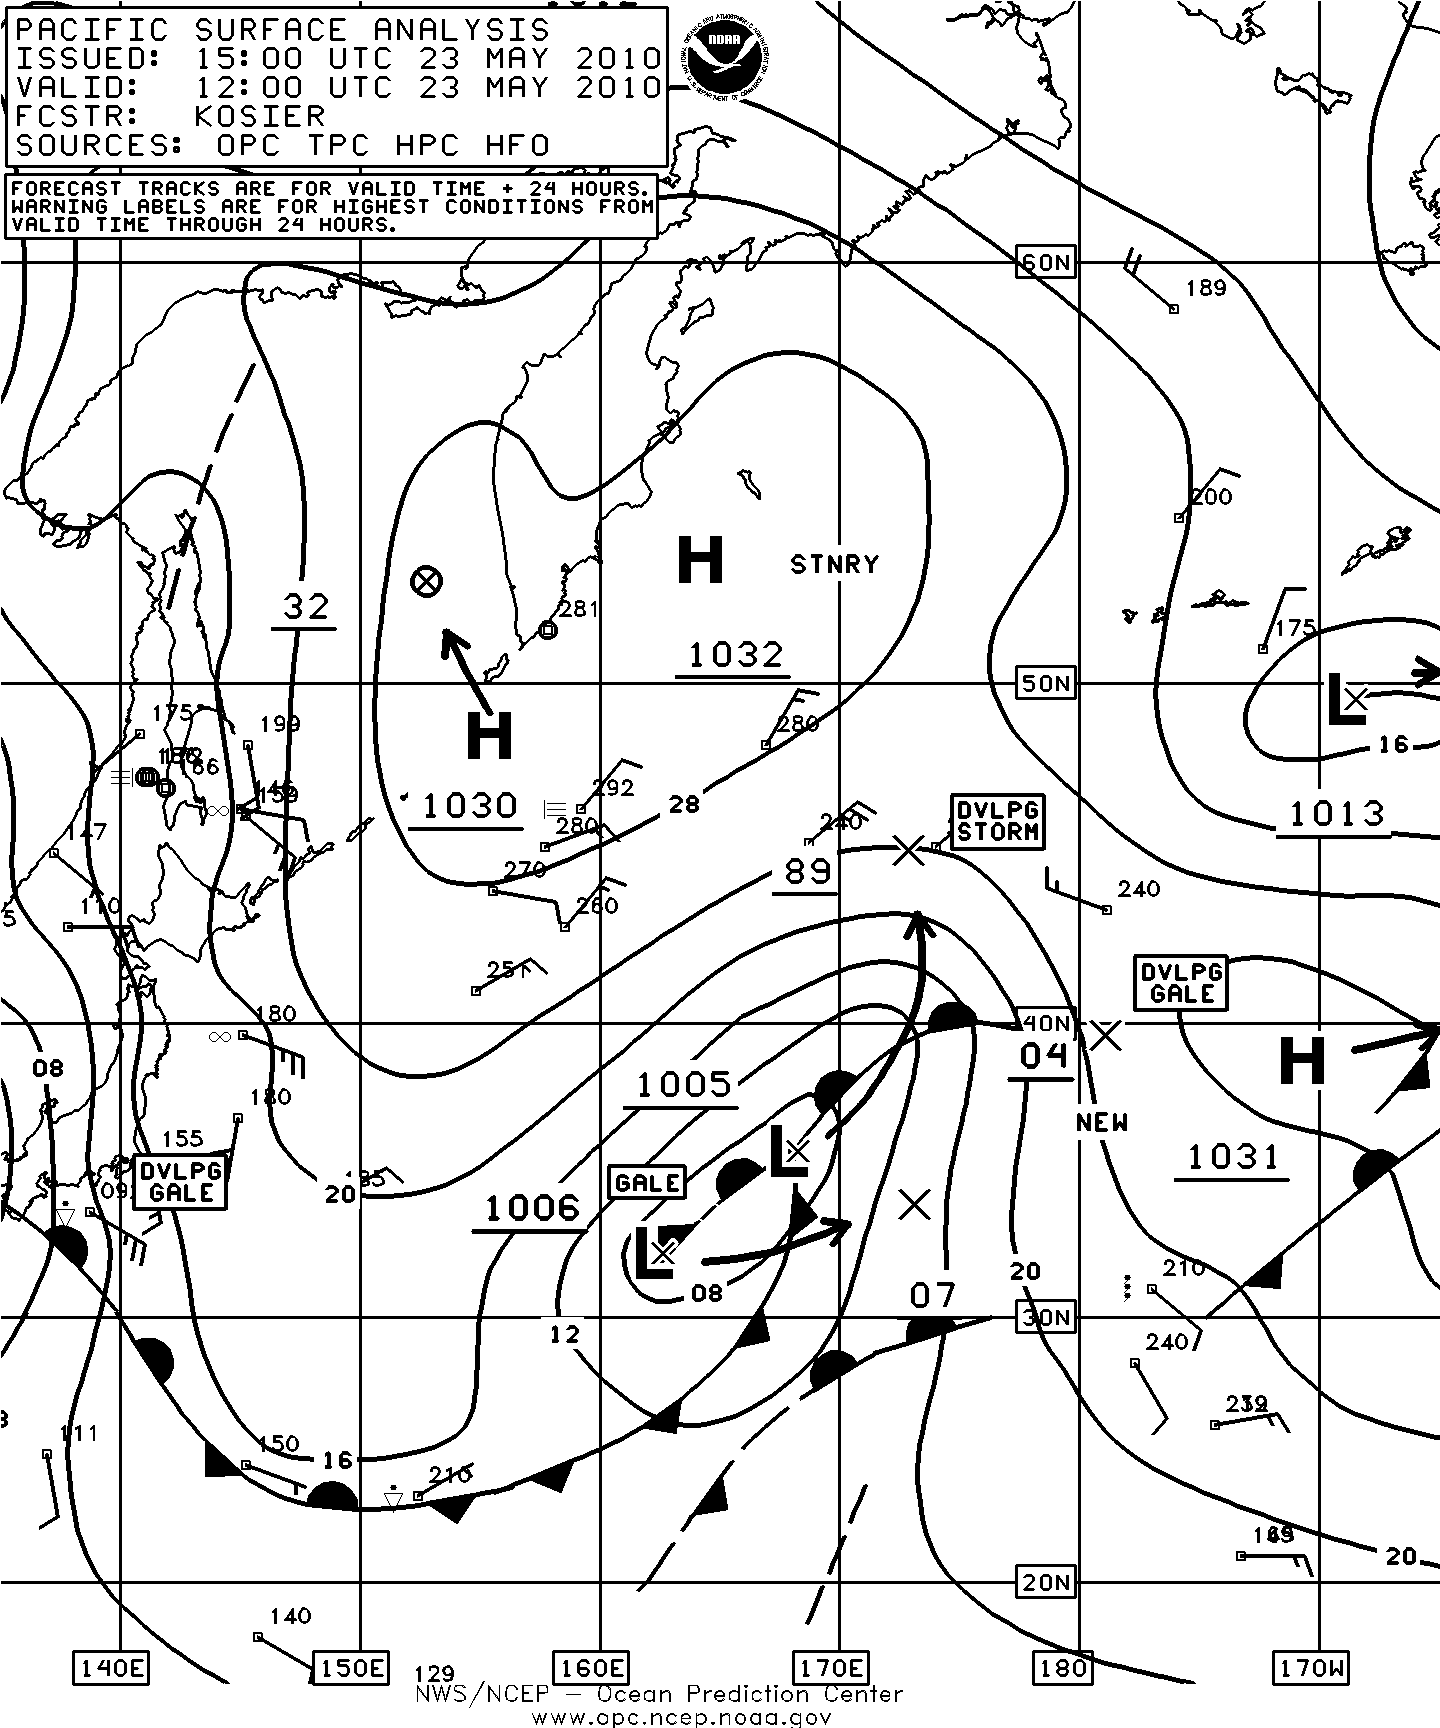
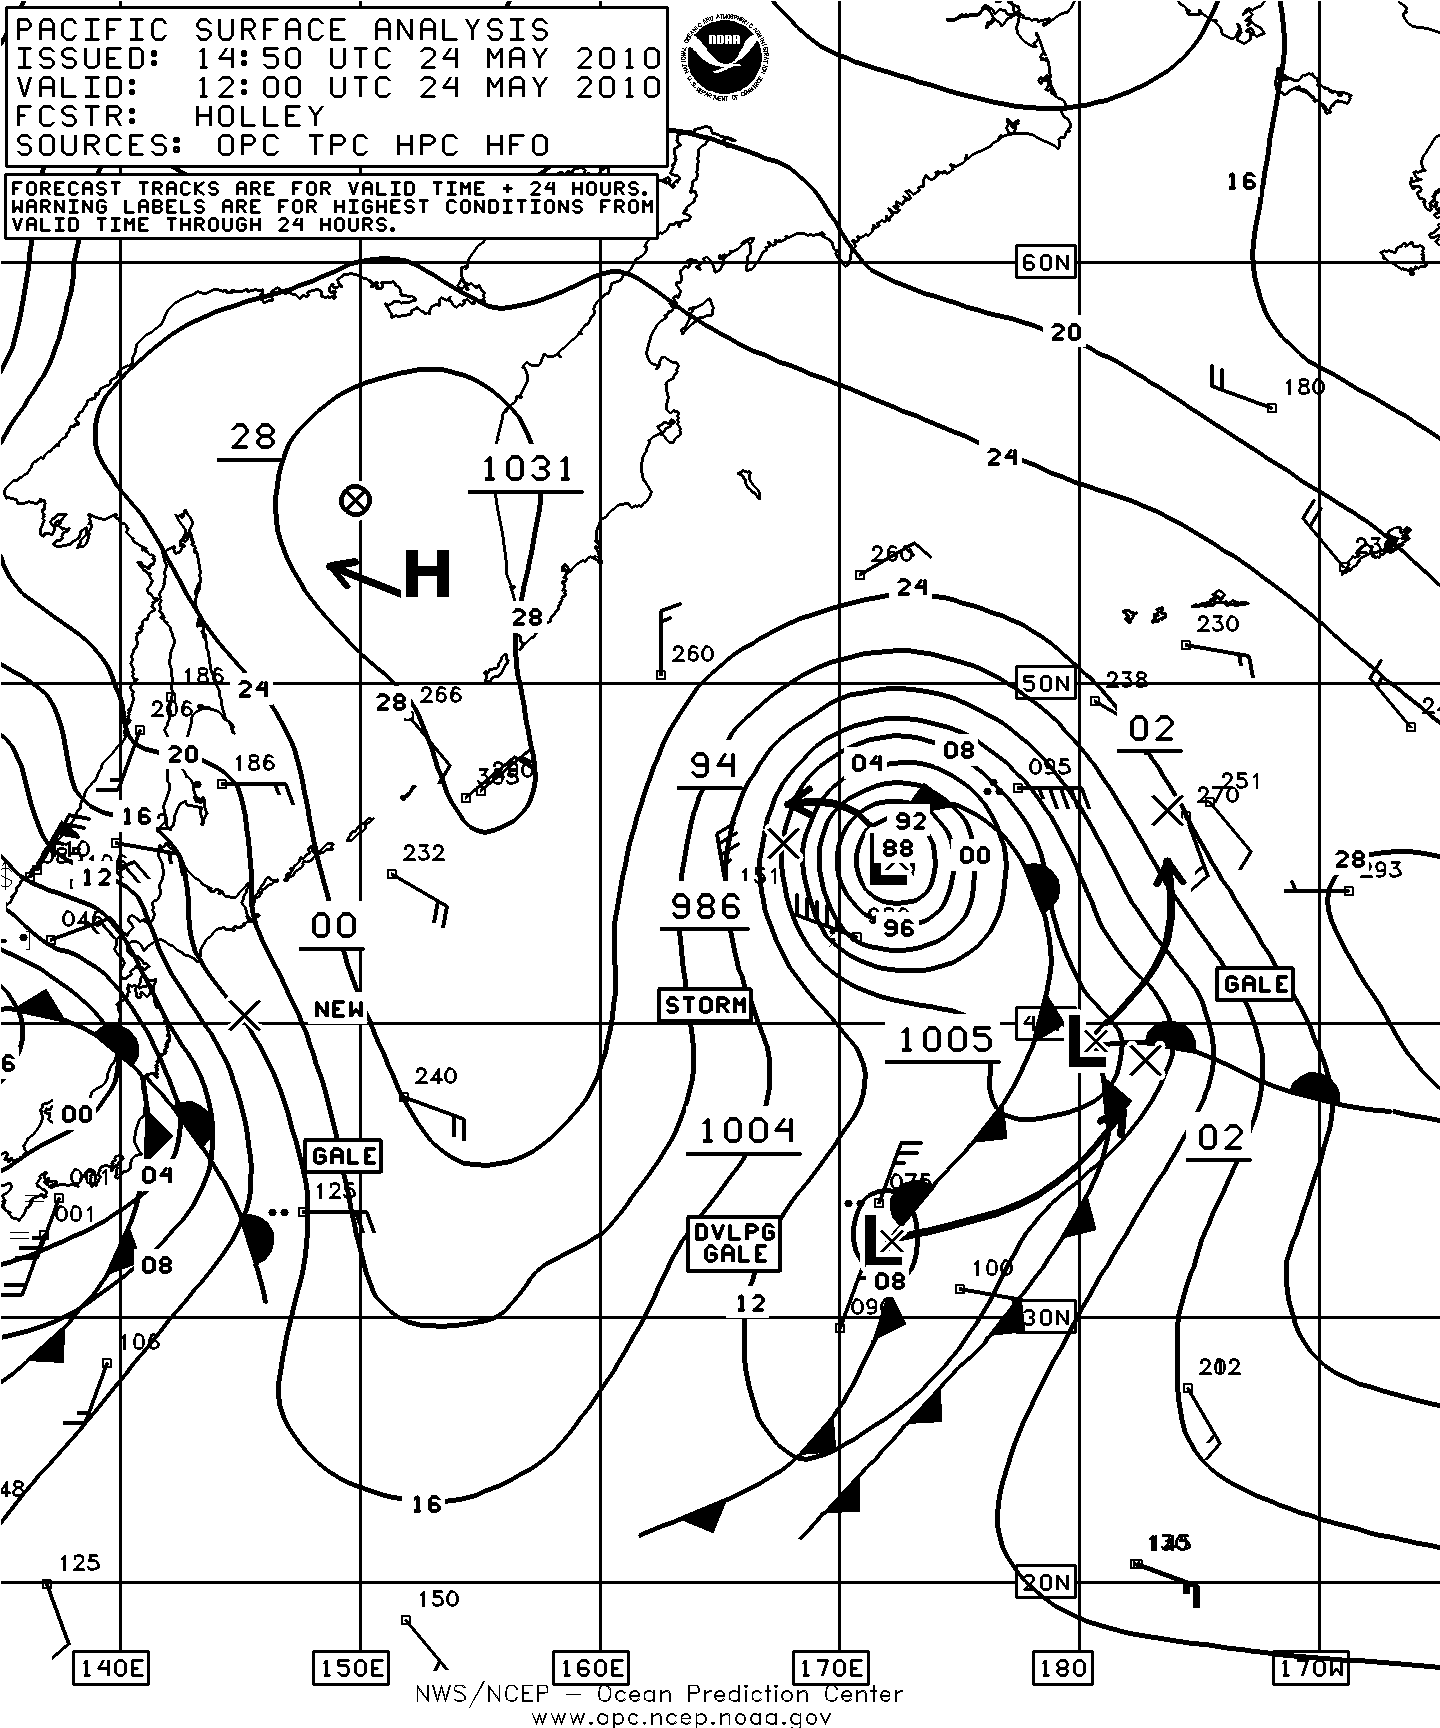
Figure 10. OPC North Pacific Surface Analysis charts valid 1200 UTC May 23 and 24, 2010.(Click to enlarge)
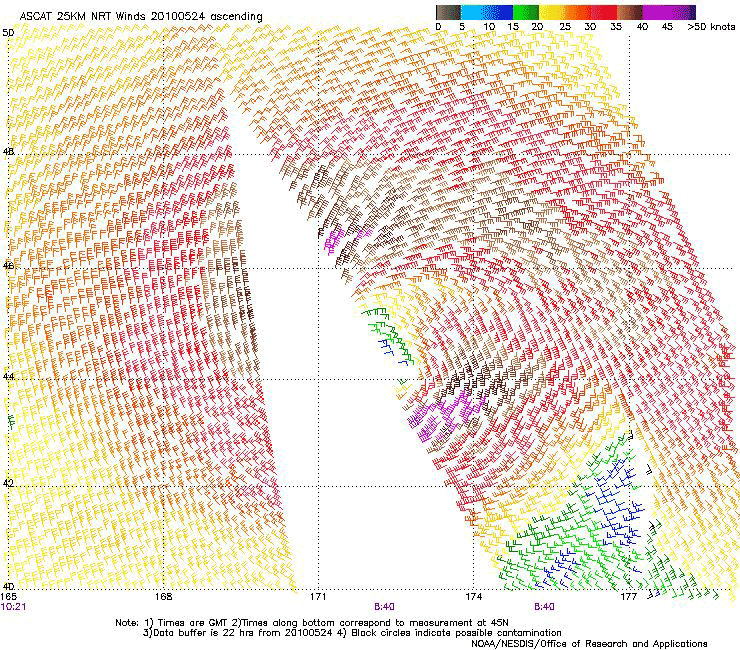
Figure 11.
ASCAT 25 km
scatterometer image of
satellite sensed winds
around the storm shown
in the second part of
Figure 10. The image
contains portions of two
passes valid 0840 UTC
and 1021 UTC May 24,
2010, or less than three
and one-half hours prior
to the valid time of the
second part of Figure
10. The center of the
storm is near the center
of the image. Image
is courtesy of NOAA/
NESDIS Center for
Satellite Application and
Research.
Northeastern Pacific Storm, June 10- 12: Originating as a frontal wave of low pressure in the western North Pacific near 37N 171E early on June 8, the main development of this cyclone is shown in Figure 12. The central pressure fell 20 mb in the twenty four hour period ending at 0600 UTC on the 11th. The lowest central pressure was 976 mb reached eighteen hours later when the center was near 53N 149W. A highresolution ASCAT image in Figure 13 reveals the stronger winds of 33 to 42 kts concentrated on the south side of the storm center and the occluded front, well defined in the image as a boundary between the stronger winds to the west and north and the much lighter winds on the other side. There is a small area of 42 to 48 kts winds southeast of Kodiak Island. The APL Korea (WCX8883) near 49N 154W reported east winds of 40 kts and 6.0 m seas (20 ft) at 1500 UTC on the 10th, followed twelve hours later by a report of southwest winds of 40 kts and 5.0 m seas (16 ft) near 50N 148W. The Beaumagic (PHKH) near 53N 130W reported south winds of 50 kts at 0700 UTC on the 12th. The buoy 46084 (56.6N 136.1W) reported southeast winds of 37 kts with gusts to 45 kts (peak 49 kts) and 3.5 m seas (11 ft) at 2000 UTC June 11, followed by a maximum significant wave height of 6.5 m (21 ft) twenty four hours later. The cyclone subsequently weakened while moving northeast and weakened to a gale early on the 12th, and then turned southeast and dissipated near Southeast Alaska on the 14th.
North Pacific Storm of July 8-9: The only low pressure area to produce storm force winds in July also became the most intense of the period in the North Pacific in terms of central pressure, developing a central pressure of 969 mb. Figure 14 shows the development over a fortyeight hour period from a secondary low forming on the junction of an occluded front, cold and warm fronts known as a triple point. This slow moving system is shown at maximum intensity approaching the central Aleutian Islands, impeded by high pressure over the northern Bering Sea. Storm force winds lasted from the afternoon of the 8th until early on July 9. The slowly weakening cyclone then folowed a track just south of the eastern Aleutians and Alaska Peninsula on the 9th and 10th before dissipating near the southern coast of mainland Alaska on July 11. Some ship and buoy observations taken during passage of this cyclone are listed in Table 4.
| Observation | Position | Date/Time (UTC) | Wind | Seas (m/ft) |
|---|---|---|---|---|
| SHIP | 47N 174E | 07/1800 | SW 40 | 5.0/16 |
| Ocean Harvester (WBO5471) | 53.4N 167.5W | 09/0200 | SE 50 | |
| APL China (WDB3161) | 54N 176W 53N 176E | 09/0600 09/1800 | NE 40 N 45 | 5.5/18 4.0/13 |
| Hong Kong Express (DHEB) | 56N 178W | 09/0600 | NE 35 | 7.0/23 |
| Dominator (WBZ4106) | 54N 178W | 09/0600 | NE 35 | 7.0/23 |
| SHIP | 46N 165W | 10/0600 | SW 35 | 7.9/26 |
| Buoy 46073 | 54.9N 172.0W | 09/0400 09/0900 |
NE 35 | 3.7/12 Maximum 4.5/15 |
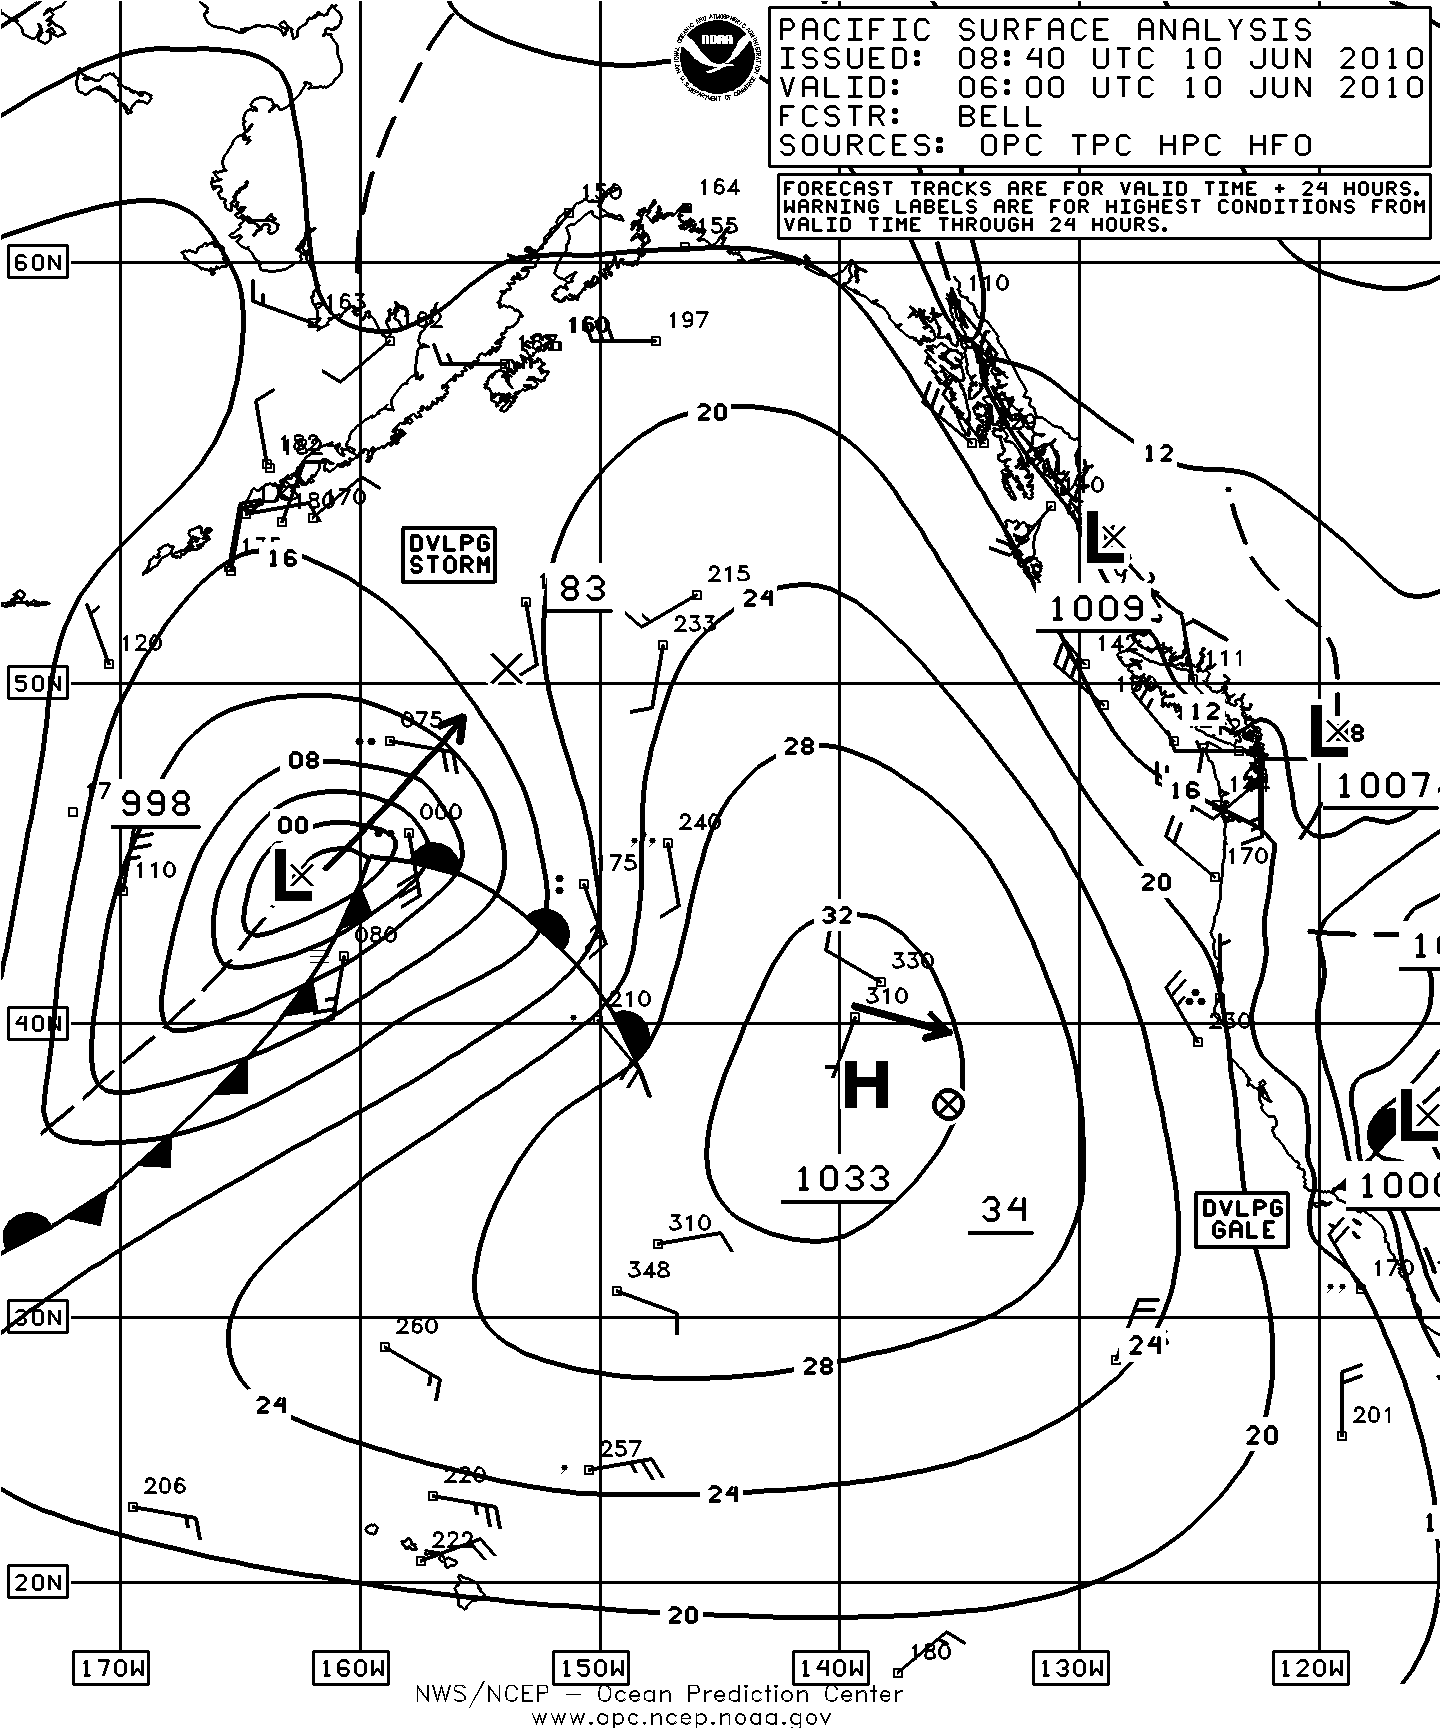
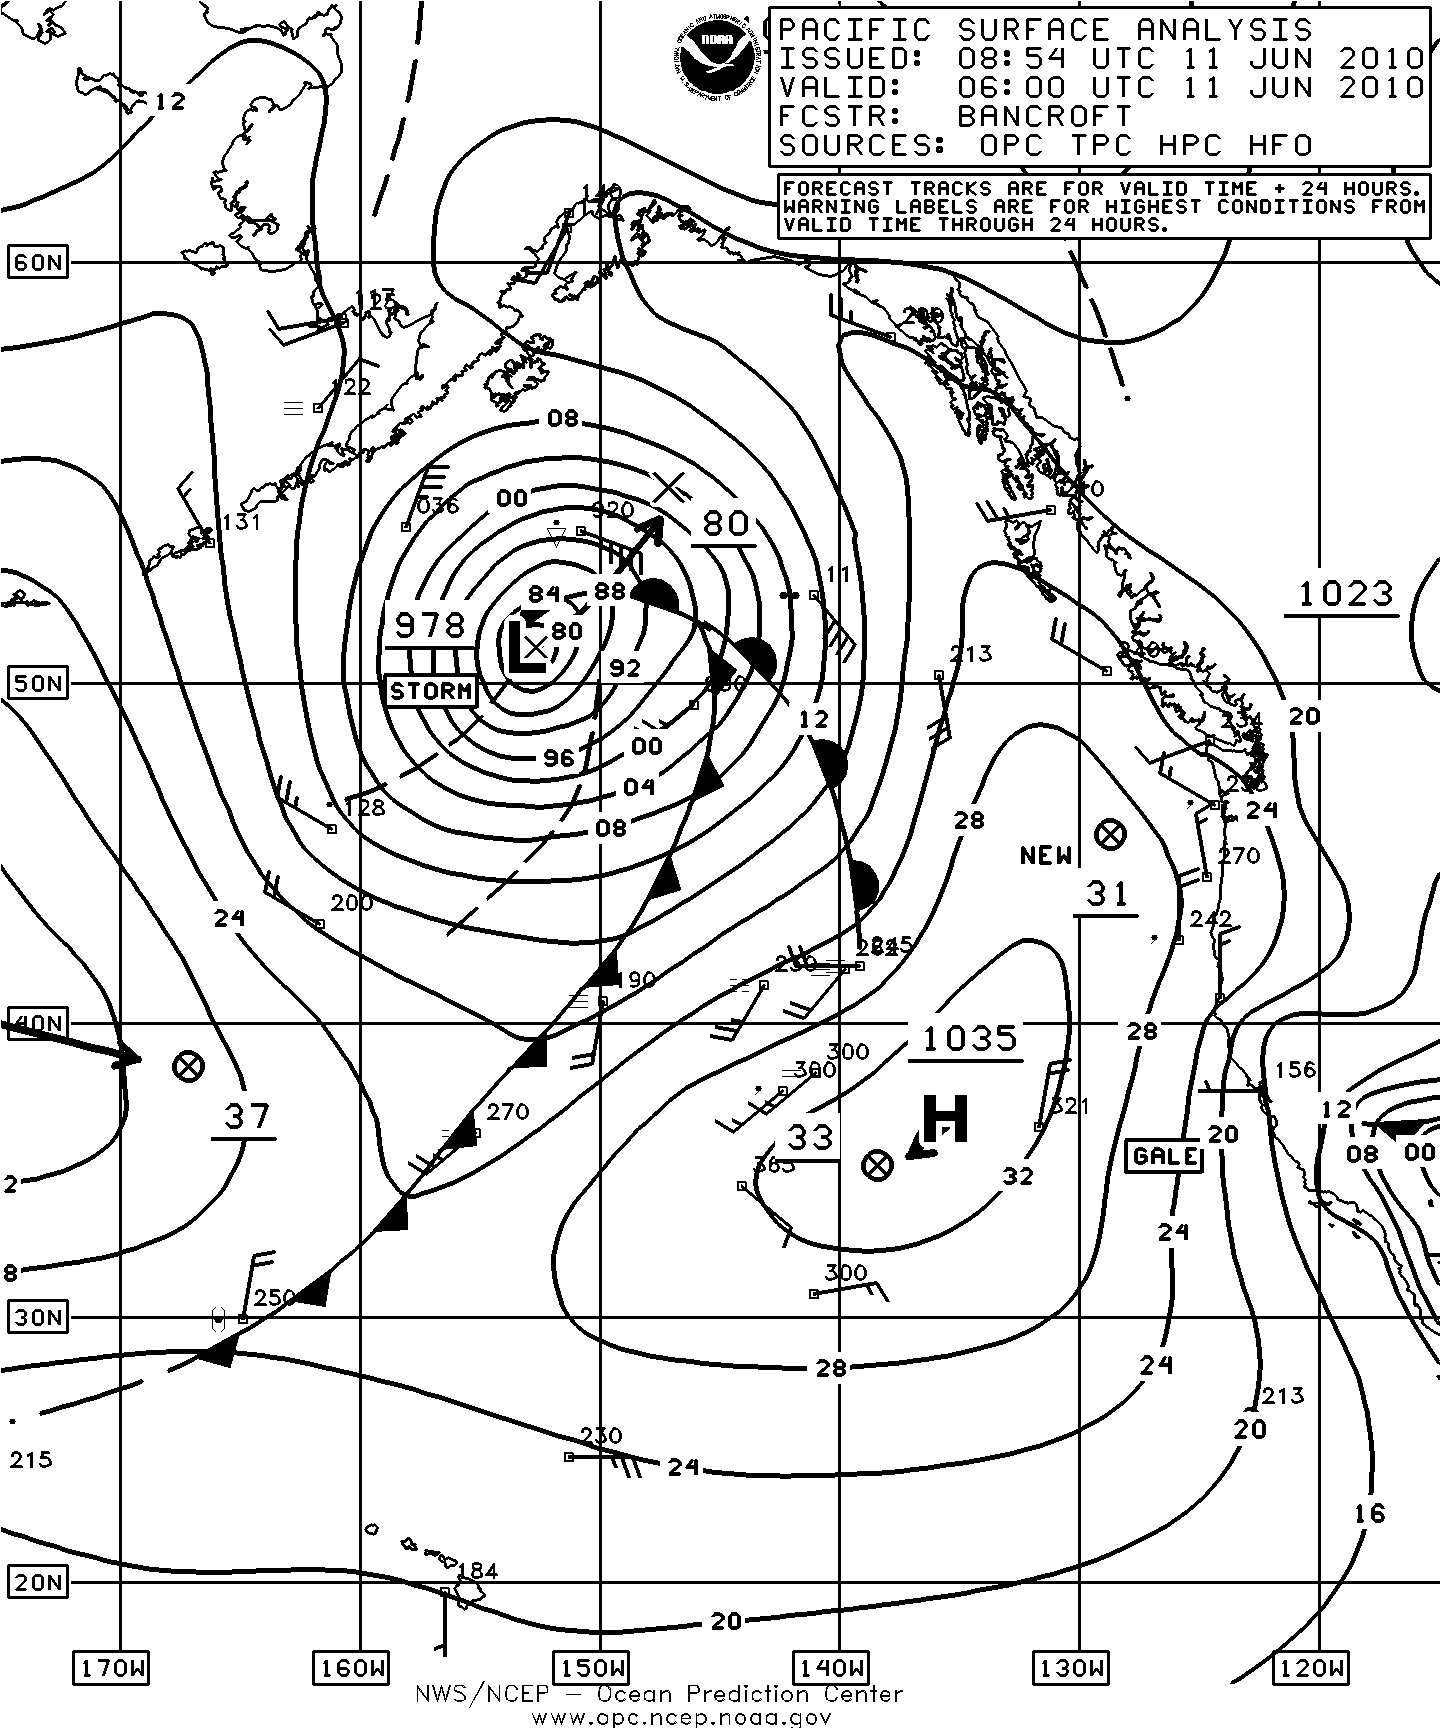
Figure 12. OPC North Pacific Surface Analysis charts valid 0600 UTC June 10 and 11, 2010.
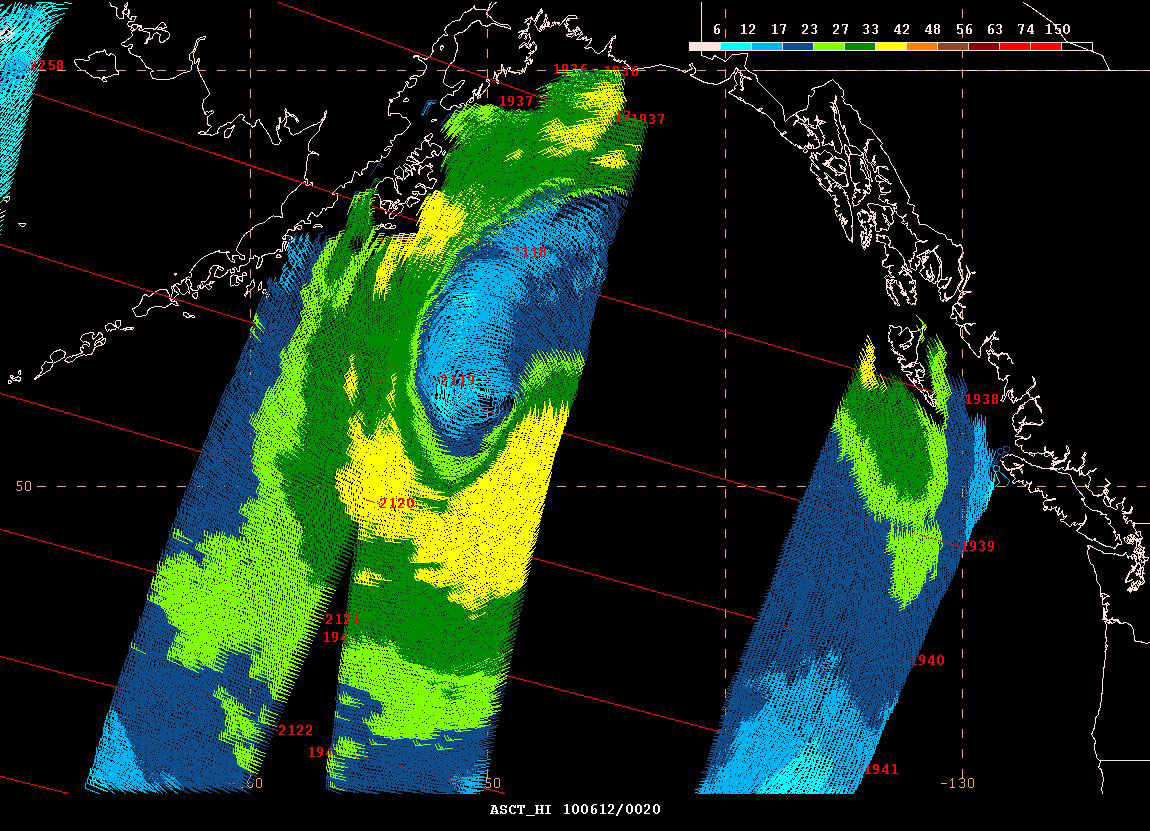
Figure 13. ASCAT 25 km scatterometer image of satellite-sensed winds around the storm shown in the second part of Figure 12. The image contains portions of two passes valid about 1939 UTC and 2120 UTC June 11, 2010, or less than fifteen and one-half hours later than the valid time of the second part of Figure 12. The center of the cyclone is near the center of the image, near 52N 150W. This form of the imagery adapted for OPC operational use contains numbered cross-track time lines (UTC) of the satellite and a color scale for the wind barbs on the upperright side.
Back to top