Tropical Atlantic and Tropical East Pacific Areas May through September 2009
Jessica Schauer Clark, Scott Stripling, and John Cangialosi,
Tropical Analysis and
Forecast Branch,
National Hurricane Center, Miami, Florida
NOAA National Center for Environmental Prediction
North Atlantic Ocean to 31N including the Caribbean Sea and the Gulf of Mexico
There were five non-tropical cyclone related gale events that occurred between 1 May and 15 September 2009 in the area of high seas forecast responsibility of the National Hurricane Centers (NHC) Tropical Analysis and Forecast Branch (TAFB). Table 1 provides details on these events.
| Onset | Region | Peak Wind Speed | Gale Duration | Weather Forcing |
|---|---|---|---|---|
| 0000 UTC 19 May | SW N Atlantic | 40 KT | 54 hr | Low |
| 0000 UTC 20 May | Gulf of Mexico | 40 KT | 30 hr | Low |
| 0600 UTC 16 Jul | Caribbean | 35 KT | 30 hr | Pressure Gradient |
| 1200 UTC 29 Jul | Caribbean | 35 KT | 24 hr | Pressure Gradient |
| 1200 UTC 25 Aug | SW N Atlantic | 45 KT | 18 hr | Low |
May Gale Event in the Atlantic Ocean and Gulf of Mexico
The gale events with the longest duration and largest area of impact occurred from 19 to 21 May when a non-tropical low developed over the Bahamas and slowly moved west into the Gulf of Mexico. The low eventually moved northward into the central Gulf Coast near the border of Alabama and Mississippi. Gale warnings were first issued over the southwest North Atlantic waters at 0000 UTC 19 May when a cold front moved into the region, allowing for a unusually strong pressure gradient over north Florida between high pressure over the mid-Atlantic United States and low pressure over the southwestern Bahamas. As a result, the Saint Augustine Beach Pier (SAUF1) reported winds in the 35 to 40 KT range from 0400-1500 UTC on 19 May. The cold front stalled over northern Florida by 20 May as the low pressure system began migrating west through the Straits of Florida. Figure 1 shows that the pressure gradient remained strong across north Florida on 0000 UTC 20 May. At 0300 UTC and 0600 UTC that day, the ship Horizon Producer (WJBJ) reported 40 KT winds near 30N80W.
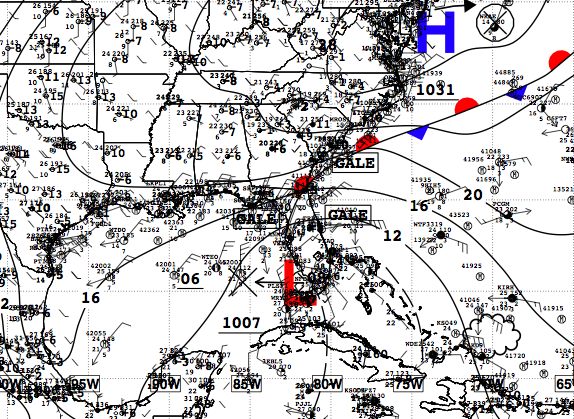
Figure 1. National Weather Service Unified Surface Analysis chart from 0000 UTC 20 May 2009
On 20 May, gale warnings were issued in the Gulf of Mexico due to the strong pressure gradient north of the low pressure system moving west from the Straits of Florida into the southeastern Gulf of Mexico. Tyndall Air Force Base Tower C (SGOF1) near 29N85W had several reports of 35 to 40 KT winds between 2300 UTC 19 May and 1600 UTC 20 May. Buoy 42362 near 28N91W also reported 35 KT winds during the gale period, with winds subsiding below gale force after 0300 UTC 21 May.
Gale conditions diminished in both the Gulf of Mexico and southwest North Atlantic waters at 0600 UTC 21 May. By this time, the stationary front over north Florida had dissipated and the strong high pressure system to the north had migrated eastward into the Atlantic and away from the low in the Gulf of Mexico. Figure 2 shows the system during this post-gale period prior to moving onshore. During its lifetime, this system brought copious amounts of rain to north Florida, with a maximum of 24.41 inches reported at Ormond Beach, FL, between 1200 UTC 18 May and 0200 UTC 21 May. The NHCs Hurricane Specialist Unit monitored this system until it moved onshore near the border of Alabama and Mississippi on 23 May, and it warranted seven special issuances of the TWOAT from 18-23 May, more than a week prior to the start of the Atlantic hurricane season. It is interesting to note that this system did produce sustained gale force winds of 37 KT at the Dauphin Island Alabama CMAN (DPIA1) site near the time of landfall.
Figure 2. Visible satellite imagery, QuikSCAT scatterometer winds, and surface observations from approximately 1500 UTC 22 May after gale conditions had diminished.
July Gales in the Caribbean Sea
Two of the observed gale events occurred in the central Caribbean along the coast of Colombia and a similar synoptic-scale pattern was observed during both events. This pattern was characterized by a strong pressure gradient along the coast of Colombia between climatologically low pressure inland and a high pressure ridge that stretched across the Atlantic and Gulf of Mexico, pushing the 1016-hPa isobar south of the Greater Antilles. Observations from ship Adventure of the Seas (C6SA3) were particularly helpful in observing both of these events. The ship reported 35 KT winds three times on 18 Jul between 0700-1400 UTC as it traveled from 16N62W to 18N65W. Similarly, the ship reported 35 KT winds at 0400 UTC and 0700 UTC on 28 Jul at 14N69W and 13N70W, respectively. Neither Caribbean gale lasted more than 30 hours, and both events ended as the subtropical ridge to the north weakened.
Pre-Danny Disturbance in the Atlantic Ocean
Prior to the development of Tropical Storm Danny, TAFB issued gale warnings from 1200 UTC 25 Aug to 0600 UTC 26 Aug in association with Dannys precursor disturbance as it passed north of the Greater Antilles and moved toward the Bahamas. Figure 1 shows the high resolution (12.5-km) QuikSCAT scatterometer wind retrievals along with ship and buoy observations from around 0000 UTC 26 Aug. At this point, the system is still an open trough without a closed low-level circulation. Figure 3 shows the large wind field associated with the system during the gale event prior to tropical cyclone development. However, it is important to note the amount of rain-flagged QuikSCAT wind vectors in this image (the rain flagged vectors are denoted by an open circle at the base of the barb). A skilled forecaster can tell that these wind retrievals have been artificially inflated by rain contamination. The strongest uncontaminated retrievals in Figure 3 are in the 40 to 45 KT range. Ship observations become increasingly important in cases of widespread rainfall contamination in the scatterometer data. On 26 Aug, Unknown Ship (KS049) made six reports of gale force winds, generally in the 35 to 40 KT range as it moved from near 22N71W at 0000 UTC north-northwest to near 29N73W by 2100 UTC. These reports were critical to forecasters, helping to confirm their assessment of the QuikSCAT scatterometer data. By 1200 UTC 26 Aug, this system developed a closed low-level wind circulation and become Tropical Storm Danny.
Figure 3. QuikSCAT scatterometer wind retrievals and ship and buoy observations from around 0000 UTC 26 Aug. Rain contaminated wind vectors are denoted by an open circle at the base of the barb. This Atlantic gale became Tropical Storm Danny 12 hours later as the system developed a closed low-level wind circulation.
Northeastern Pacific Ocean to 30N and east of 140W
Gales and significant wind or wave events are almost exclusively attributed to tropical systems across the tropical northeast Pacific during the summer months. However, two significant non-tropical marine events were documented from May through August 2009.
Gulf of Tehuantepec
Strong gap wind events in the Gulf of Tehuantepec mainly occur between October and March. However, in 2009 one gale event occurred in May and was related the gale event in the Gulf of Mexico on 19-21 May. In fact, the event commenced in the latter part of the month, 0600 UTC 19 May, and lasted for 36 hours. Unfortunately, due to the rare nature of occurrence this time of year, TAFB forecasters did not provide gale warning lead time, but did forecast winds to 30 KT about 48 hours in advance of the event.
Typical cold season Gulf of Tehuantepec wind events are initiated by strong northerly winds across the western Gulf of Mexico (Cobb et al., 2003). This strong flow, which advects cold air southward, is supported by a steep pressure gradient between strong high pressure over the Gulf of Mexico or the southern United States and lower pressure over the East Pacific Ocean. Terrain variations within the narrow Chivela Pass in southeastern Mexico provide an enhancement to the winds. Although this particular event was not a typical case, cold air advection was a factor. On 18 May a cold front was moving across the Gulf of Mexico and a trough of low pressure developed south of the front near western Cuba. Meanwhile, a 1025+ hPa high pressure system was located over the Mississippi Valley. This surface pressure pattern resulted in strong northerly winds over the southwestern Gulf of Mexico. The northerly wind fetch combined with drainage flow over southern Mexico and produced a marginal 36-hour gale event over the Gulf of Tehuantepec.
Figure 4 shows this pressure pattern and a 40 KT wind report from the Paris Express (DIHE) valid at 0000 UTC 20 May. In addition, a QuikSCAT pass at about the same time, 0011 UTC 20 May, revealed a swath of 25 to 35 KT north to northeast winds with an isolated 40 KT wind vector. (Figure 5). The front weakened and the high shifted east off the mid-Atlantic coast early on 20 May. This pattern allowed winds to diminish over the western Gulf of Mexico, which limited funneling through the Gulf of Tehuantepec.
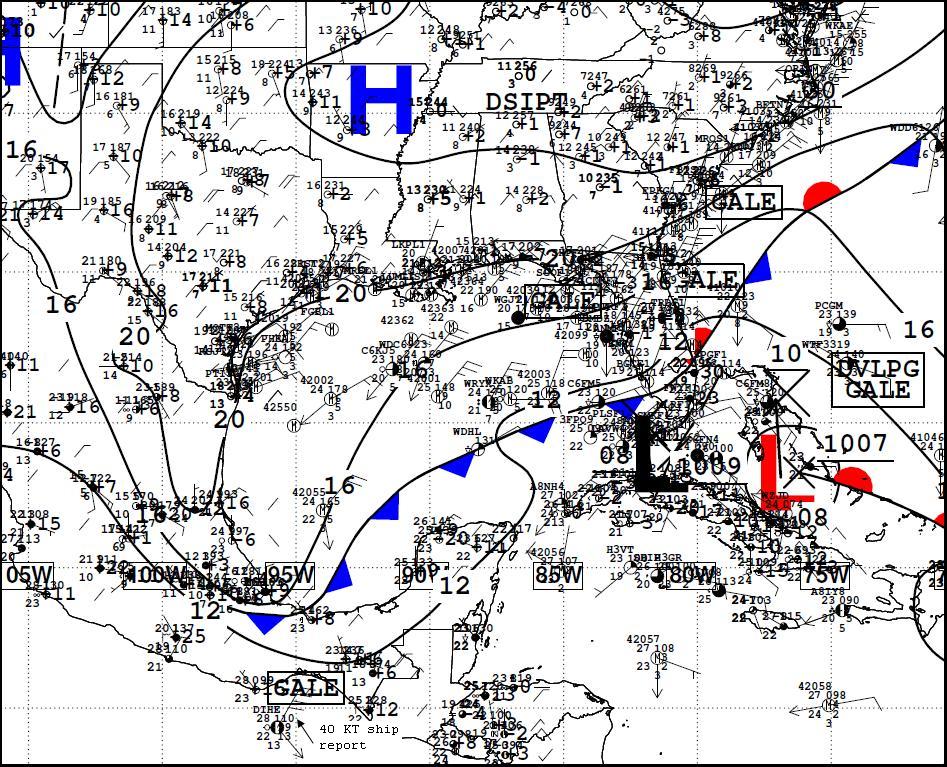
Figure 4. Surface analysis at 0000 UTC 20 May 2009

Figure 5. A QuikSCAT pass across the Gulf of Tehuantepec from 0011 UTC on 20 May 2009.
Large July Swell Event
Frequent pulses of southern hemispheric swell are common across the northeast Pacific waters during the late spring and summer months as austral cold fronts and lows increase in intensity and traverse the south Pacific. However, in mid July, the evolution of a strong cyclone over the south Pacific produced the largest swell event for the May through August 2009 period and the largest breaking waves seen in several years during the summer months along the Pacific coast of California, Mexico and Central America. TAFB forecasters recognized the significance of this event and began including statements in the northeast Pacific high seas forecasts and tropical weather discussions 48 hours prior to the onset of this event in the TAFB AOR.
NOAAs Wavewatch III model and several other wave models began to indicate a large very long period southwest swell event moving into the region several days in advance of this event. Wavewatch III forecast the leading edge of largest pulse of this swell to move across the equator late on 19 Jul with peak periods near 20 seconds, with swell heights gradually increasing to 6 ft and greater by 21 Jul. The leading edge of this large pulse of swell began to reach the coastline of Central America and southern Mexico on 23 Jul at 20-21 seconds, and reached southern and central California early on 24 Jul. During the next 4 to 5 days, large and very long period southwest to south-southwest swell propagating into the coastal zones of the tropical and subtropical Eastern Pacific created large and powerful breaking waves and very dangerous surf along the coast from Panama to California. This resulted in the closure of some channels and harbor entrances, and generated extremely powerful and dangerous rip currents. Model forecasts from Wavewatch III were slightly lower than buoy observations from southern California, which indicated that the peak wave energy across the region was near 3-m (10 ft) at 16-18 seconds, which produced 20 ft breakers at several locations.
The parent weather system that spawned these large swells occurred well outside the TAFB AOR. In cases like this, remotely sensed data is imperative for detecting and monitoring distant weather systems. QuikSCAT passes across the south central Pacific several days earlier revealed the evolution of a large and intense low pressure system that global models analyzed as a 980 hPa low centered near 38S 132W at 1200 UTC 18 Jul, likely at or near its peak intensity. A 0314 UTC QuikSCAT pass on 18 Jul (Figure 6) showed an extremely large wind field associated with this low with a 500 nm wide fetch of gale force winds across the entire western semicircle. The resulting swells were directed at the tropical northeast Pacific. Much of this area included 40 to 50 KT winds, with a narrow 120 x 200 nm band of 50 to 55 KT winds, and some isolated hurricane force wind vectors indicated. This QuikSCAT image depicts a very large and powerful storm system at or near hurricane-force intensity that could have been deeper than 980 hPa. A review of the previous days surface pressure charts over that region from the Australian Bureau of Meteorology shows an evolving and dynamic fetch of south to southwesterly winds that set up several hundred miles east of New Zealand as a series of low pressure systems moved east and northeastward and merged, culminating in the development of this 980 hPa low.
No buoys with wave sensors currently exist across the tropical northeast Pacific to measure or verify this swell event. However, a relatively dense network of buoys is available along the California coastline, beginning over the waters near the Mexico-California border. Data from these regional buoys clearly show the arrival, peak and slow decay of this strong swell event. CDIP buoy 067 data near San Nicolas Island, California, is shown here for illustration, as it is located well offshore in deep water (335 m) and gives us the opportunity to observe the deep-water energy of this event, before any shallow water processes occurred. Figure 7 shows the monthly summary of buoy data, with significant wave height (m), peak period (s), and dominant direction. The buoy data show that just prior to 0000 UTC on 24 Jul, very long period south-southwest swell at 20 seconds reached the buoy and began to overtake the prevailing northwest wind waves of 7 seconds as the dominant seas. Within 12 hours the significant wave heights had increased to 2.8 m (9 ft) and began to peak by 00 UTC 25 Jul at 3-m (10 ft) and 17 seconds.
Another perspective of this event across the regional waters is shown in Figure 8, a cumulative monthly wave energy spectrum analysis for this same buoy near San Nicolas Island, California. Each horizontal line here represents the peak wave energy measured at the buoy, distributed by wave period, which is located at the bottom of the figure. Thus one can easily view the typical wave periods, and the various wave events that have reached the buoy. Highlighted on this figure is this multi-day event, indicated by large very long period south-southwest swells, initially arriving at low heights, peaking a few days later, and then slowly fading in height as the wave length gradually decreased.
NOAAs Wavewatch III model, driven by the GFS model winds, modestly under-forecast the wave heights with this event, but gave a clear indication that a large and very long period swell event would affect the entire TAFB AOR.
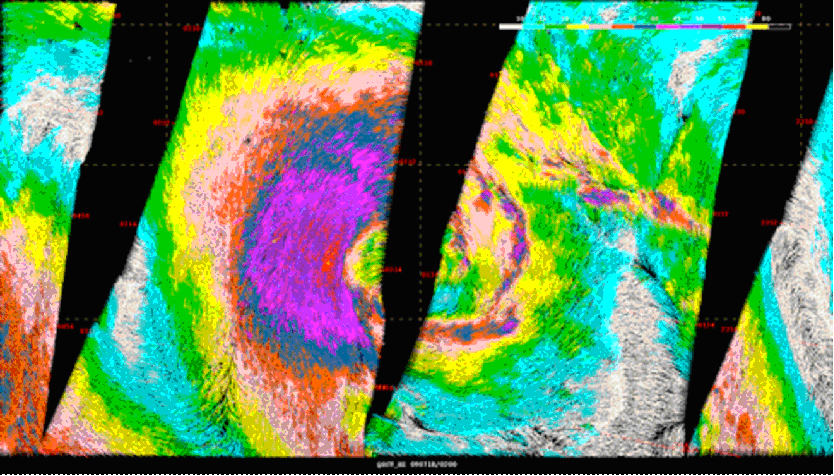
Figure 6. High resolution 0314 UTC 18 July 2009 QuikSCAT pass over the strong south Pacific storm system.
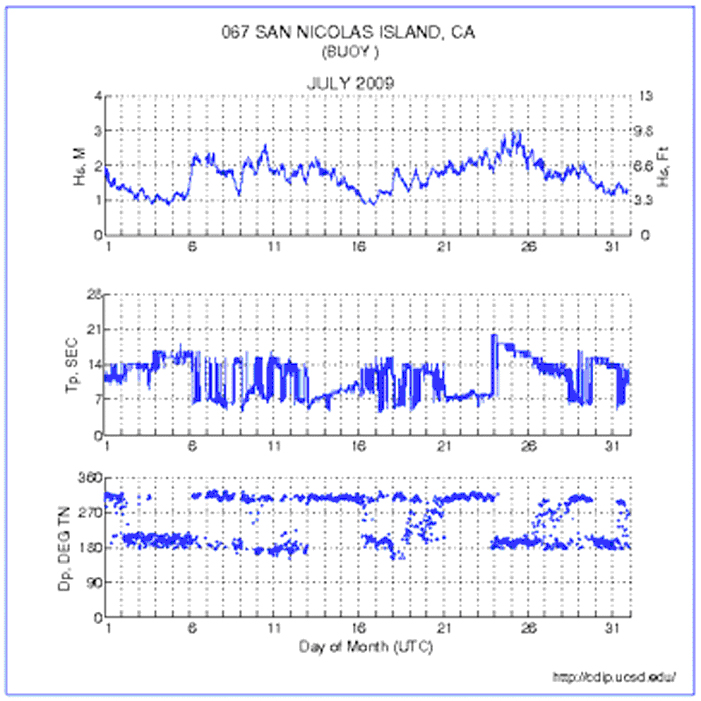
Figure 7. Monthly summary of data from buoy CDIP buoy 067 San Nicolas Island, CA for July 2009.
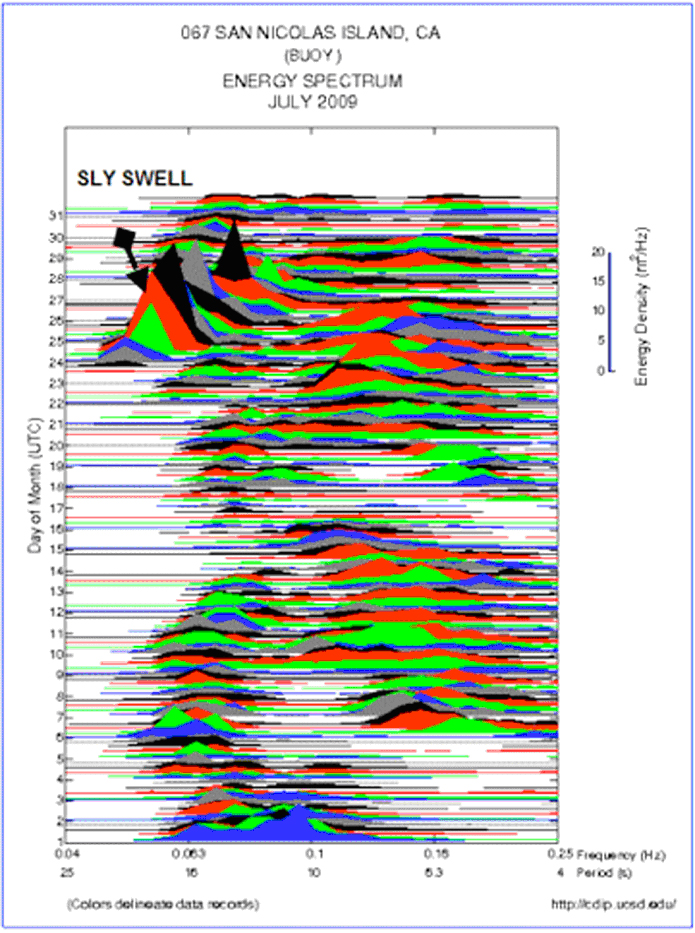
Figure 8. Monthly wave energy spectrum distribution for CDIP buoy 067 San Nicolas Island, CA for July 2009.
References
Cobb, H.D., D.P. Brown, and R. Molleda, 2003: The use of QuikSCAT imagery in the diagnosis and detection of Gulf of Tehuantepec wind events 1999-2002. Preprints 12th Conference on Satellite Meteorology and Oceanography. Long Beach, CA 9-13 Feb. 2003. PP 410.
Back to top