Recent Temperature Trends in the Gulf of Mexico Region
Introduction
According to a recent report by Karl et al. (2009) concerning climate change, environmental warming is occurring to some degree throughout the United States. If left unchecked, increasing ambient temperatures will ultimately impose signifi cant impacts to water, energy, transportation, agriculture, ecosystems, and health. For the southeastern U.S. including the Gulf of Mexico coastal states, some potential consequences are changes in the intensity and pattern of rainfall and drought; increased illness due to heat stress; changes in agricultural and forest growth; decline in dissolved oxygen levels in shallow water bodies leading to fi sh kills; increases in hurricane intensity; and accelerated coastal inundation due to rising sea levels and storm surge. Th us, marine activities will be directly aff ected from navigational, productivity (fi sheries), and safety points of view.
Th e fi ndings presented by Karl et al. (2009) relied on projections of future climate change based on the careful analyses of outputs from global climate models run on the worlds most advanced supercomputers. On the other hand, Keim et al. (2008) note that climate models currently lack the spatial and temporal detail needed to make confi dent projections or forecasts for a number of variables, especially on small spatial scales. Th erefore, the purpose of this brief study is to examine the records of pertinent surface stations in the Gulf of Mexico region, and to compare those temperature trends with model projections.
Data
Meteorological records were acquired from three primary sources. Th e National Data Buoy Center (NDBC) maintains an extensive network of coastal and marine surface observing stations, utilizing both moored buoys and fi xed structures (see http://www.ndbc.noaa.gov/). Nine Coastal-Marine Automated Network (C-MAN) stations and ten buoys extending from the shoreline to the deep Gulf were used. Local Climate Data (LCD) reports for seven coastal cities were obtained from the National Climatic Data Center (NCDC). Radiosonde records from Brownsville, Texas, Lake Charles, Louisiana, and Tampa and Key West, Florida were taken from the Radiosonde Data for North America CD series produced by the NCDC. More recent data was downloaded from the NOAA/ ESRL Radiosonde Database (http://raob.fsl.noaa.gov/). Th e approximate locations and distribution of all stations is shown in Fig. 1.
Analyses and Results
Monthly air and sea temperatures were either recorded or computed for all stations. Only those months less than 75% complete were excluded. Th e data records were not manipulated or smoothed in any way; a simple linear trend line was fi t to each time-series record. Most of the NDBC station records are at least 10-15 years in length, however it should be noted that gaps appeared in many records due to missing or incomplete months. Th is is particularly true for sea temperature records.
Karl et al. (2009) employed low and high emission scenarios to project a range of future temperature increases. Th e diff erence between the scenarios resulted from diff erences in assumptions about changes in population, rate of adoption of new technologies, economic growth, and other factors. Under the low emissions, average temperatures in the Southeast U.S. are projected to rise by about 4.5/F by the 2080s, while the high emissions scenario yields about 9/F increase (with about 10.5/F increase in summer, and a much higher heat index). If we assume a uniform increase over the 70 years until 2080, then average temperatures must rise between 0.064/ and 0.129/F per year. Th is range is in good agreement with results from Keim et al. (2008), who projected a rise of 2/ to 4/F by 2050 (or 0.05/ to 0.10/F/yr).
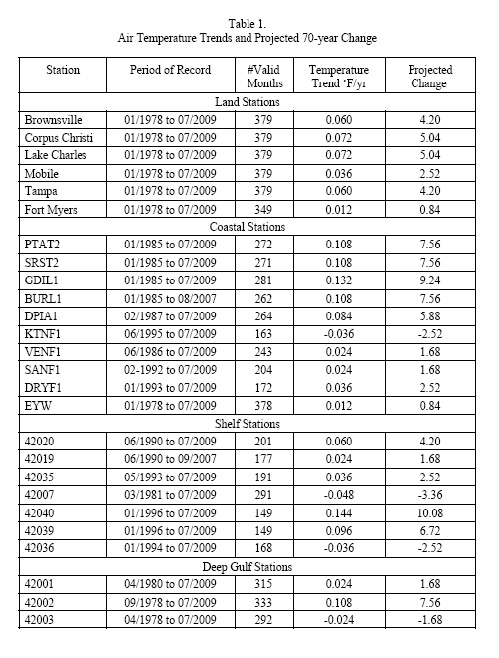
Results are listed in Table 1 for air temperatures. An increasing trend exists at almost all stations, ranging from about 0.01/ to 0.14/F/yr with an average of 0.05/F/yr. Several of the coastal cities and C-MAN locations approach or exceed the low emission projection, along with three of the buoys. Of these, it is noted that buoys 42039 and 42040 in the northern Gulf had the shortest duration records (1996-2009). Nevertheless, it is seen that the largest increases occur in the northwestern Gulf region while in the northeast many stations exhibit lesser values or cooling trends.
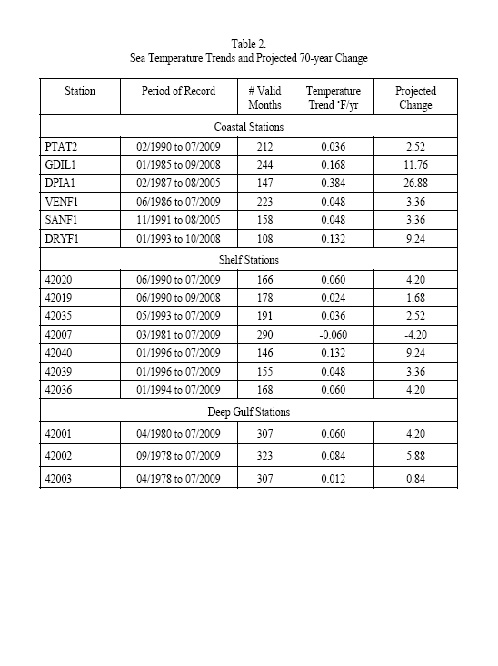
Trends in sea surface temperatures across the Gulf also are increasing, as shown in Table 2. Although these records were oft en incomplete, reasonable agreement is found with an average increase of about 0.08/F/yr.
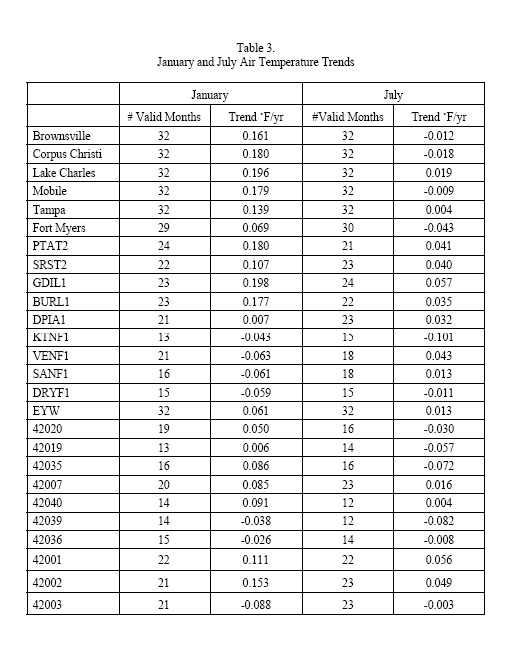
In order to examine seasonality, air temperature trends for the months of January and July are provided in Table 3. On average, much greater increases occur in January (0.07/F/yr) than July (approximately 0). Hence, it is inferred that winters are getting warmer while summers are mostly unchanged. Th is fi nding is opposite that of Keim et al. (2008), who concluded that greatest increases would be seen during summer. Again, the cooling trend in the northeast Gulf is evident in January.
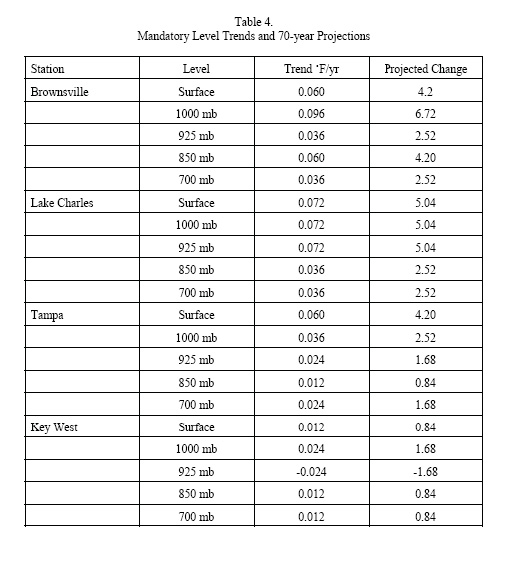
Finally, since sea surface and near surface air temperature trends are generally increasing, are temperatures at higher levels of the atmosphere rising correspondingly? Radiosonde data at four near coast stations were analyzed at the mandatory levels of 1000, 925, 850, and 700 mb (approximately 100, 800, 1500, and 3000 m, respectively). For a well-mixed atmosphere, only 00Z (early evening local time) soundings were used. From Table 4, increasing trends are found at most levels, diminishing with altitude. As before, little change is found at the Florida stations as compared to Lake Charles and Brownsville to the west.
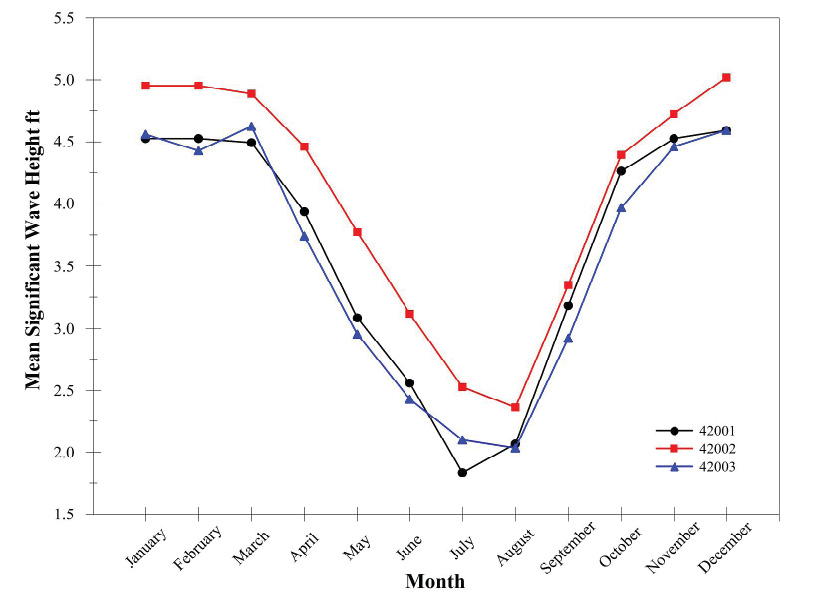
Rising sea and air temperatures suggest an increasingly convective environment, and hence the potential for more frequent storm formation. Maritime storms can quickly generate high winds and rough seas, therefore the wave records from the deep Gulf buoys (42001, 42002, and 42003) were briefl y reviewed. Although the trends found were positive and greater in January than July, they were on the order of only 0.01 ft /yr or less. Little variation in mean signifi cant wave height is found across the Gulf, as shown in Figure 2.
Summary
Linear trend lines were fi t to monthly temperature records for multiple stations in the Gulf of Mexico region. During the approximate 30 year period of 1978 to 2009, increasing trends were found at almost all stations for near-surface and elevated air as well as sea surface. Greater increases occur over the northwestern Gulf while lesser or slight cooling is seen at several stations in the northeastern Gulf region. Rates of warming are generally more pronounced in the winter than the summer months.
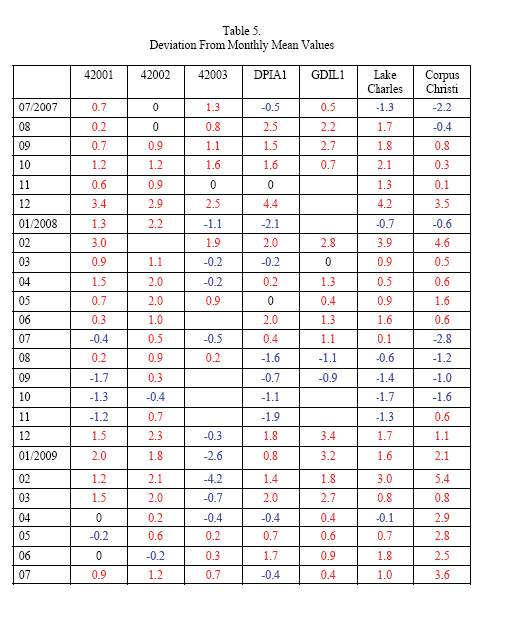
The projected average temperature increases discussed here and those supplied by Karl et al. (2009) and Keim et al. (2008) assume a constant increase over time based on the historical trend. On the other hand, the deviations of monthly temperatures from their respective period means are listed in Table 5 for the 2-year period ending in July 2009. Although above average conditions prevail, equal or below average months occur between about 15-45% of the period. Th us, the long-term increases will likely be tempered from these projected values. It is recommended that analyses be continued as these marine databases continue to build.
References
Karl, T. R., J. M. Melillo, and T. C. Peterson, 2009, Global Climate Change Impacts in the United States, Cambridge University Press, 196 pp.
Keim, B. D., T. W. Doyle, V. R. Burkett, I. Van Heerdon, S. A. Binsalam, M. F. Wehner, C. Tebaldi, T. G. Houston, and D. M. Beagan, 2008: How is the Gulf Coast Climate Changing? In: Impacts of Climate Change and Variability on Transportation Systems and Infrastructure: Gulf Coast Study, Phase 1. A Report by the U.S. Climate Change Science Program and the Subcommittee on Global Change Research [Savonis, M. J., V. R. Burkett, and J. R. Potter (eds.)]. Department of Transportation, Washington, DC, USA, 445 pp.
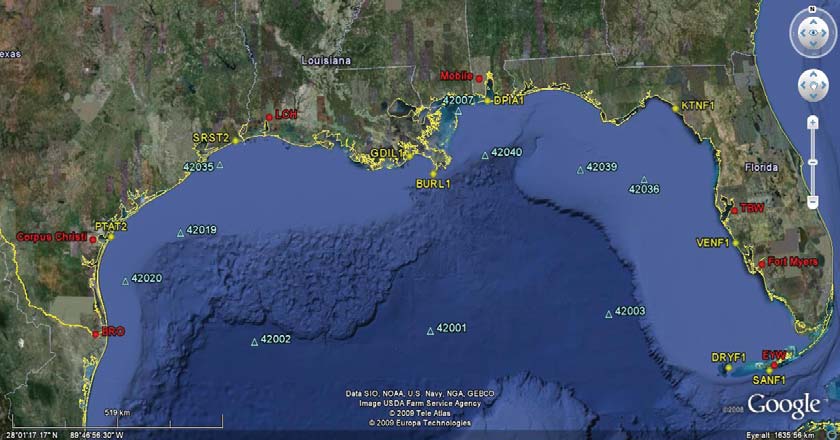
Figure 1. Google Earth image depicting the locations of meteorological stations used in this study. Red indicates radiosonde and LCD stations, yellow is NDBC C-MAN, and light blue NDBC buoys.
Return