Marine Weather Review North Atlantic Area May to August 2009
By George P. Bancroft NOAA National Center for Environmental Prediction
Introduction
The period of May to August 2009 includes the late spring and summer months. Although cyclonic activity normally decreases during the period through July, the North Atlantic continued to produce cyclones with storm force winds during this period with May being most active. Two of these produced hurricane force winds briefly late in May and late in June. The first three weeks of August were relatively quiet, followed by increasing activity in late August as fall approached. Most of the lows originated near the Canadian or northeast U.S. coasts and intensified as they moved northeast or east out over the North Atlantic toward northwestern Europe and the Scandinavian countries. Blocking high pressure especially from June into August in the area of Greenland and Iceland caused low pressure systems to stall or move erratically upon reaching northern waters.
Three tropical cyclones affected OPCs marine area of responsibility north of 31N during the period which includes the first half of the Atlantic hurricane season. Tropical Depression One formed off the U.S. mid Atlantic coast late in May, followed by Hurricane Bill moving through OPC's southwestern waters late in August and Tropical Storm Danny at the end of August. Of these, only Bill eventually became a storm force low after becoming extratropical.
Tropical Activity
Tropical Depression One: The National Hurricane Center initiated advisories on the first tropical system of 2009 on the morning of May 28 when a non tropical low developed tropical characteristics 150 nmi northeast of Cape Hatteras (Figure 8). Maximum sustained winds were 30 kts with gusts to 40 kts. The cyclone was short lived, tracking northeast over the following day before degenerating to a remnant low at 0000 UTC May 30 about 300 nmi southeast of Halifax, and then becoming absorbed by a stationary front shortly thereafter. The Star Florida (LAVW4) reported southwest winds of 30 kts and 6.0 m seas (20 ft) at 2300 UTC May 28.
Hurricane Bill: Formerly a major hurricane south of OPCs waters, Bill moved north into OPCs southwestern waters near 68W as a slowly weakening hurricane on the evening of August 21 with maximum sustained winds of 90 kts with gusts to 110 kts, category 2 on the Saffir-Simpson scale of intensity (Reference 1). The cyclone moved to just south of Georges Bank twenty-four hours later with 75 kts maximum sustained winds and gusts to 90 kts, and then turned northeast. The center passed near the buoy 44011 (41.1N 66.6W) at 0800 UTC on the 23rd where the pressure fell 11.1 hPa in one hour and the lowest pressure was 965 hPa one hour later. Some notable observations taken in this event are listed in Table 1. Figures 1 and 2 shows the subsequent movement of Bill along the coast of Nova Scotia and across the island of Newfoundland while undergoing transition to an extratropical storm over a twenty-four hour period. Figure 3 is a visible satellite image of Hurricane Bill with its apparent eye south of Cape Sable, Nova Scotia, but approaching the east-west broad frontal cloud band over the Canadian Maritime Provinces. As an extratropical low Bill developed a lowest central pressure of 980 hPa at mid-ocean early on the 25th but its top winds weakened to gale force at that time. The cyclone then weakened to a sub gale force low as it crossed Great Britain and the Norwegian Sea on the 26th and 27th.
| Observation | Position | Date/Time (UTC) | Wind | Seas (m/ft) |
|---|---|---|---|---|
| Dresden Express (DHDE) | 44N 49W | 24/1200 | SW 38 | |
| Buoy 41048 | 32N 69.6W | 22/0900 | NW 45 | 5.5/18 |
| Buoy 44008 | 40.5N 69.2W | 23/0400 | NE 30 | 7.5/24 |
| 23/0700 | Maximum 8.0/27 | |||
| Buoy 44011 | 41.1N 66.6W | 23/0800 | E 40 G52 | 10.535 |
| Buoy 44137 | 42.2N 61.9W | 23/1500 | SW 45 | 14.0/46 |
| Buoy 44150 | 42.5N 64W | 23/1100 | SE 45 G62 | 8.5/28 |
| 23/1300 | S 60 | 12.0/40 | ||
| 23/1300 | S 60 | 12.0/40 | ||
| 23/1400 | SW 55 | 13.5/44 | ||
| Buoy 44636 | 45.7N 56W | 23/2300 | SE 54 | |
| 24/0300 | SW 60 | |||
| Hibernia Platform (VEP717) | 46.7N 48.7W | 24/0900 | SW 80 | |
| Henry Goodrich (HP6038) | 46.7N 48.4W | 24/0900 | SW 45 | 4.5/14 |
| Terra Nova (VCXF) | 46.4N 48.4W | 24/1500 | NW 47 |
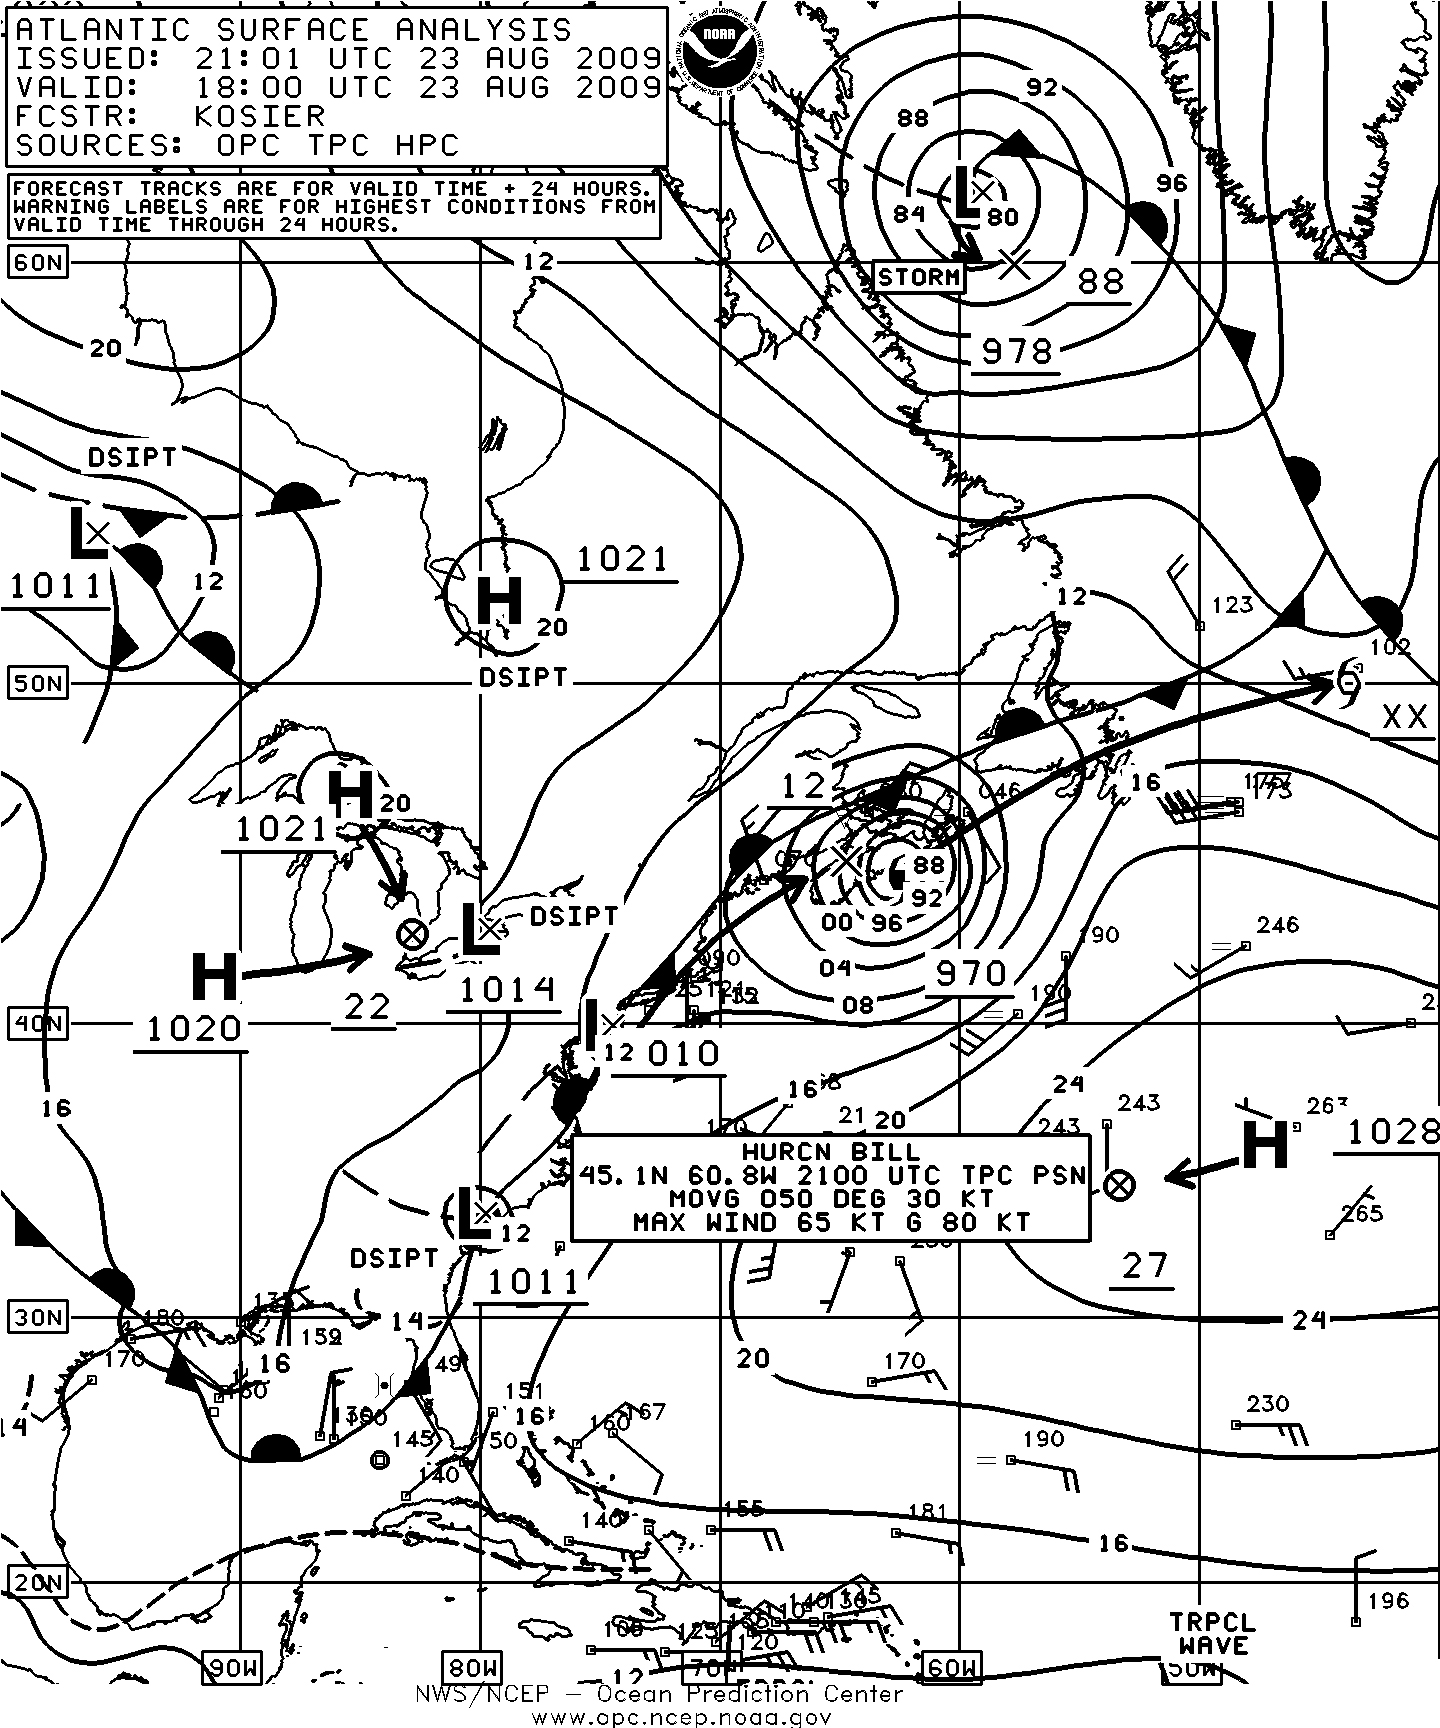
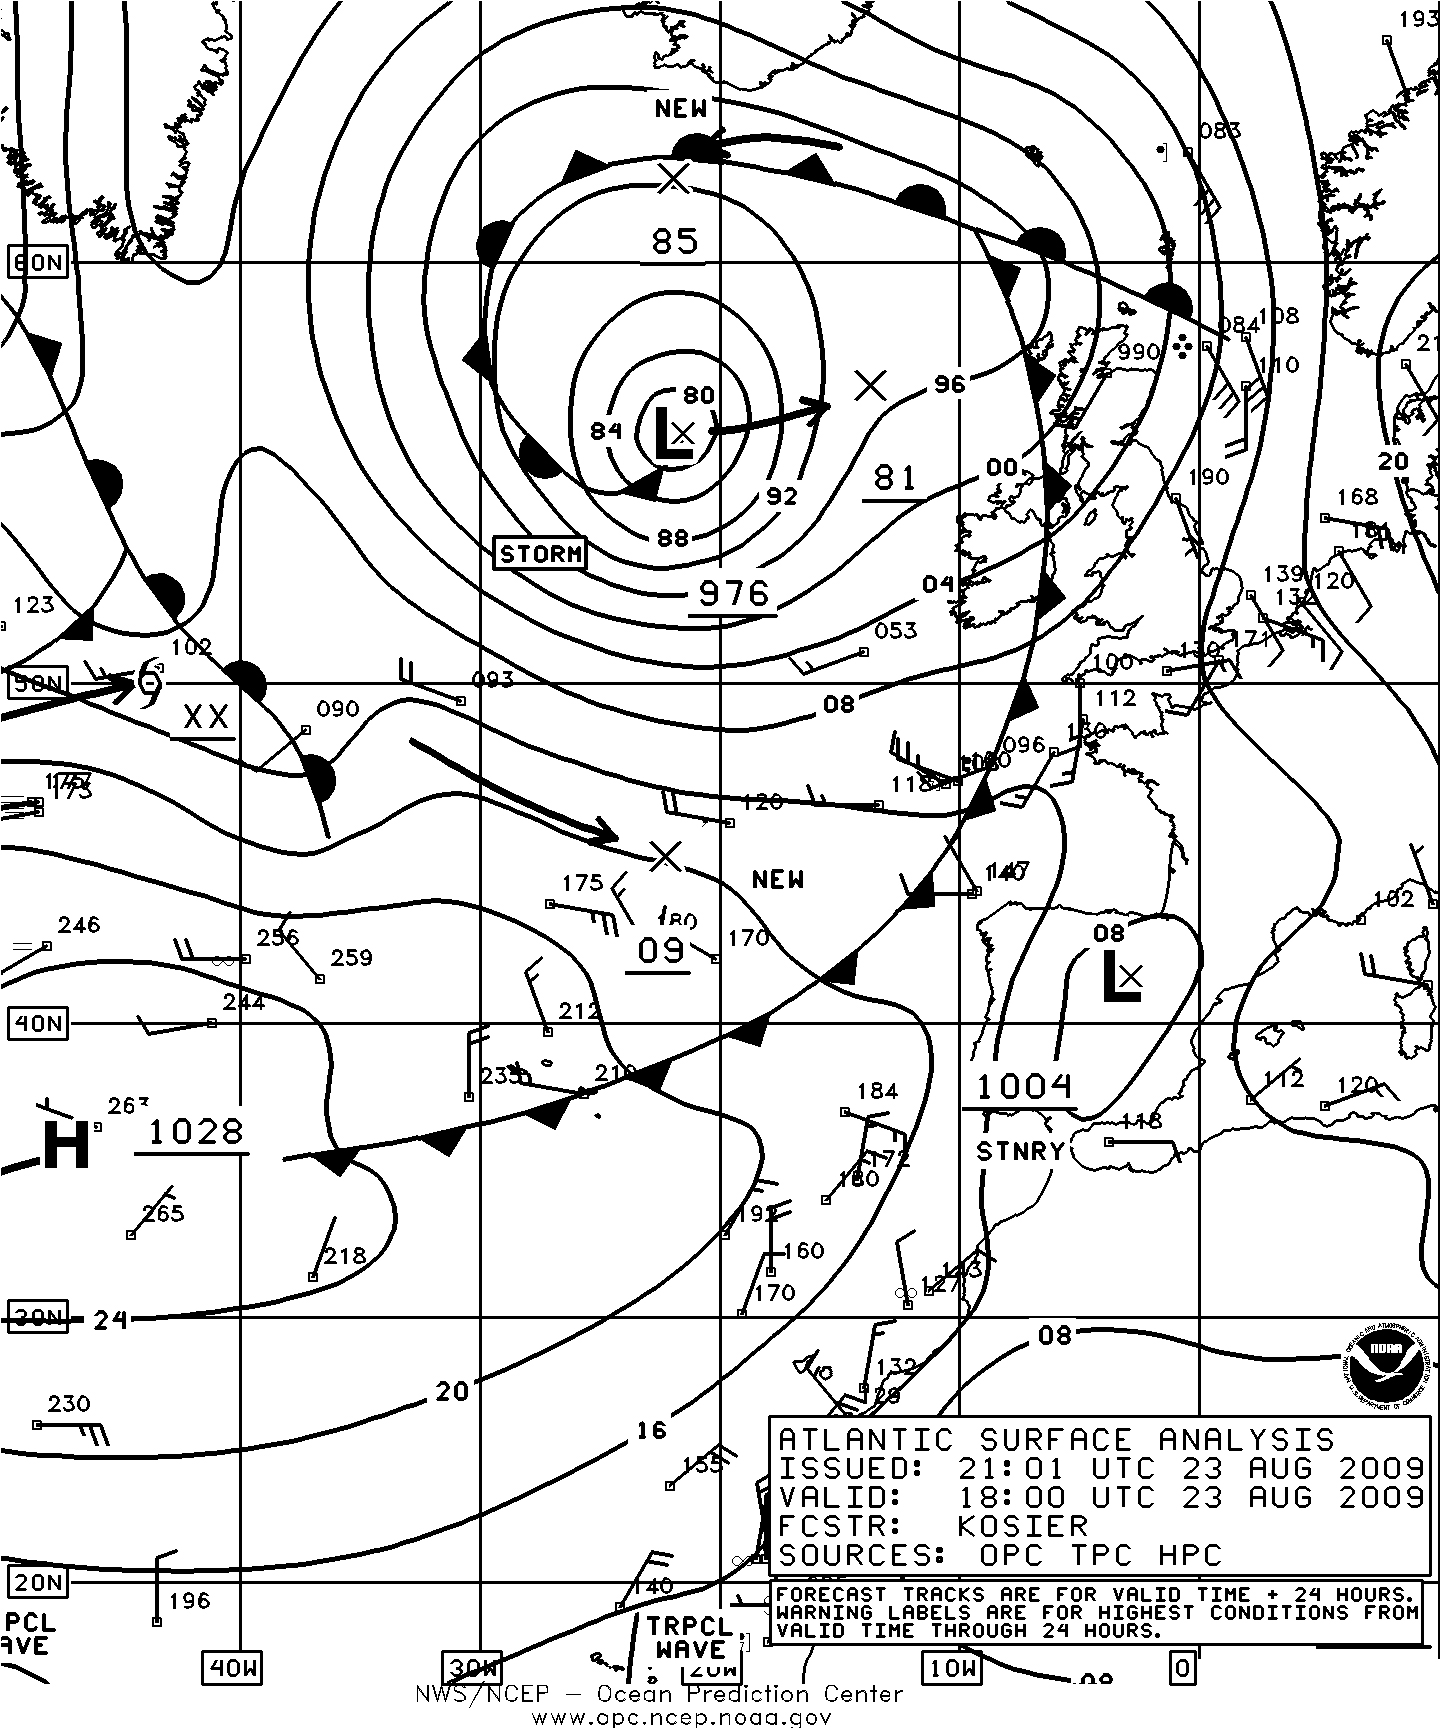
Figure 1. OPC North Atlantic Surface Analysis charts (Parts 1 west and 2 - east) valid 1800 UTC August 23, 2009.
Tropical Storm Danny: Forming just east of the Bahamas on August 26 as a tropical storm, Danny moved north into OPCs offshore waters 250 nmi south of Cape Hatteras on the evening of August 28 as a minimal tropical storm with maximum sustained winds of 35 kts with gusts to 45 kts. Danny then weakened to a tropical depression six hours later before merging with a non tropical low near Cape Hatteras on the morning of the 29th. The resulting gale force low moved northeast to near Cape Cod late on the 29th and through the Canadian Maritime Provinces on the 30th before weakening east of the island of Newfoundland on August 31. The Grand Banks platforms Hibernia (VEP717 at 46.7N 48.7W) and Sea Rose (VOXS, 46.7N 48W) at 0000 UTC on the 31st reported 50 kts winds from the south and southeast, respectively. The two platforms respectively have anemometer heights of 139 m and 42 m. (Reference 2)
Other Significant Events of the Period
Northeastern Atlantic Storm, April 29-May 1: The month of May began with a 968 hPa storm in the northeastern Atlantic about 450 nmi south of Iceland, moving northeast toward Iceland and weakening. This was one of three cyclones to have central pressures as low as 968 hPa during May. See the August 2009 issue of MWL (Reference 3) for more information on this system which developed in late April. The cyclone subsequently moved northeast of Iceland as a gale force low by May 2.
North Atlantic Storms, May 5-7: Figure 4 depicts the development and movement of two storm force lows across the northern waters. The first of these moved off the Labrador coast with a 1000 hPa central pressure by May 5 and redeveloped eastward before rapidly intensifying after passing southeast of Greenland. The central pressure fell 25 hPa during the twenty-four hour period covered by Figure 4, resulting in the 970 hPa storm south of Iceland. This cyclone then turned northeast with the central pressure as low as 968 hPa twelve hours later before passing quickly northeast of Iceland and weakening to a gale later on the 7th. Also as indicated in Figure 4 a second developing storm followed quickly in the wake of the first system to become the 993 hPa storm force low southeast of Greenland in the second part of Figure 4. Figure 5 is a high resolution QuikSCAT pass revealing the highest winds, 50 to 60 kts from the west and northwest associated with this second storm, late on the 6th. Winds with the first storm were similar and revealed up to 55 kts from the west on the preceding QuikSCAT pass. Although the second cyclone continued to deepen while turning northeast, its highest winds lowered to gale force later on the 7th and the cyclone passed east of Iceland with a 975 hPa central pressure early on May 8. As the first storm system passed to the north, the buoy 64045 (59.1N 11.7W) at 0400 UTC on the 7th reported southwest winds of 40 kts and 11.5 m seas (37 ft). To the north the buoy 64046 (60.7N 4.9W) reported southwest winds of 35 kts at 1200 UTC on the 7th with seas as high as 11.5 m (37 ft) three hours later. Later, at buoy 63115 (61.6N 1.4E) winds were southwest 40 kts with 7.0 m seas (23 ft) at 1600 UTC on May 7 and seas were as high as 9.0 m (29 ft) two hours later. With the second storm, the buoy 62095 (53N 15.8W) reported southwest winds of 35 kts and 5.5 m seas (18 ft) at 1600 UTC on the 7th.
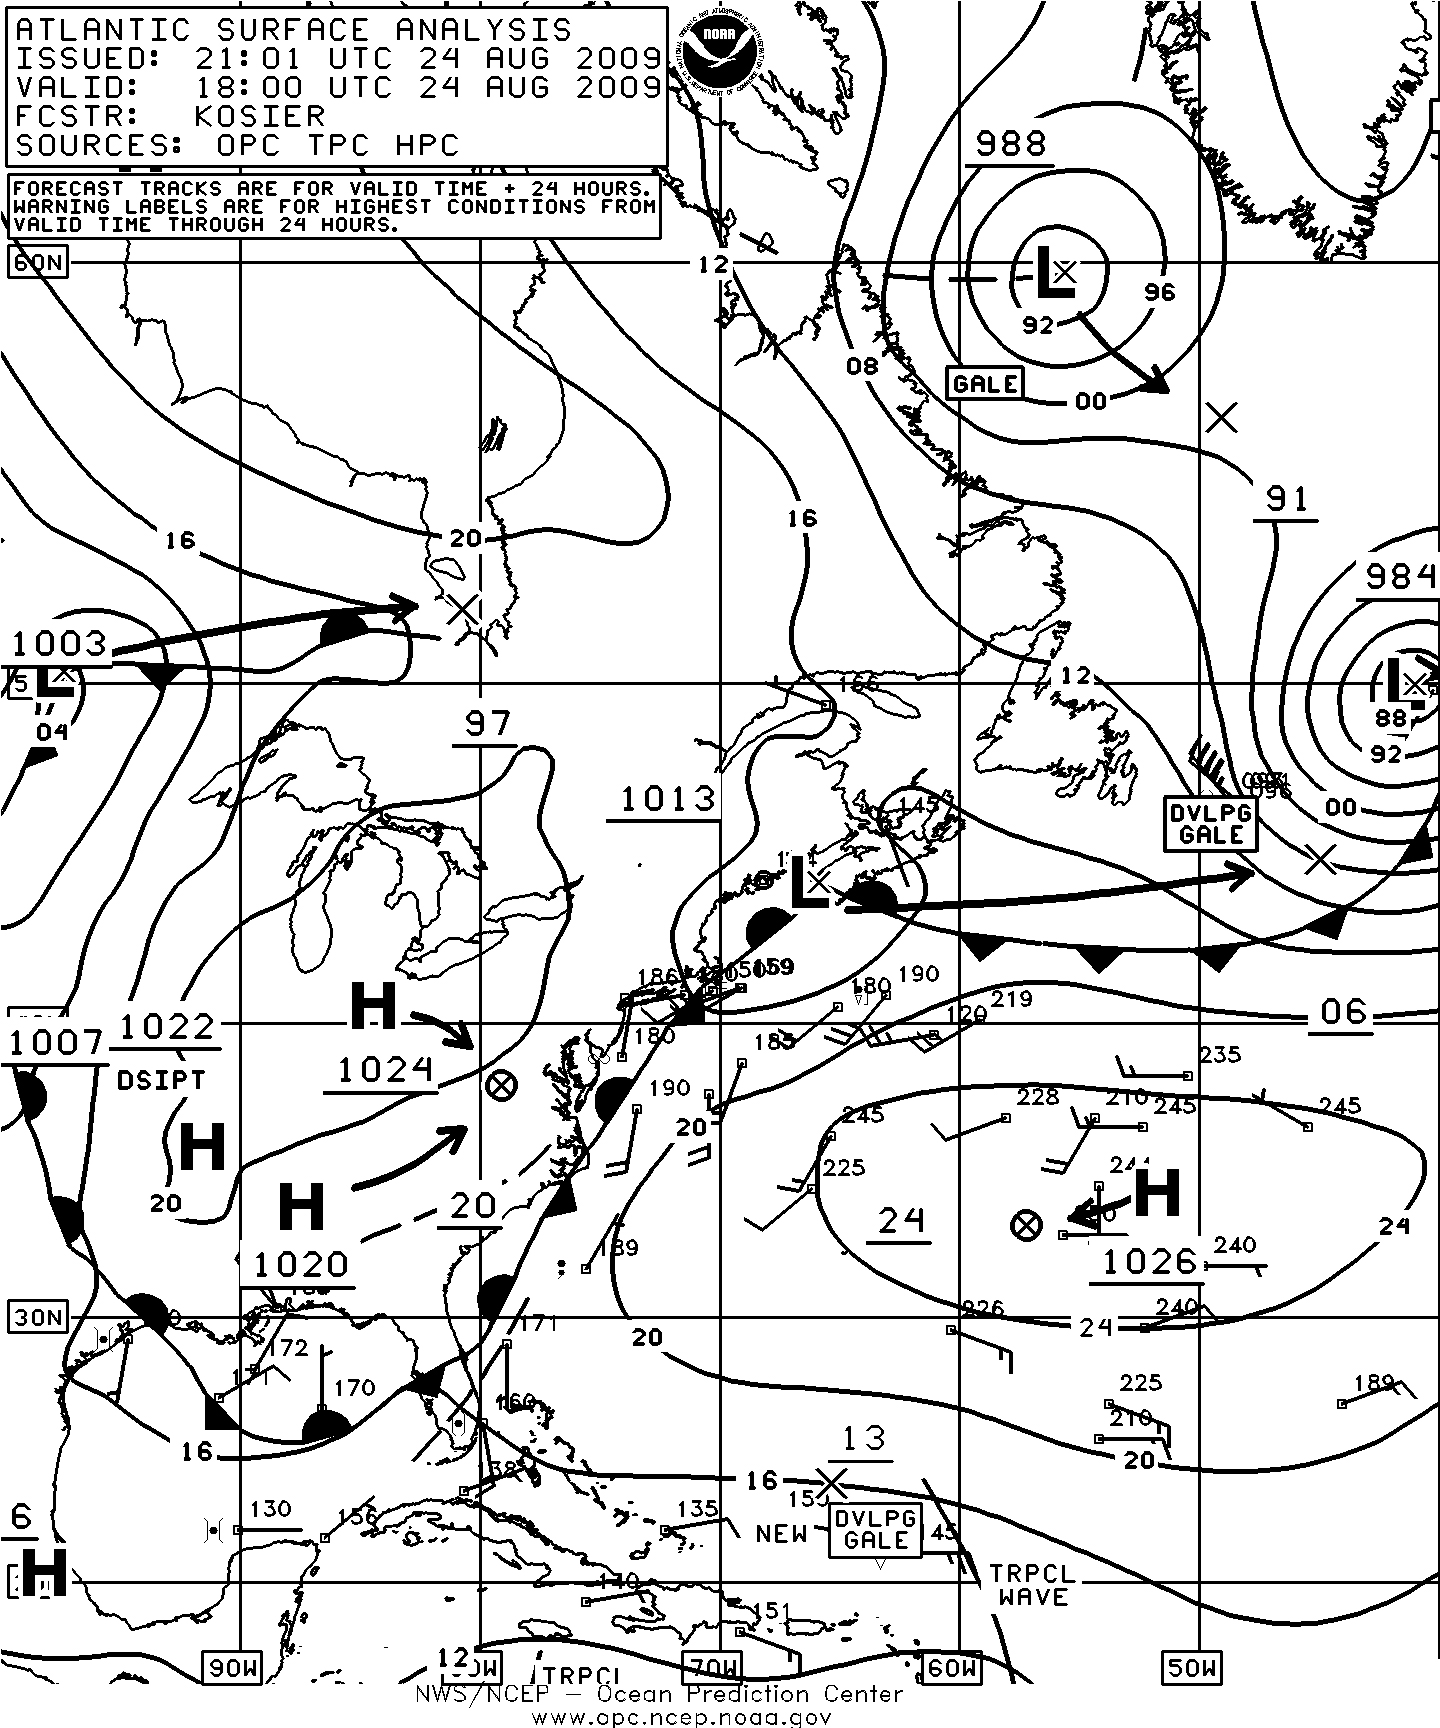
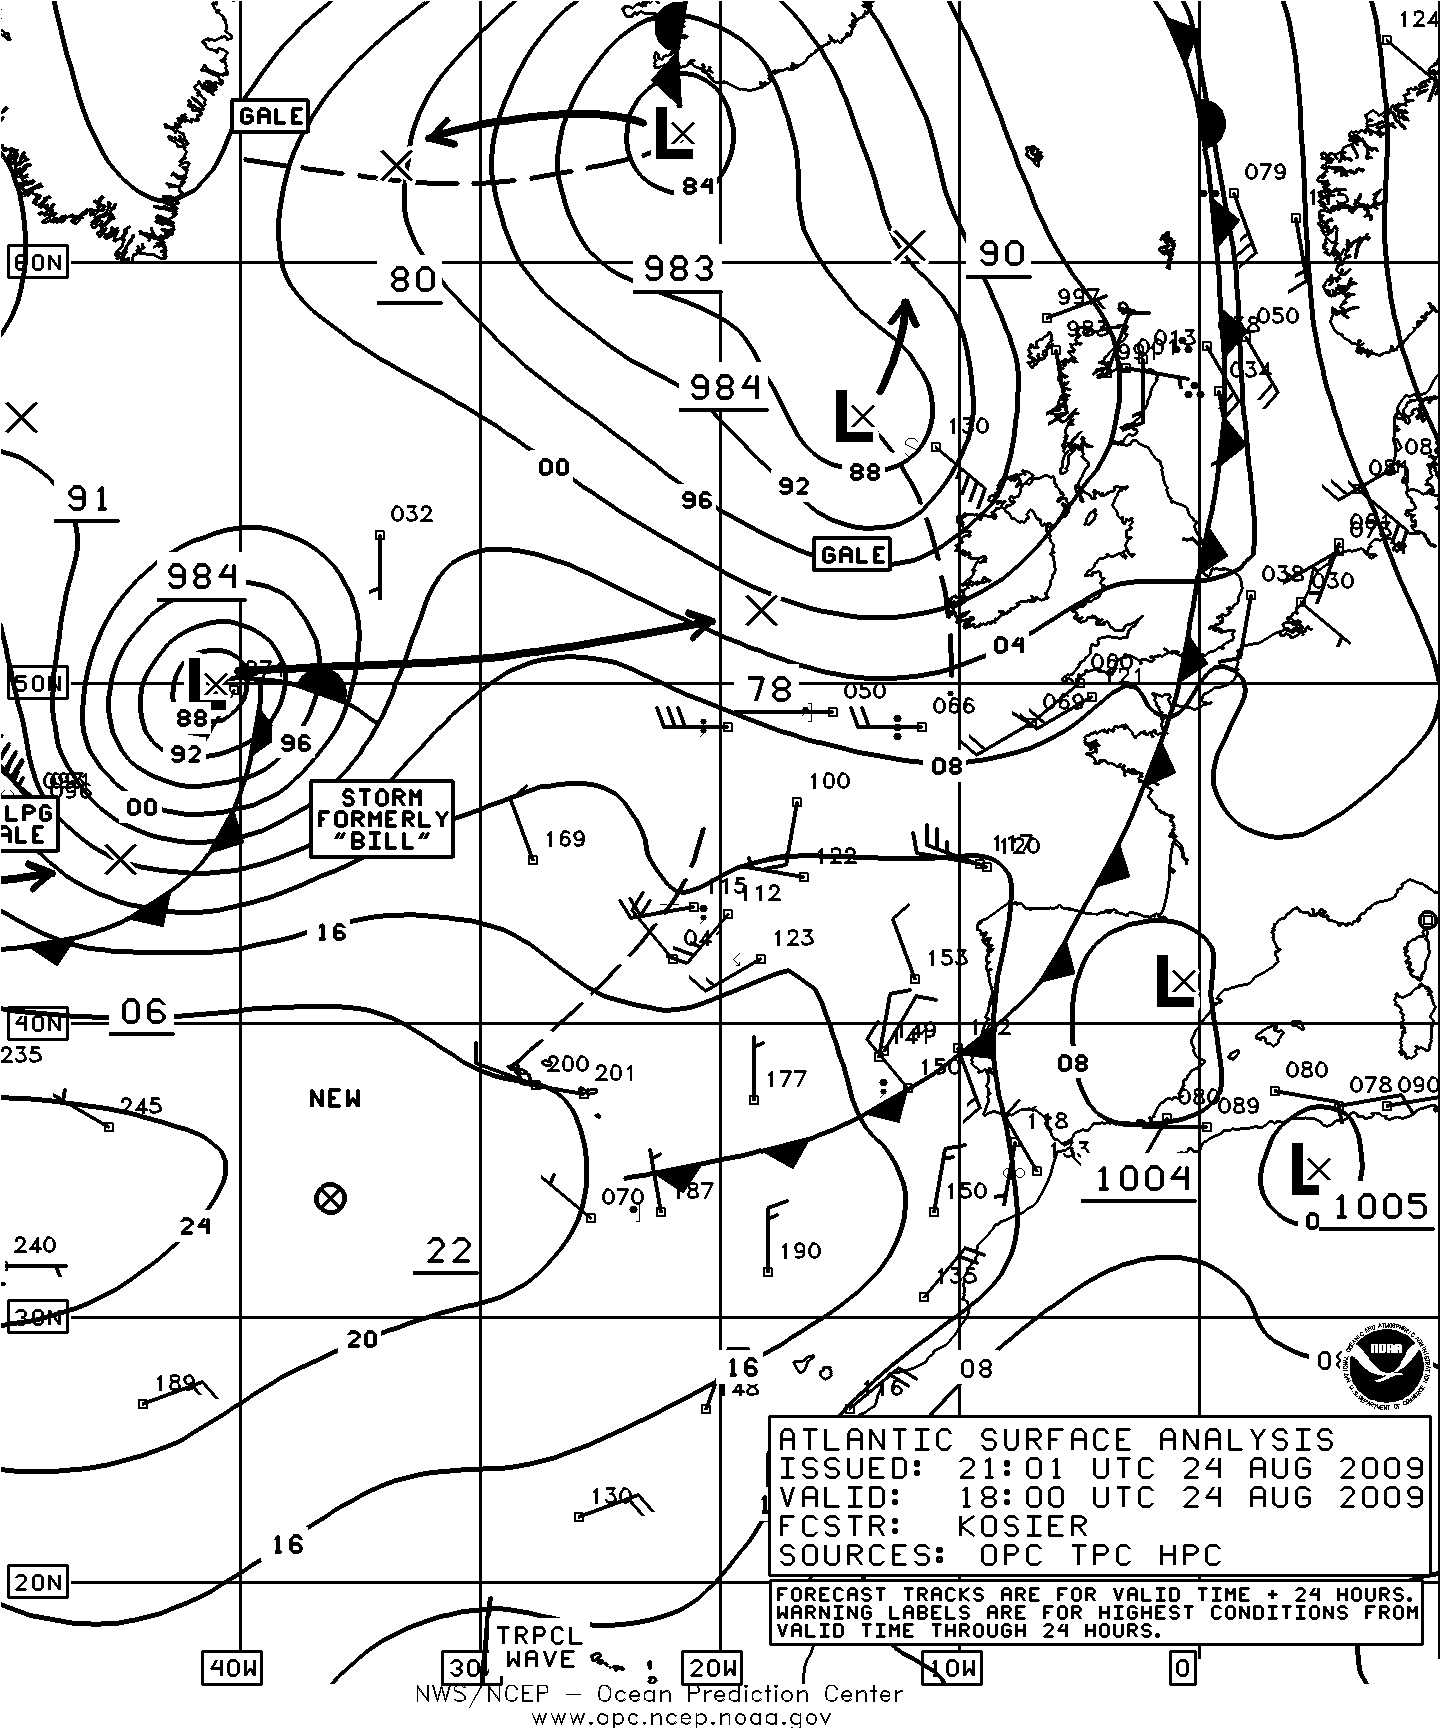
Figure 2. OPC North Atlantic Surface Analysis charts (Parts 1 and 2) valid 1800 UTC August 24, 2009.
Storm in Davis Strait, May 8: An intensifying cyclone moved from northern Quebec early on May 7 to the Davis Strait at 1200 UTC on the 8th (Figure 6, first part). The associated frontal system briefly developed storm force winds as it approached the southwest Greenland coast as revealed in the scatterometer data of Figure 7. The cyclone then moved north and weakened north of the area shortly thereafter.
Eastern North Atlantic Storm, May 8-10: Low pressure originating over the Atlantic Canada late on May 6 moved east of Newfoundland on the 7th with its western edge appearing well east of Newfoundland in the first part of Figure 6. The cyclone then moved southeast and briefly developed storm force winds with a 998 hPa central pressure near 43N 23W by 1800 UTC on the 9th as high pressure strengthened to the north. The second part of Figure 6 shows the cyclone at maximum intensity six hours later. The elevated platform Hibernia (46.7N 48.7W) reported southwest winds of 50 kts and 2.0 m seas (6 ft) at 1500 UTC on the 7th. Later, the drifting buoy 44639 (46N 31.7W) reported northeast winds of 45 kts at 0400 UTC on the 9th and the Ever Devote (3FIF8) reported the same conditions near 48N 24W at 1200 UTC that day. The ship WGAX (46N 25W) reported winds as high as 55 kts from the northeast and 7.5 m seas (25 ft) at 1800 UTC May 9. The cyclone weakened to a gale twelve hours later as it drifted east, before turning northeast and moving inland over France on the 12th.
North Atlantic Storm, May 11-12: A gale force low passing just south of Atlantic Canada on May 10 turned northeast on the 11th and developed storm force winds by 0000 UTC on the 12th with the center near 54N 40W with a central pressure of 980 hPa. A QuikSCAT pass about seven hours later revealed northwest winds of 50 kts on the southwest side of the center similar to those in Figure 5 for the earlier event except not quite as strong. The Henry Goodrich (HP6038, 46.7N 48.4W) reported northwest winds of 45 kts at 0000 UTC on the 12th. The cyclone then re-formed eastward to a new center with a 986 hPa central pressure near 53N 29W by 1800 UTC on the 12th with the winds weakening to gale force six hours later. The cyclone then moved northeast and dissipated south of Iceland late on the 13th.
North Atlantic Storm, May 13-16: The next developing storm followed a track similar to that of the preceding system except a bit farther south, with redevelopment eastward to a new center. The cyclone briefly developed storm force winds early on May 13 while passing south of Newfoundland near 42N with a 1005 hPa central pressure before weakening to a gale later that day as the system began to elongate northeastward. A new center formed over the central waters later on the 14th which then moved northeast and intensified to a storm force low with a 993 hPa central pressure near 50N 19W at 1200 UTC on the 15th. The cyclone developed a lowest central pressure of 984 hPa twenty four hours later near the coast of Ireland, but its highest winds were down to gale force by then. Selected ship and buoy observations taken during this cyclones redevelopment are listed in Table 2. In the table the ship WKAW reports 14.5 m seas which appears high given the time of year and the strongest winds in this storm of 50 to 55 kts. The author has more confidence in the later report from A8OJ9 of 10.5 m. The cyclone subsequently drifted northwest while weakening and stalled northwest of Scotland by the 19th before dissipating by May 22.
| Observation | Position | Date/Time (UTC) | Wind | Seas (m/ft) |
|---|---|---|---|---|
| WKAW | 46N 17W | 15/2100 | W 35 | 14.5/47 |
| BATFR04 | 49N 11W | 15/2300 | SW 45 | |
| 49N 12W | 16/0000 | W 50 | 7.0/23 | |
| 49N 12W | 16/0100 | NW 50 | ||
| PEBT | 48N 10W | 16/0100 | SW 35 | 7.0/23 |
| 48N 11W | 16/1300 | W 40 | 9.0/29 | |
| A8OJ9 | 49N 12W | 16/0300 | W 55 | 10.5/35 |
| Buoy 62103 | 49.9N 2.9W | 15/1400 | W 40 | |
| Buoy 62029 | 48.7N 12.4W | 15/2000 | SW 35 | 4.5/15 |
| 16/0000 | W 35 | 8.0/26 |
Storm in Davis Strait, May 18-19: This was an event similar to May 8 with a front trailing from low pressure moving northeast into the Davis Strait developing brief storm force winds near the southwest coast of Greenland late on May 18. The cyclone dissipated north of the area the next day.
North Atlantic Storm, May 21: A front associated an inland low pressure system moved off the Labrador coast early on May 20 where it spawned a secondary low with a 1007 hPa central pressure on the morning of the 20th. This new low intensified offshore and briefly developed storm force winds southwest of the center by 1800 UTC the next day, with a scatterometer pass from 0930 that day revealing west to northwest winds to 55 kts off the south coast of Labrador and just northeast of the island of Newfoundland. The center developed a central pressure as low as 985 hPa near 59N 41W at 1800 UTC on the 21st. Although a few millibars deeper, the cyclone became a gale force low the following night while drifting east. The system then drifted southwest on May 22-23 before turning east on the 24th and moving inland over southern Norway on the 26th.
Northeast Atlantic Storm of May 23-24: The next developing cyclone moved from the Gulf of St. Lawrence at 0600 UTC May 22 northeast to 180 nmi south of Iceland with a 982 hPa central pressure forty-eight hours later, where it briefly developed storm force winds. A QuikSCAT pass from 0453 UTC May 24 showed one 50 kts wind retrieval south of the low center. The cyclone stalled on the 24th before moving southwest later that day and merging with its predecessor the next day.
North Atlantic Storm, May 26-28: This cyclone developed rapidly from a 1003 hPa frontal wave of low pressure that was near 44N 50W at 0600 UTC on May 26. The central pressure fell 31 hPa over the next twenty-four hours as the system moved to the central waters near 52N 38W with a 972 hPa central pressure and developed storm force winds. The cyclone developed a lowest central pressure of 968 hPa near 55N 38W six hours later with storm force winds lasting until early on the 28th. The ship DDSB2 (46N 28W) reported east winds of 50 kts at 0300 UTC on the 27th. Three hours later the ship PIAG near 49N 42W encountered west winds of 50 kts and 4.5 m seas (15 ft). The Enerchen Trader (CYCJ) near 47N 39W reported west winds of 35 kts and 9.0 m seas (29 ft) at 0900 UTC on the 27th. The vessel GBQM (46N 26W) encountered south winds of 45 kts and 6.5 m seas (22 ft) at 1800 UTC May 27 and five hours later there was a report from DBBT (60N 40W) of northeast winds 45 kts. The cyclone subsequently weakened and passed northwest of Iceland on the 29th.
North Atlantic Storm , May 29-30: The first of two hurricane force lows to develop during the period is shown in Figure 8 . The cyclone developed rapidly from a frontal wave of low pressure with the second part of Figure 8 showing a compact system at maximum intensity in terms of central pressure and winds. Figure 9 is a mosaic of METEOSAT9 and GOES East infrared satellite imagery valid near the time of maximum intensity revealing a well developed comma cloud with cold tops and a well defined center. The streaks of high clouds in the upper left side of the image show indication of a northwest jet stream supporting the development. Figure 10 is a 500 hPa analysis valid midway through the period of rapid development. There is a 500 hPa wind maximum and sharp short wave trough moving into the base or phasing with a larger scale upper trough over the North Atlantic, supporting development. See Reference 4 for more information on use of the 500 hPa chart and its relation to surface features. The high resolution QuikSCAT data in Figure 11 reveals a compact circulation with storm and hurricane force winds (including an 80 kts retrieval southwest of the center) mainly in the southwest and west semicircles. At 1200 UTC May 29 the ship WKAB (41N 47W) reported north winds of 45 kts and 6.0 m seas (20 ft). Nine hours later the Philadelphia Express (WDC6736) encountered northwest winds of 45 kts and 7.0 m seas (23 ft) near 39N 38W. The drifting buoy 44638 (40.3N 37.2W) reported west winds of 45 kts at 1900 UTC on the 29th. High pressure building to the north of the cyclone forced it to drift southeast with its top winds diminishing to storm force at 0600 UTC on the 30th and to gale force twelve hours later. By June 2 high pressure weakened and allowed the cyclone to turn more north with some re-intensification. The system then turned more southeast and weakened to a low on June 3, and then moved inland over France by the 6th.
Eastern North Atlantic Storm, June 6-7: A weak frontal wave of low pressure moved off the mid Atlantic coast of the U.S. and tracked east-northeast across the Atlantic, not intensifying appreciably until passing east of 35W. The cyclone developed a central pressure down to 994 hPa near 45N 20W and storm force winds by 1200 UTC on the 7th. A 25 km (standard resolution) QuikSCAT pass seven hours later with partial coverage of the storm circulation revealed one 50 kts retrieval just south of the center which was near 45N 18W. The cyclone then weakened to a gale later that day and turned more northeast before weakening over Denmark by the 10th.
North Atlantic Storm, June 13-16: Low pressure originating over New England early on June 12 tracked northeast with Figure 12 showing its further development northeast of Newfoundland. On the night of the 13th the cyclone developed storm force winds over the northwest Atlantic, and as the system continued to move northeast to 56N 42W by 0600 UTC on the 15th the northeast flow ahead of the occluded front became enhanced by the southern tip of Greenland (Figure 13). At 1500 UTC June 13 the platform Hibernia (VEP717, 46.7N 48.7W) reported south winds of 60 kts while nearby GSF Grand Banks (YJUF7, 46.7N 47.9W) encountered south winds of 45 kts (lower anemometer height). The Walther Herwig III (DBFR) near 53N 47W reported west winds of 40 kts at 2300 UTC on the 14th. The cyclone continued to drift northeast and weakened to a gale by the 16th and then turned east, before weakening over Norway on June 19.
Northwest Atlantic Storm, June 25: A frontal wave of low pressure on the north Labrador coast late on June 24 moved north into the Davis Strait late on the 25th while a new center developed to the southeast along the front and drifted southeast. The resulting southeast flow near the southwest Greenland coast briefly produced winds to 50 kts in a pattern similar to Figure 7. The low pressure and front dissipated on the 26th.
North Atlantic Storm, June 27-28: The complex area of low pressure near 20W appearing in the first part of Figure 14 has a main center near 40N 20W which originated as a frontal wave of low pressure near Newfoundland three days prior. The main center moved north and rapidly intensified while absorbing the other lows, with the central pressure dropping 19 hPa in twenty-four hours (Figure 14). The second part of Figure 14 shows the storm near maximum intensity. A high resolution scatterometer pass from about four and one half hours prior to this time (Figure 15) indicates that the system briefly attained hurricane force intensity, rare for the end of June. A 75 kts retrieval appears southwest of the low center. The ship C6RM7 (51N 19W) reported a northeast wind of 40 kts at 1900 UTC on the 27th. The cyclone subsequently drifted northwest until the 28th when its top winds diminished to gale force. Blocked by high pressure to the north, the system stalled and weakened to a sub gale low near 50N 26W by the end of the month. In early July this low became absorbed by a stronger low dropping southeast from near Greenland.
Northwest Atlantic Storm, July 6-8: Developing low pressure over the Canadian Maritime Provinces on July 5 moved northeast into the Labrador Sea over the next twenty-four hours then slowed while turning north, and developed storm force winds from the north and northeast near Greenland late on July 7 as the center developed a central pressure of 994 hPa near 55N 44W. Up until this time this event was similar to the June 13-16 event in intensity and winds (as in Figure 13). Continued high latitude blocking subsequently forced this system to loop to the southwest and then southeast and it became absorbed by a gale force low passing to the east early on the 11th.
Northwest Atlantic Storm, July 16-17: Similar to its predecessor and the mid June event, this cyclone moved north into the eastern Labrador Sea by early on July 17 when it developed storm force north to northeast winds near the southern tip of Greenland before stalling and then moving southeast late on the 17th. The cyclone eventually moved over Great Britain as a gale by July 22 before passing northeast of the area on the 24th.
North Atlantic Storm, July 24-25: A frontal wave of low pressure just south of the island of Newfoundland on the night of July 22 moved east-northeast and developed storm force winds by 0000 UTC on the 25th as the low center developed a central pressure of 996 hPa near 49N 29W. A high resolution QuikSCAT pass from 0800 UTC on the 25th showed a few 50 kts wind retrievals just south of the center. ZCBP6 (48N 20W) reported southwest winds of 40 kts and 5.5 m seas (18 ft) at 0600 UTC on the 25th and was among several ships in the area reporting 35 to 40 kts winds. The cyclone subsequently slowed and turned to the northwest when 500 nmi south of Iceland late on the 25th and its central pressure dropped to 987 hPa; however, its top winds diminished to gale force by that time. The low became absorbed by another gale force low moving north toward Iceland early on July 29.
North Atlantic Storm, August 22-26: After a relatively quiet first three weeks of August, the weather in late August became more active both from tropical activity described earlier and from more intense non tropical systems. The 976 hPa low in the northeast Atlantic in Figure 1 came from the southern Labrador coast at 0000 UTC August 21 and briefly developed storm force winds on the afternoon of the 23rd. Its central pressure during development fell 20 hPa in the twenty-four hour period ending at 1800 UTC on the 22nd. A scatterometer pass valid about three hours after Figure 1 revealed a few 50 kts wind retrievals northwest of the center. Figure 2 shows this cyclone weakening while moving northeast as a secondary low center formed south of Iceland and moved toward Greenland. This secondary center developed storm force northeast winds along the east coast of Greenland on the 25th while the primary low dissipated. A high resolution QuikSCAT morning pass that day revealed winds to 50 kts along the east coast of Greenland and in the Denmark Strait. The cyclone turned southeast and then east away from Greenland as a gale on August 26 and dissipated south of Iceland on the 27th.
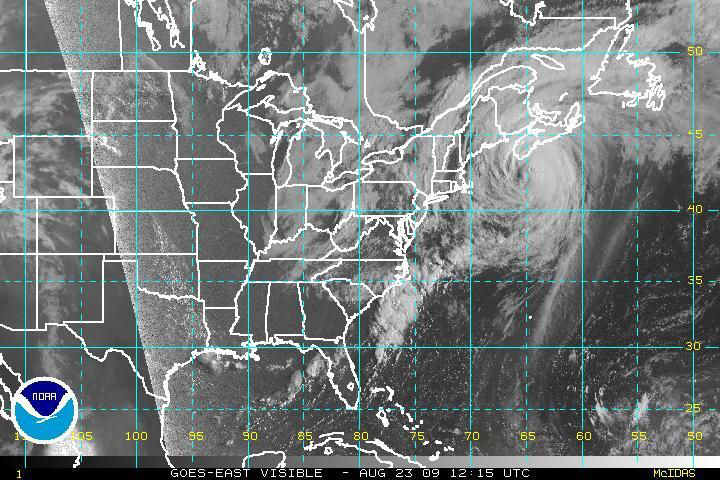
Figure 3. GOES East visible satellite image valid 1215 UTC August 23, 2009. The valid time of the image is five and three-quarters hours prior to the valid time of Figure 1.
Northwest Atlantic Storm of August 23-24: Low pressure developed rapidly is it dropped southeast into the north Labrador Sea to become the 978 hPa storm center in Figure 1. The cyclone briefly developed storm force winds around the northeast and south sides on August 23 as depicted in the QuikSCAT pass of Figure 16. Its winds dropped to gale force the following night as the system weakened and drifted southeast. It became absorbed by the cyclone passing southeast of Greenland late on the 25th.
Northwest Atlantic Storm, August 28-29: This cyclone was already well developed as it moved east from the central Labrador coast with a 988 hPa center at 1800 UTC August 27. It developed minimal storm force winds on the 28th on the northwest side as it moved over the Labrador Sea, as revealed in scatterometer data. The Hibernia platform (VEP717, 46.7N 48.7W) reported southwest winds of 45 kts at 2100 UTC on the 27th, and seas of 4.0 m (13 ft) at 0000 UTC on the 29th. The drifting buoy 44636 (45.8N 56W) reported west winds of 45 kts at 1000 UTC on the 28th. Although the cyclone weakened while passing south of Greenland on the 29th, storm force winds persisted near the southern tip of Greenland, similar to those seen in Figure 15 for the mid June event. The winds decreased to gale force late on the 29th as the system moved east, and later dissipated near Ireland on the 31st.
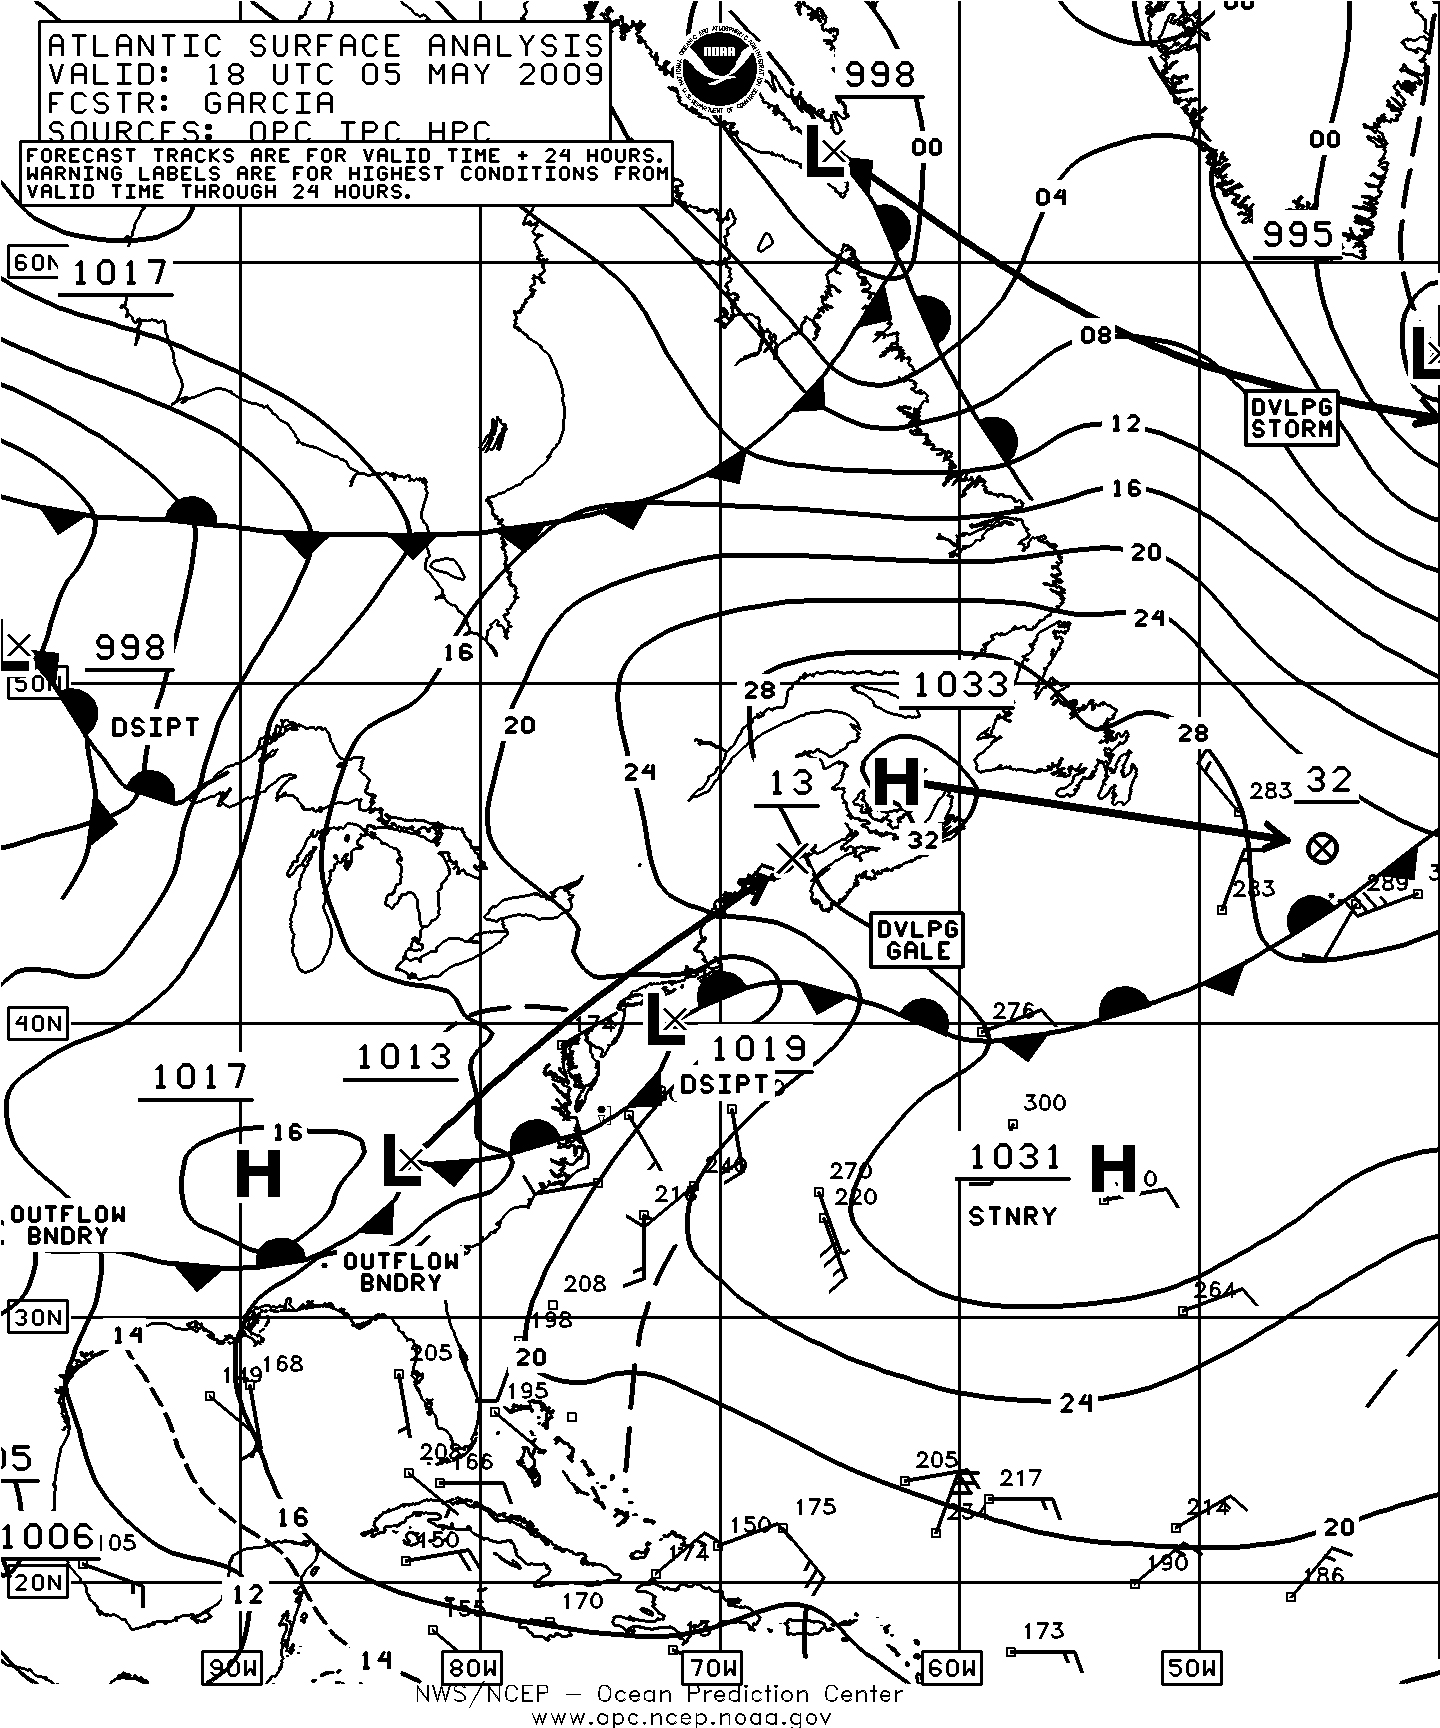
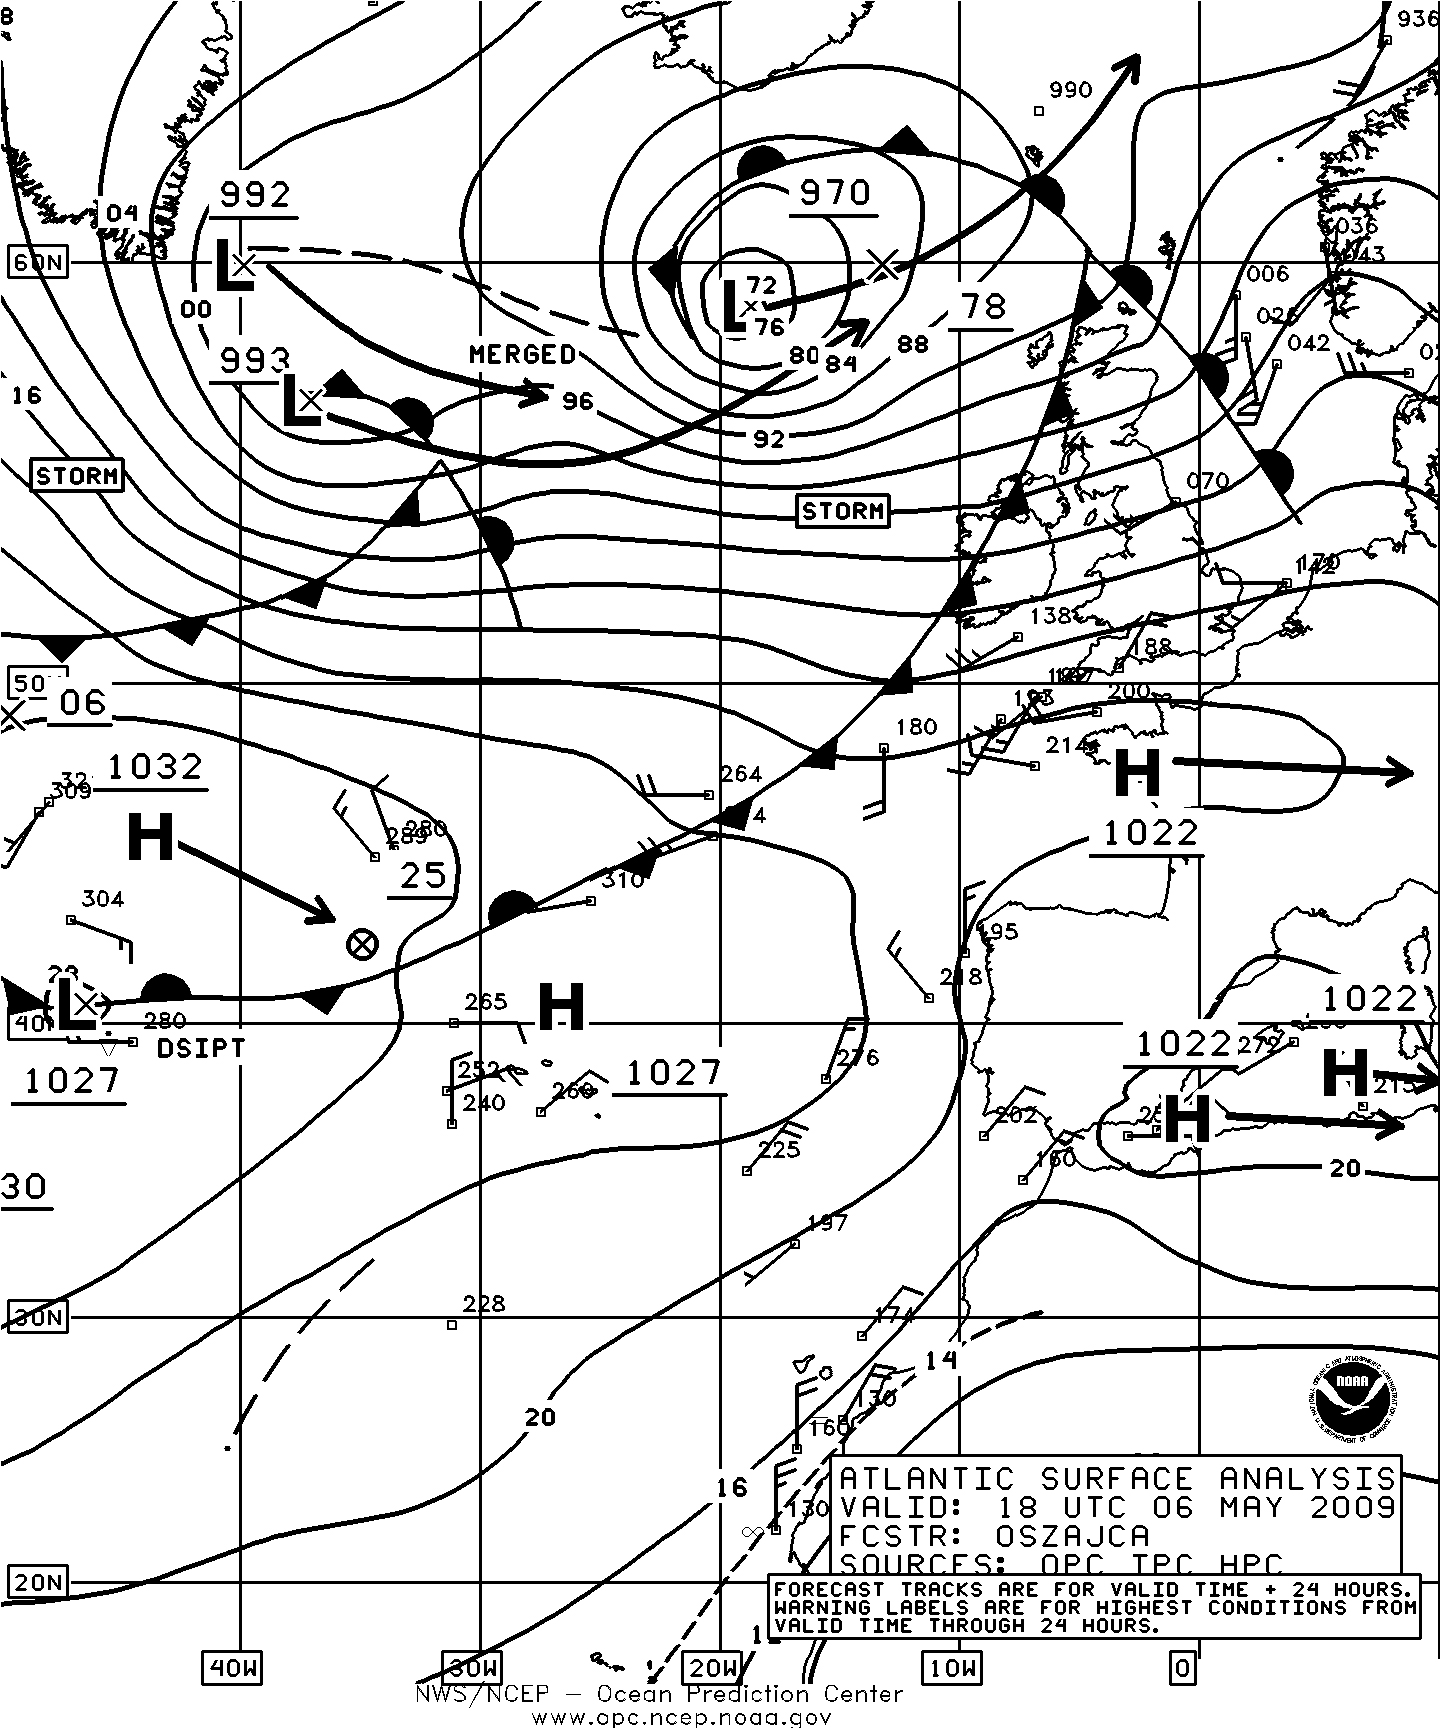
Figure 4. OPC North Atlantic Surface Analysis charts valid 1800 UTC May 5 (Part 2) and 1800 UTC May 6, 2009 (Part 1).
Storm in Norwegian Sea, August 29: The low pressure wave over Nova Scotia in Figure 2 crossed the Atlantic in three days, with the most rapid development occurring after the system massed north of Great Britain. It briefly developed storm force winds and a 976 hPa central pressure, similar to the August 22-26 event, while moving through the Norwegian Sea late on the 29th. It passed north of the area shortly thereafter.
References
Saffir-Simpson Scale of Hurricane Intensity, http://www.nhc.noaa.gov/aboutsshs.shtml
E-mail communication, Thomas, Bridget, Climate Data and Analysis Section(Environment Canada), October 28, 2008.
QuikSCAT in the Ocean Prediction Center http://www.opc.ncep.noaa.gov/quikscat/index.shtml
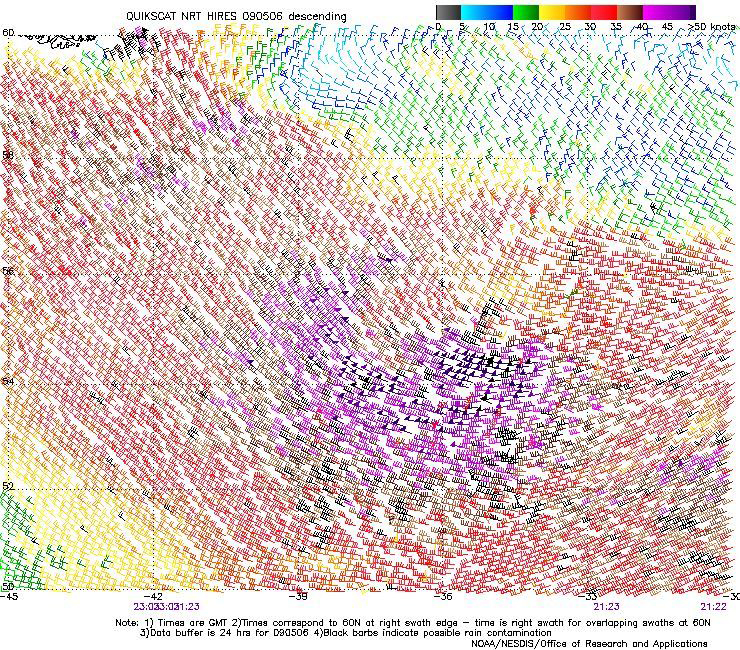
Figure 5. High resolution QuikSCAT scatterometer image of satellite-sensed winds around the southwest side of the storm southeast of Greenland shown in the second part of Figure 4. The resolution of the image is 12.5 km versus 25 km in the standard version of the imagery. The valid time of the pass is 2123 UTC May 6, 2009, or about three and one-half hours later than the valid time of the second part of Figure 4. The southern tip of Greenland appears at the upper-left edge of the image. Image is courtesy of NOAA/NESDIS/ Offi ce of Research and Applications.
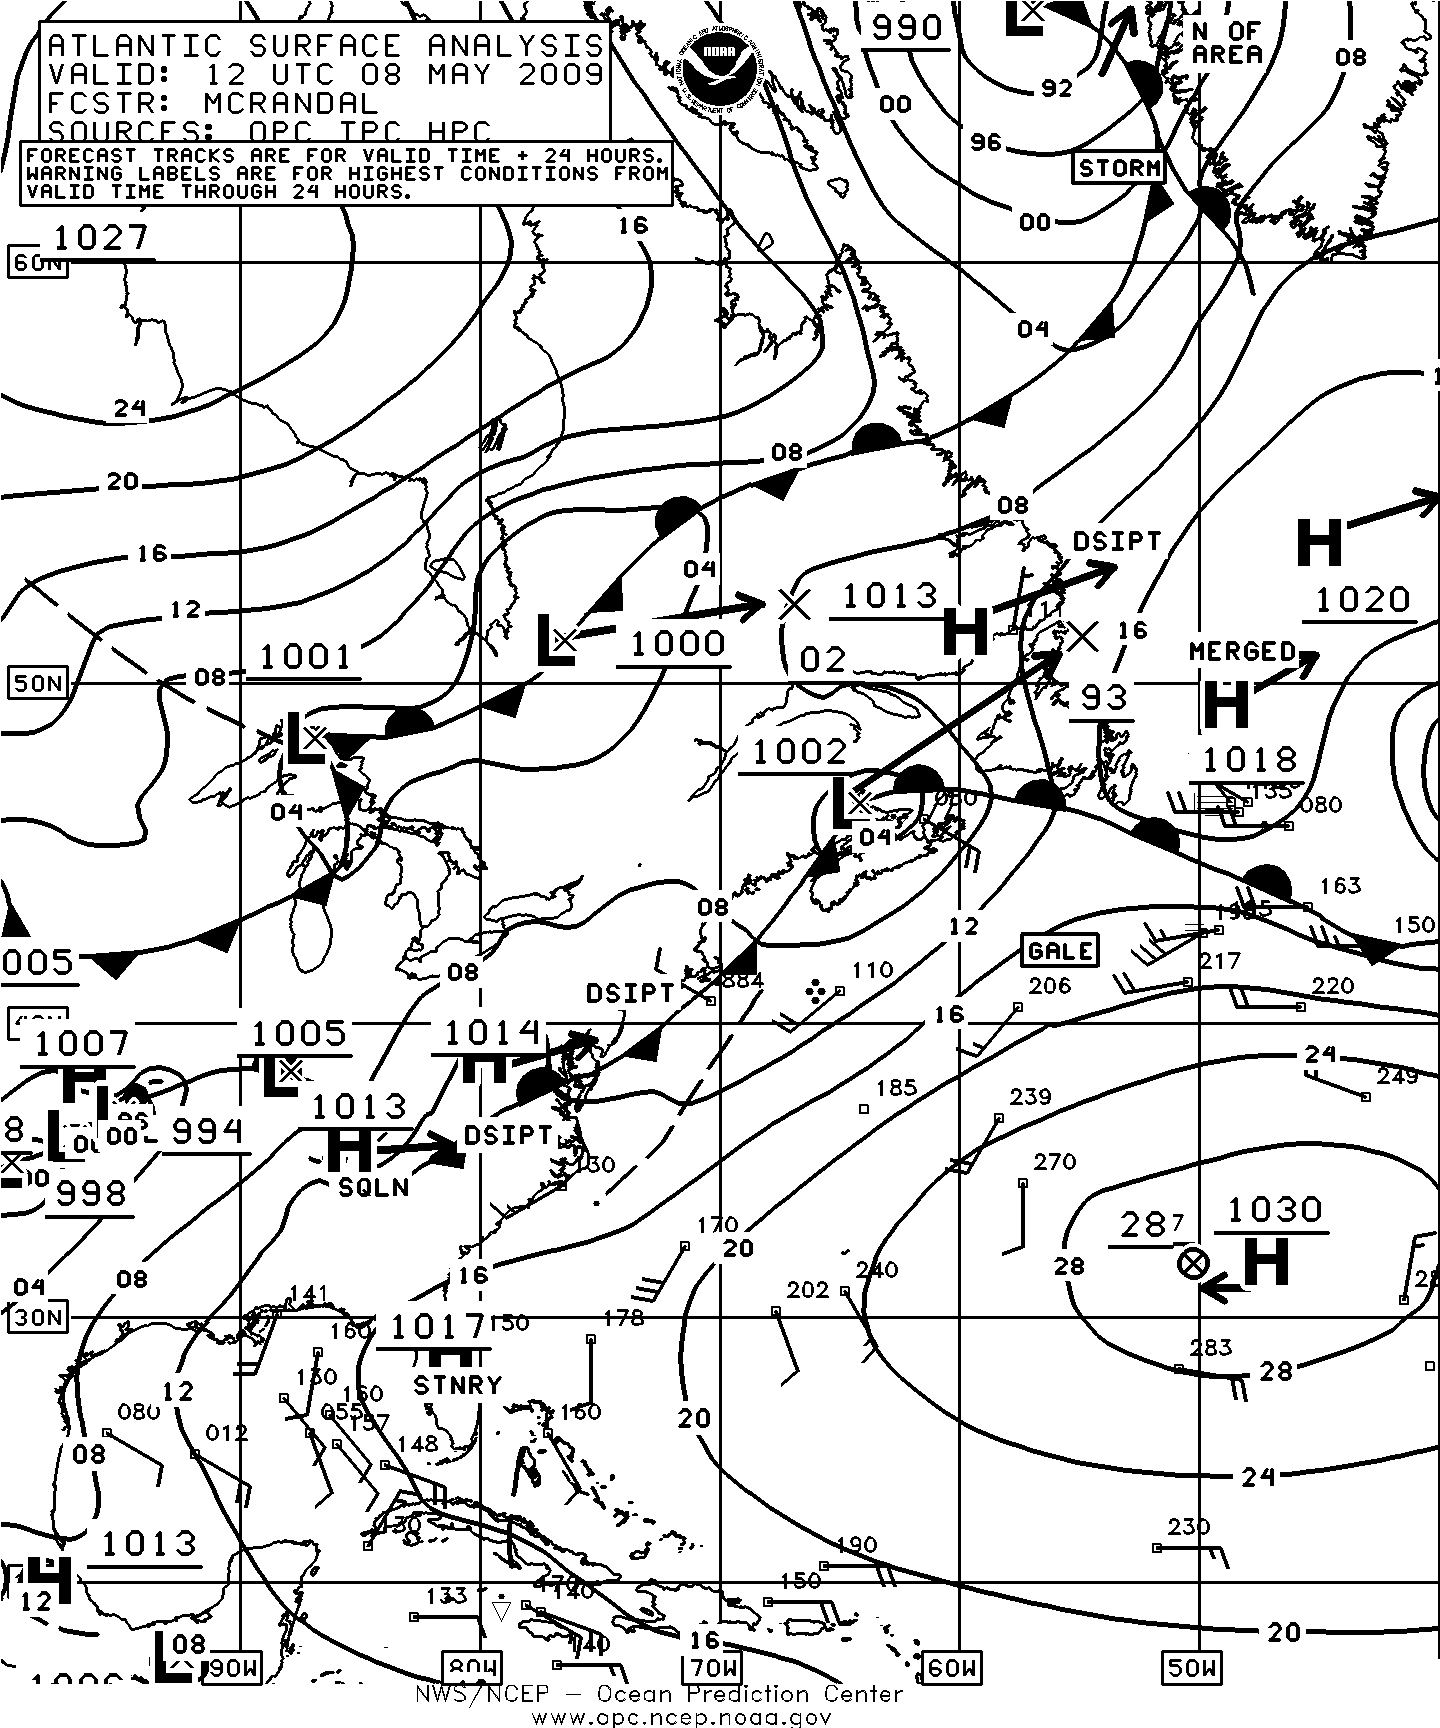
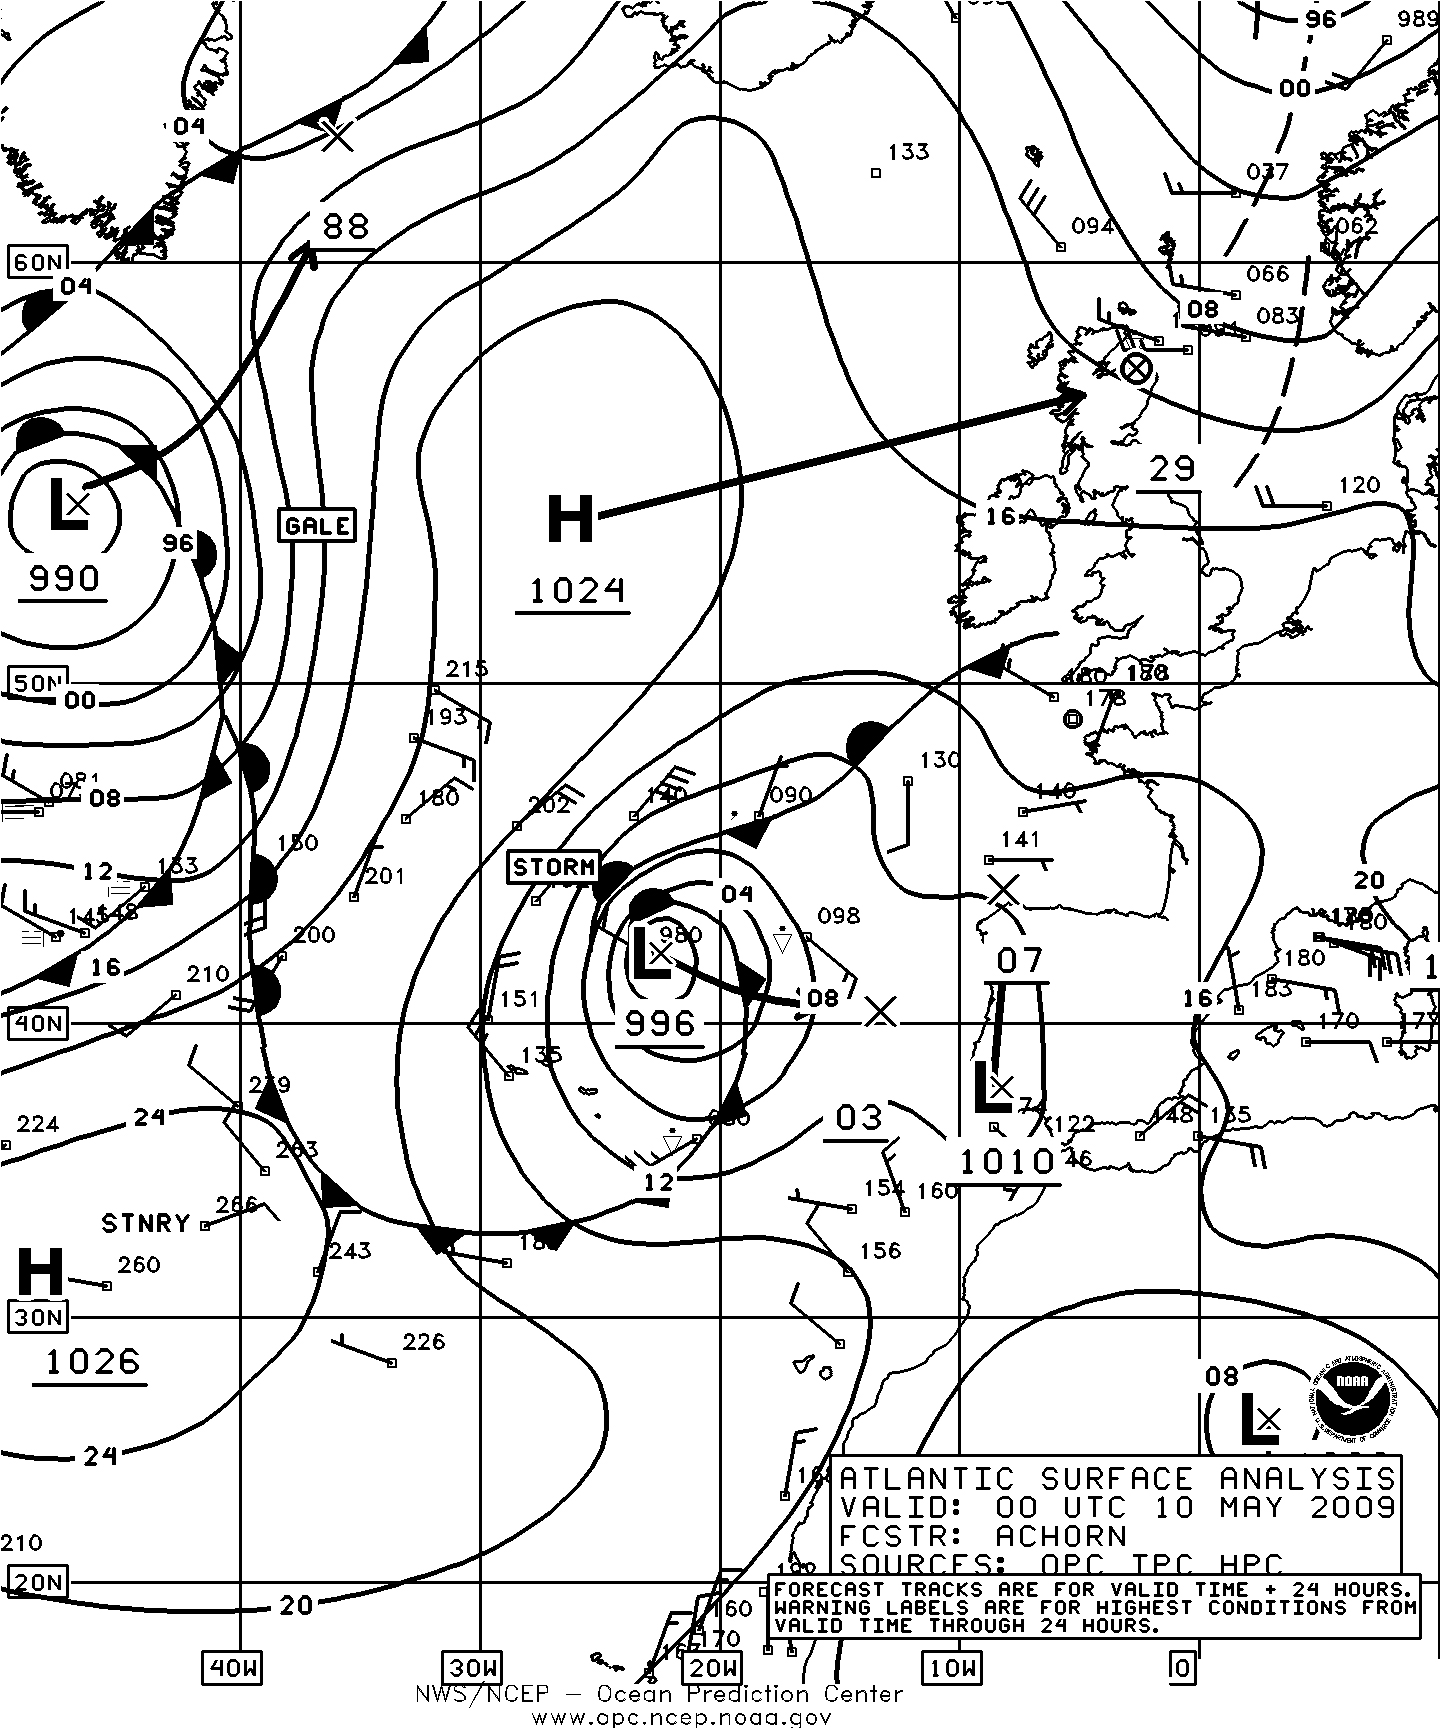
Figure 6. OPC North Atlantic Surface Analysis charts valid 1200 UTC May 8 (Part 2) and 0000 UTC May 10, 2009 (Part 1).
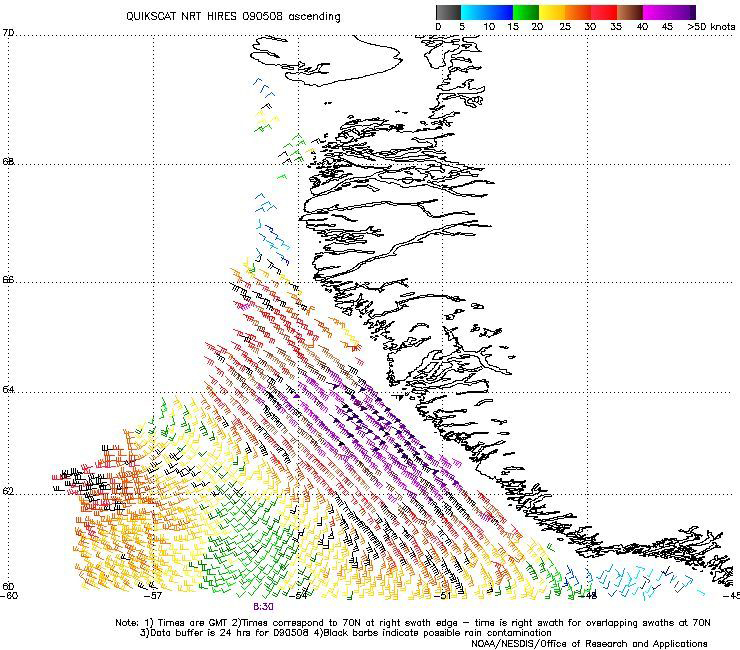
Figure 7. High resolution QuikSCAT scatterometer image of satellite-sensed winds around the east side of the storm in the Davis Strait shown in the first part of Figure 6. The valid time of the pass is 0830 UTC May 8, 2009, or three and one-half hours prior to the valid time of the first part of Figure 6. The center of the storm is over the ice covered (and data free) area in the northwest part of the image. Image is courtesy of NOAA/NESDIS/Office of Research and Applications.
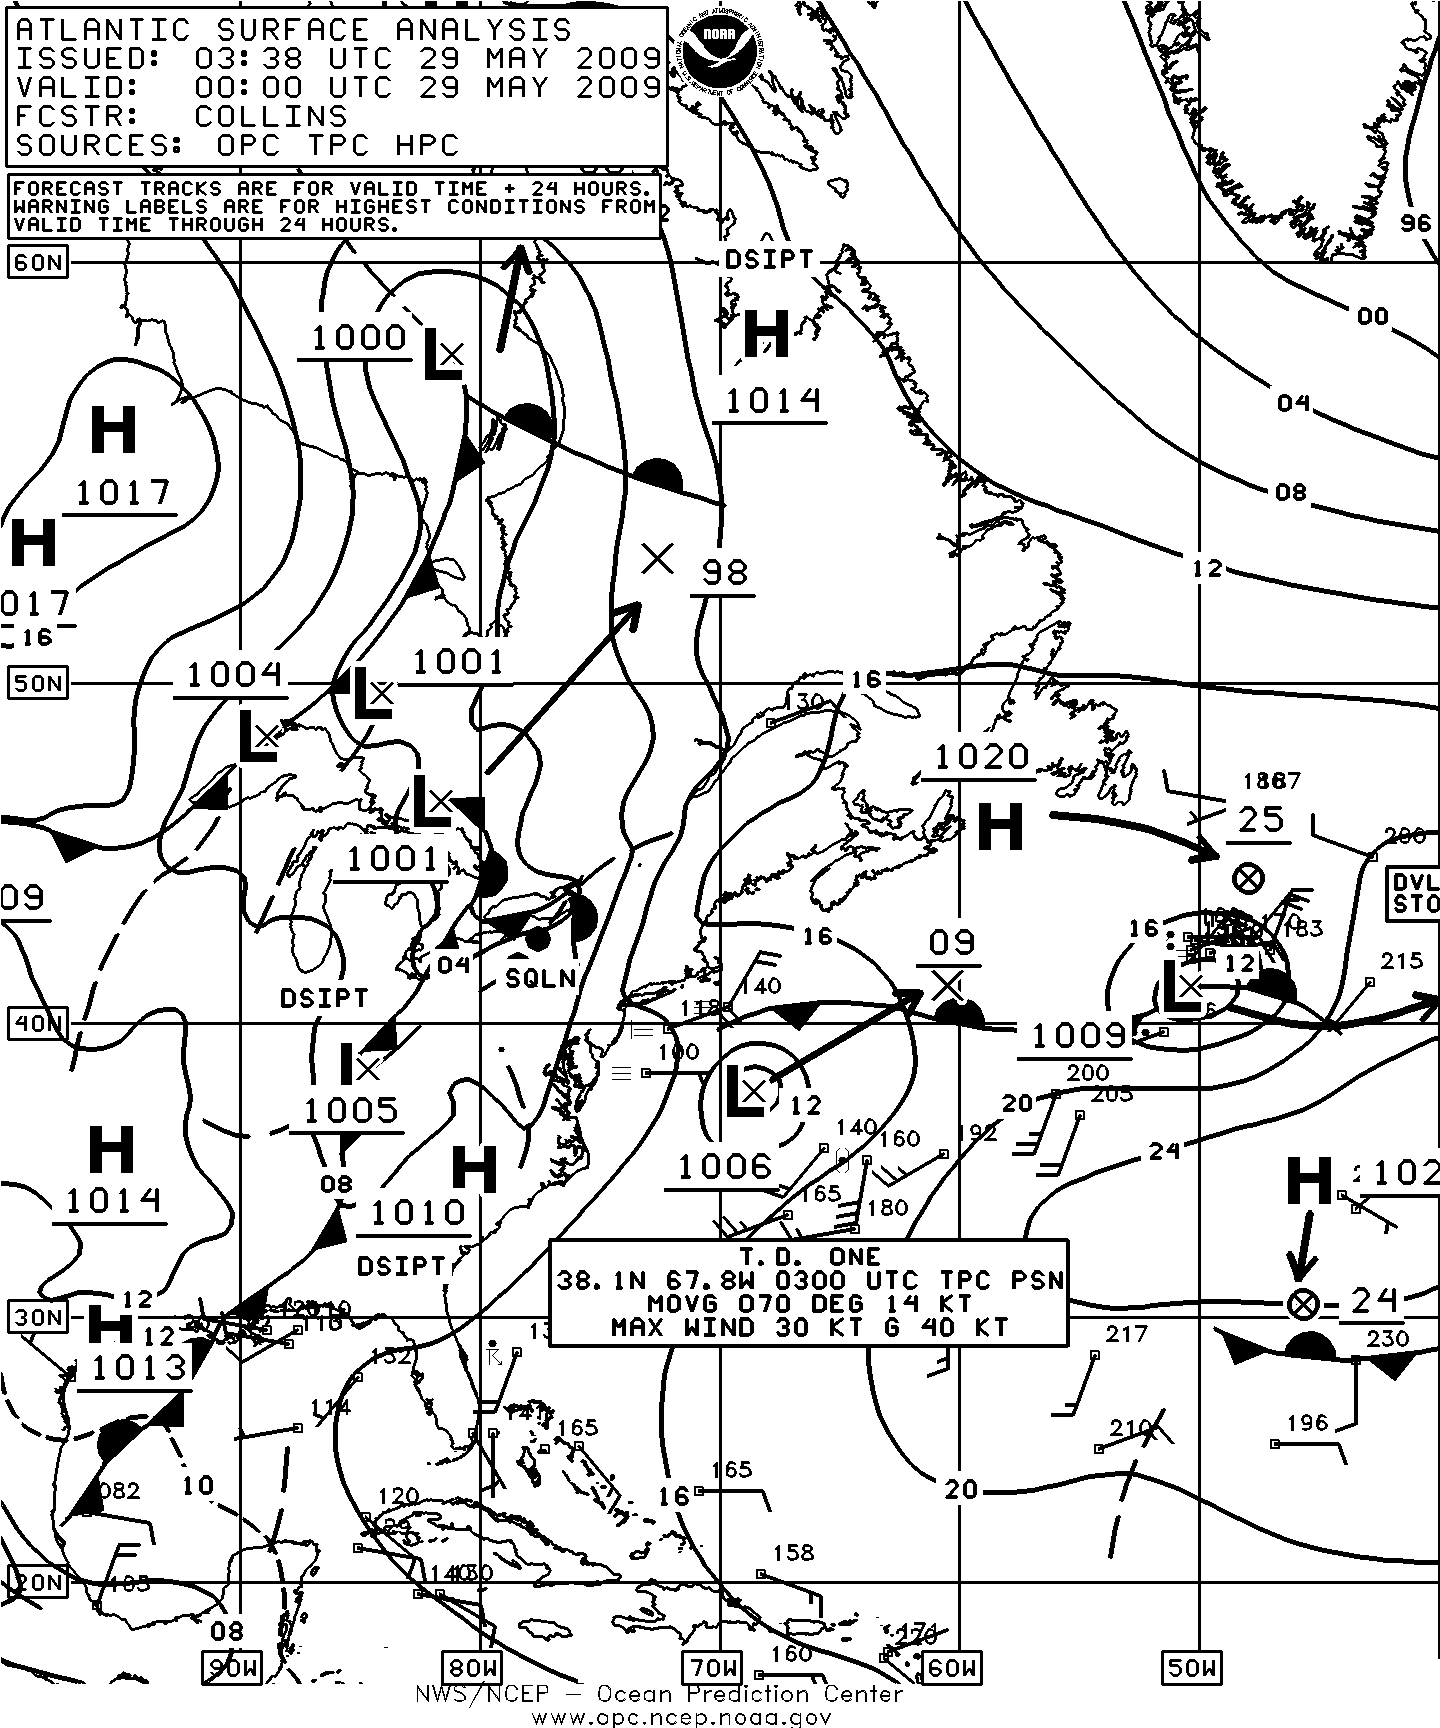
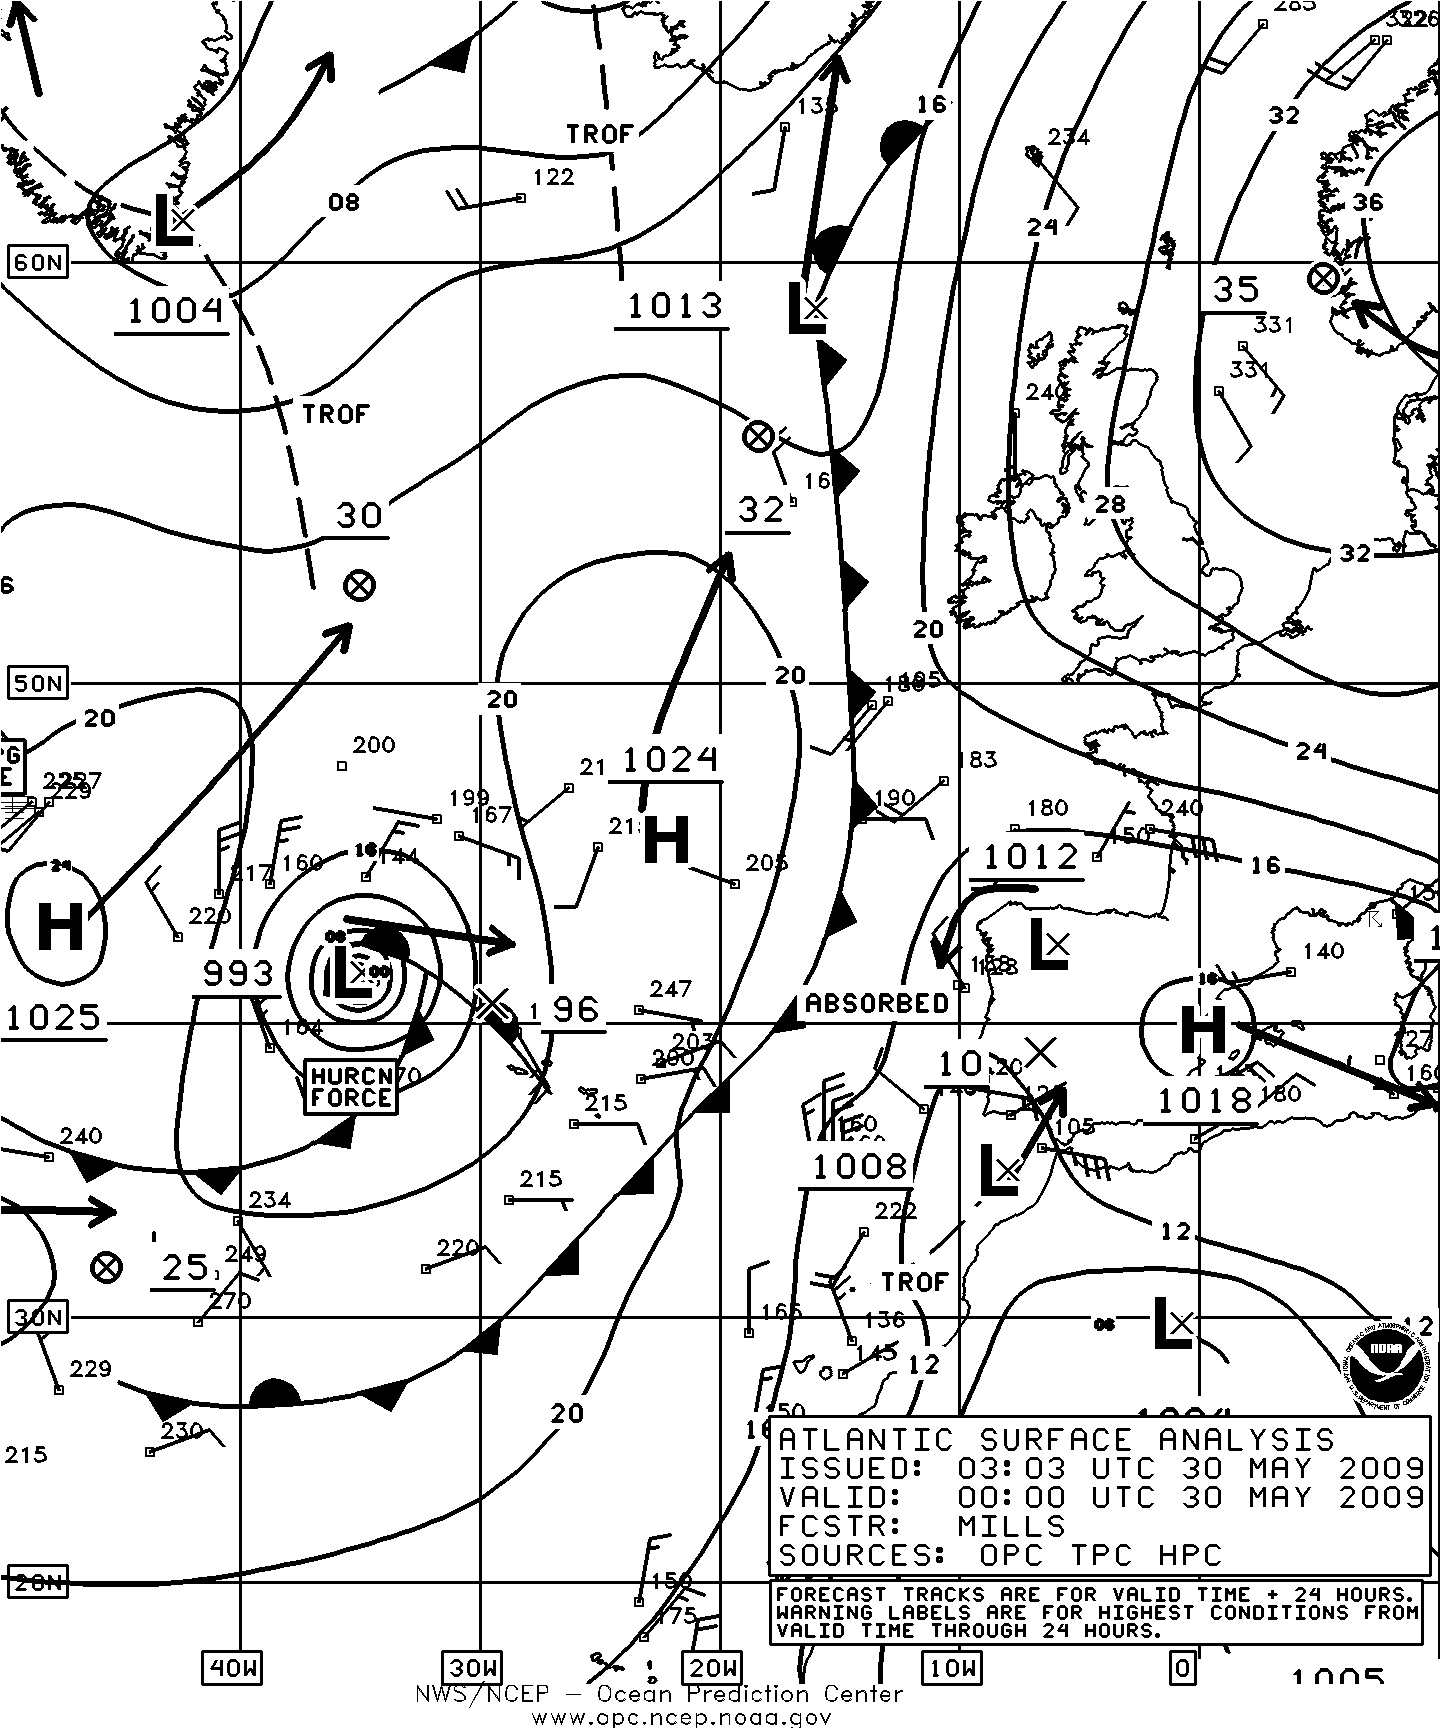
Figure 8. OPC North Atlantic Surface Analysis charts valid 0000 UTC May 29 (Part 2) and 0000 UTC May 30, 2009 (Part 1).
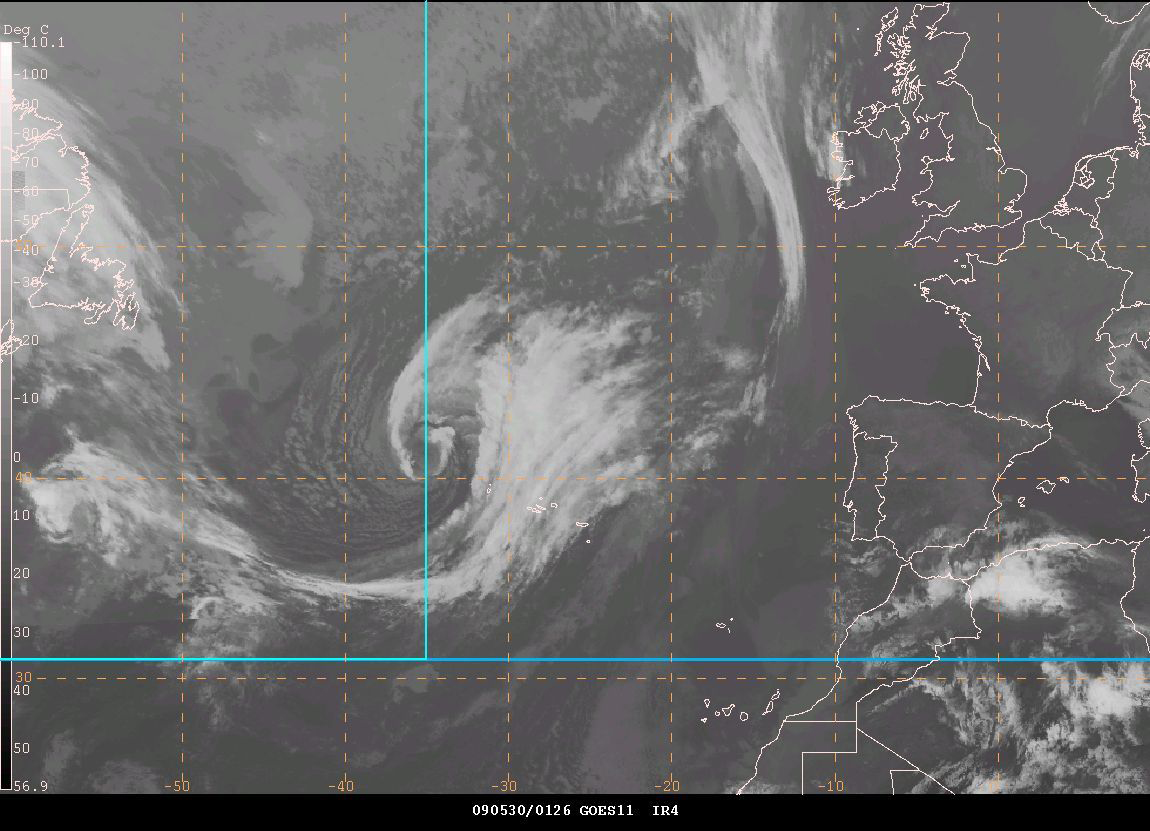
Figure 9. A mosaic of GOES East and METEOSAT9 infrared satellite imagery over the North Atlantic valid 0126 UTC May 30, 2009. The valid time of the image is approximately one and one-half hours later than the valid time of the second part of Figure 8. Satellite senses temperature on a scale from black (warm) to white (cold) in this type of imagery.
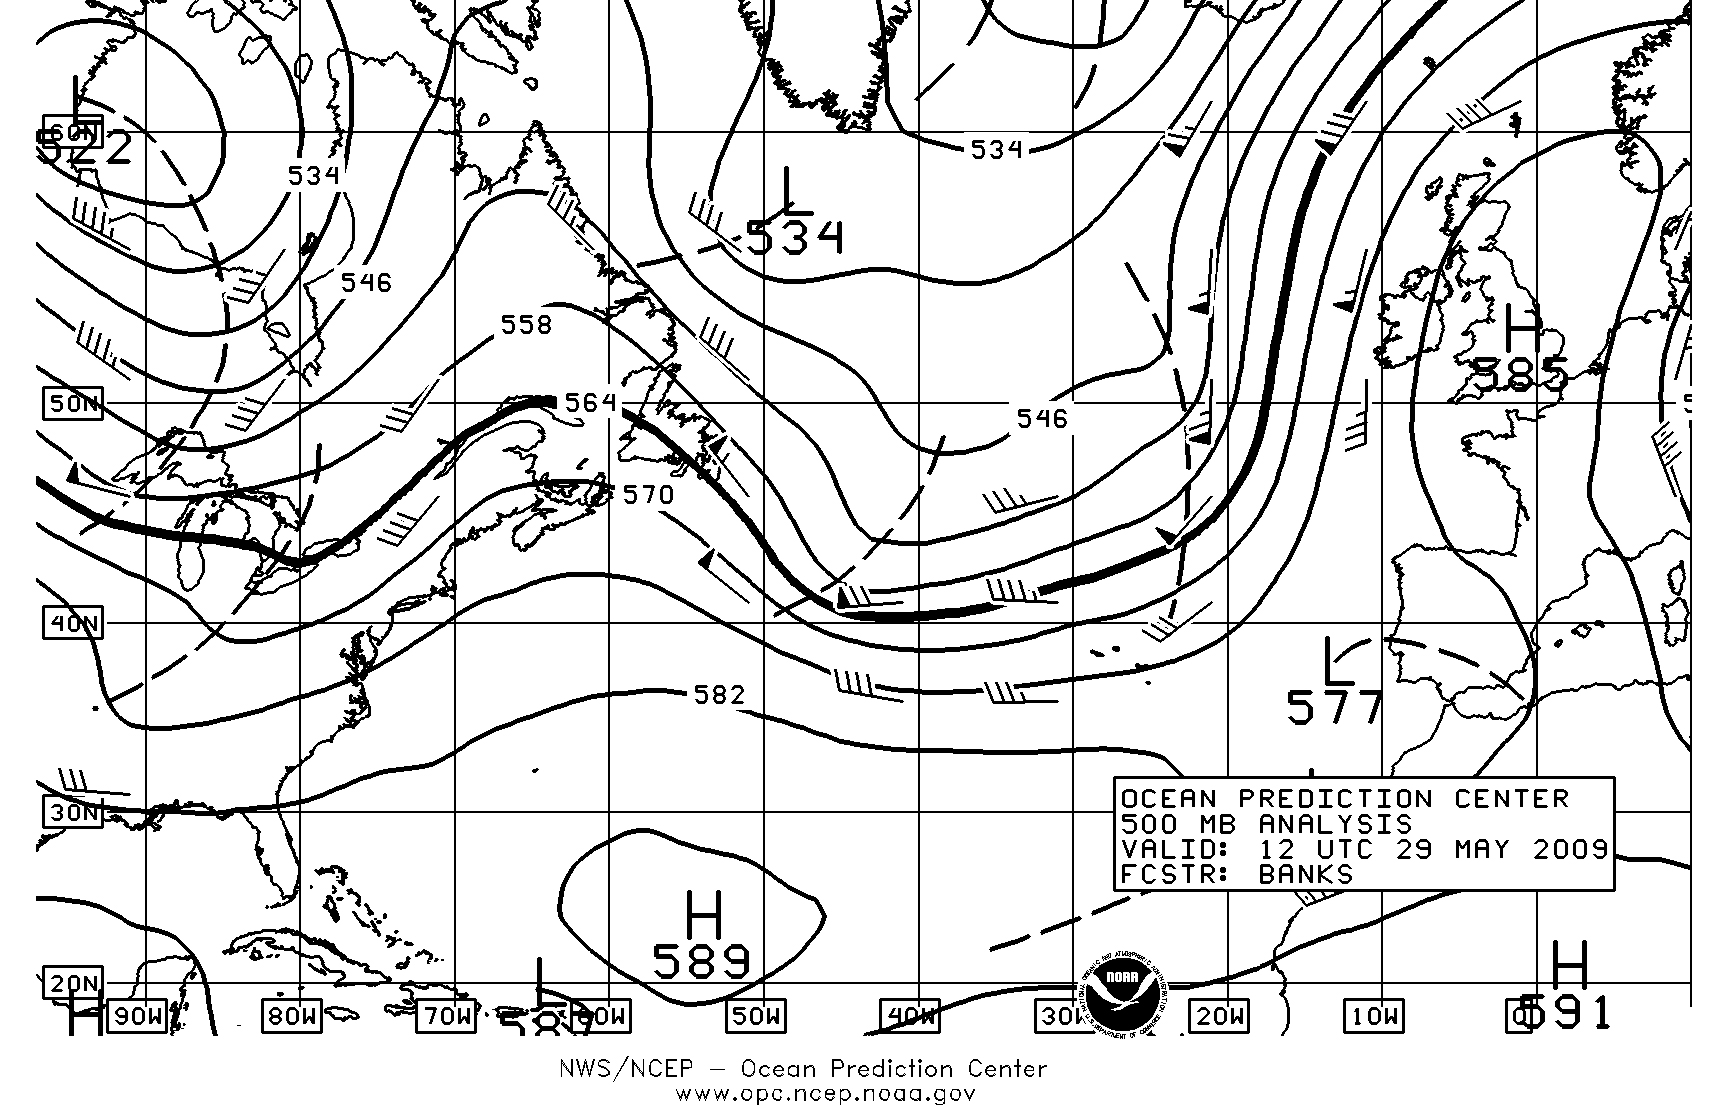
Figure 10. OPC North Atlantic 500-mb analysis valid 1200 UTC May 29, 2009, during the period of rapid intensifi cation of the central North Atlantic low shown in Figure 8. The chart is computer-generated with short-wave troughs (dashed lines) manually added.
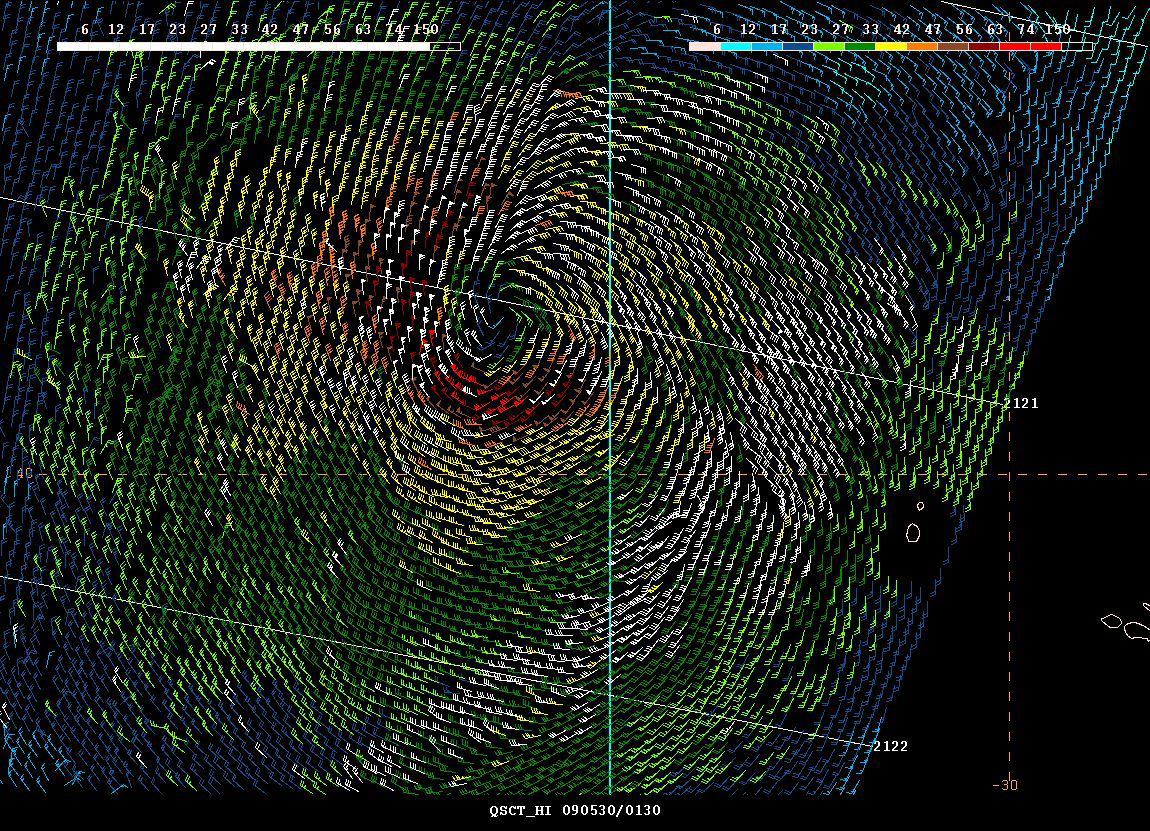
Figure 11. High-resolution QuikSCAT scatterometer image of satellite-sensed winds around the storm shown in the second part of Figure 8. The valid time of the pass is approximately 2121 UTC May 29, 2009, or about two and one-half hours prior to the valid time of the second part of Figure 8. In this version of display adapted to OPC use the diagonal lines labeled with four-digit times are cross-track time lines of the satellite and there is a scale of wind barb colors and associated wind speeds. The center of the storm is near the center of the image and some of the islands of the Azores appear on the lower-right side.
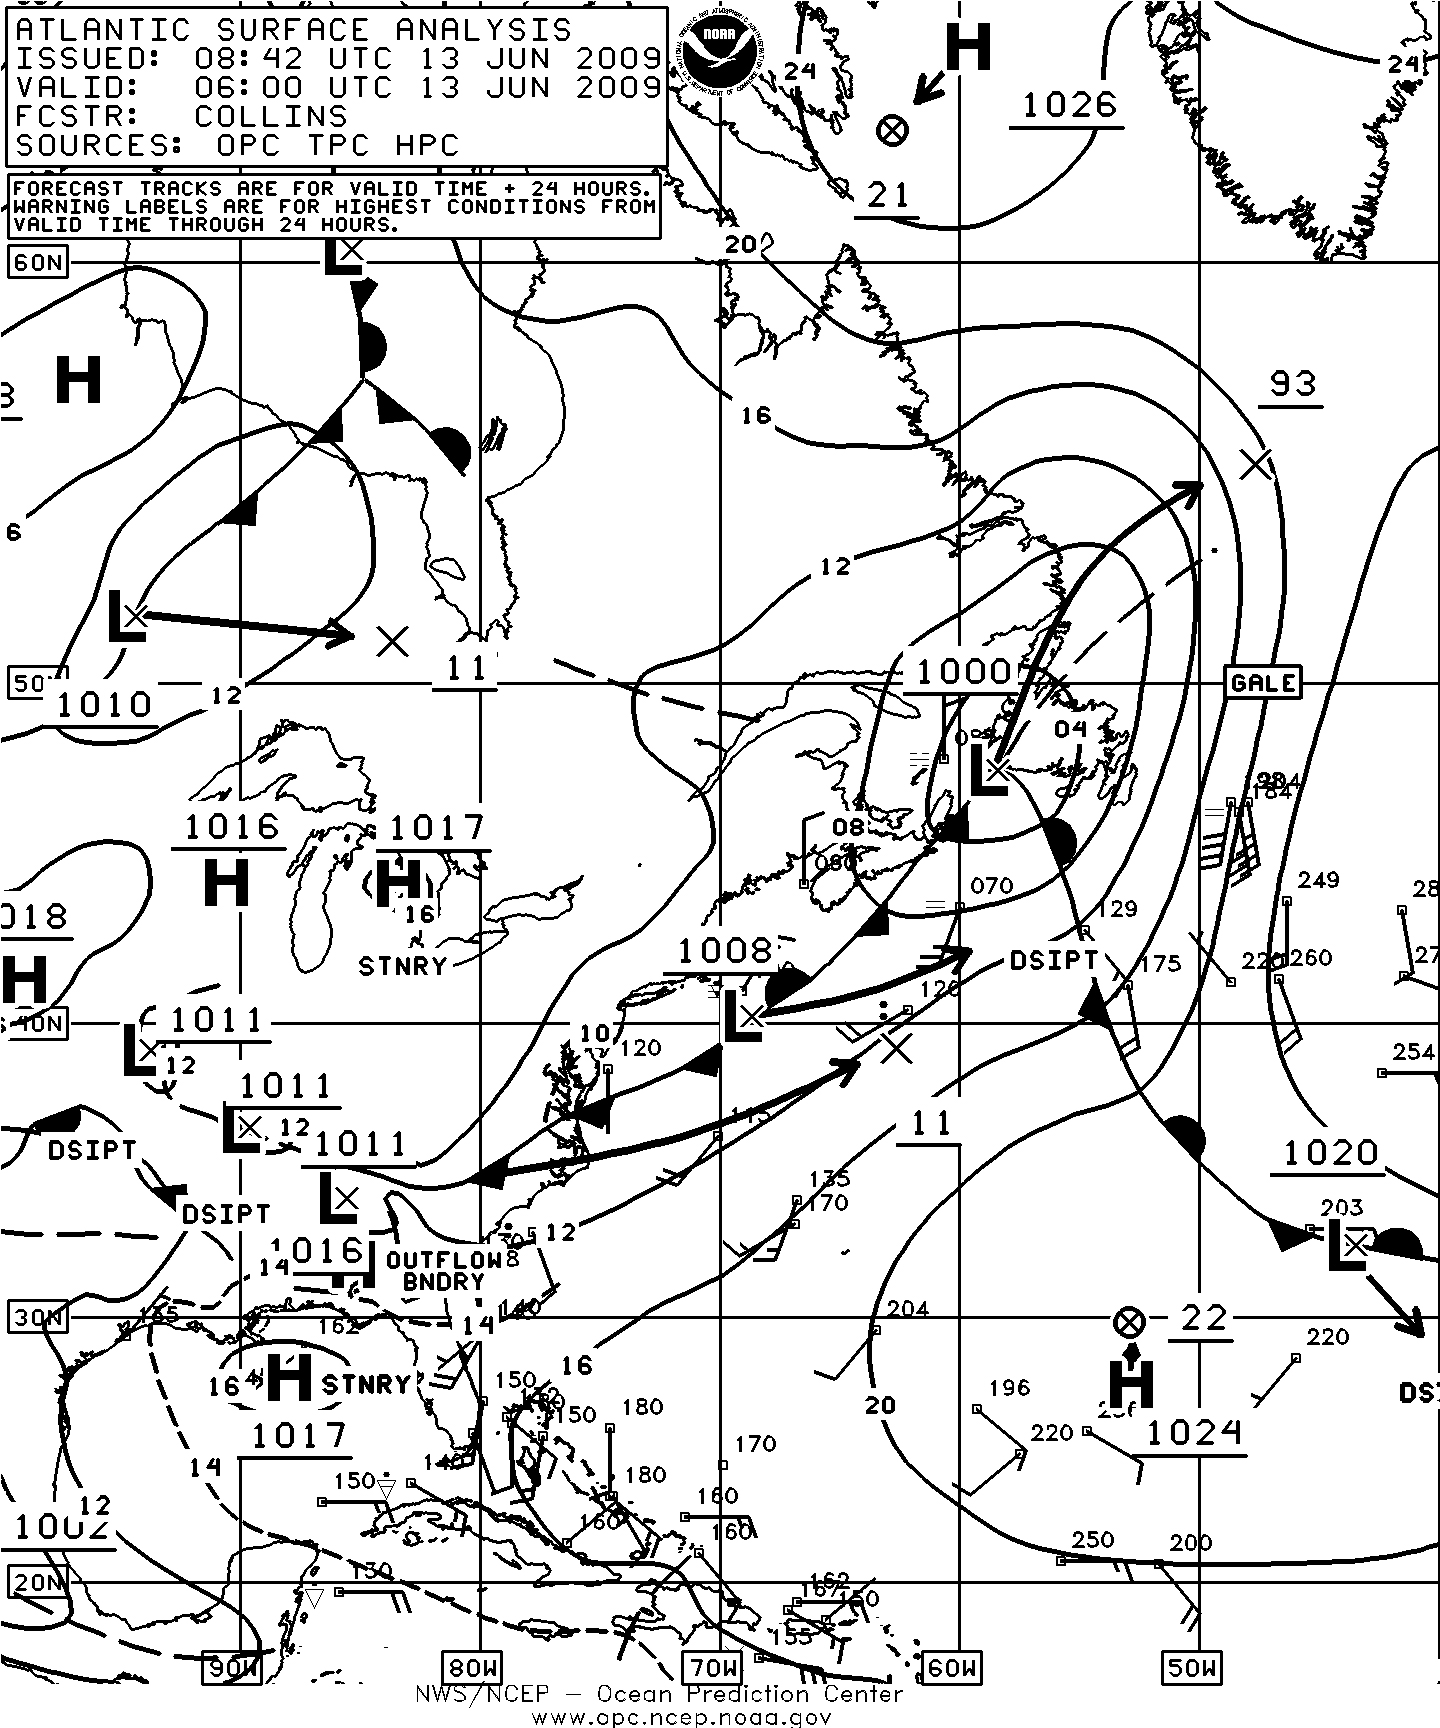
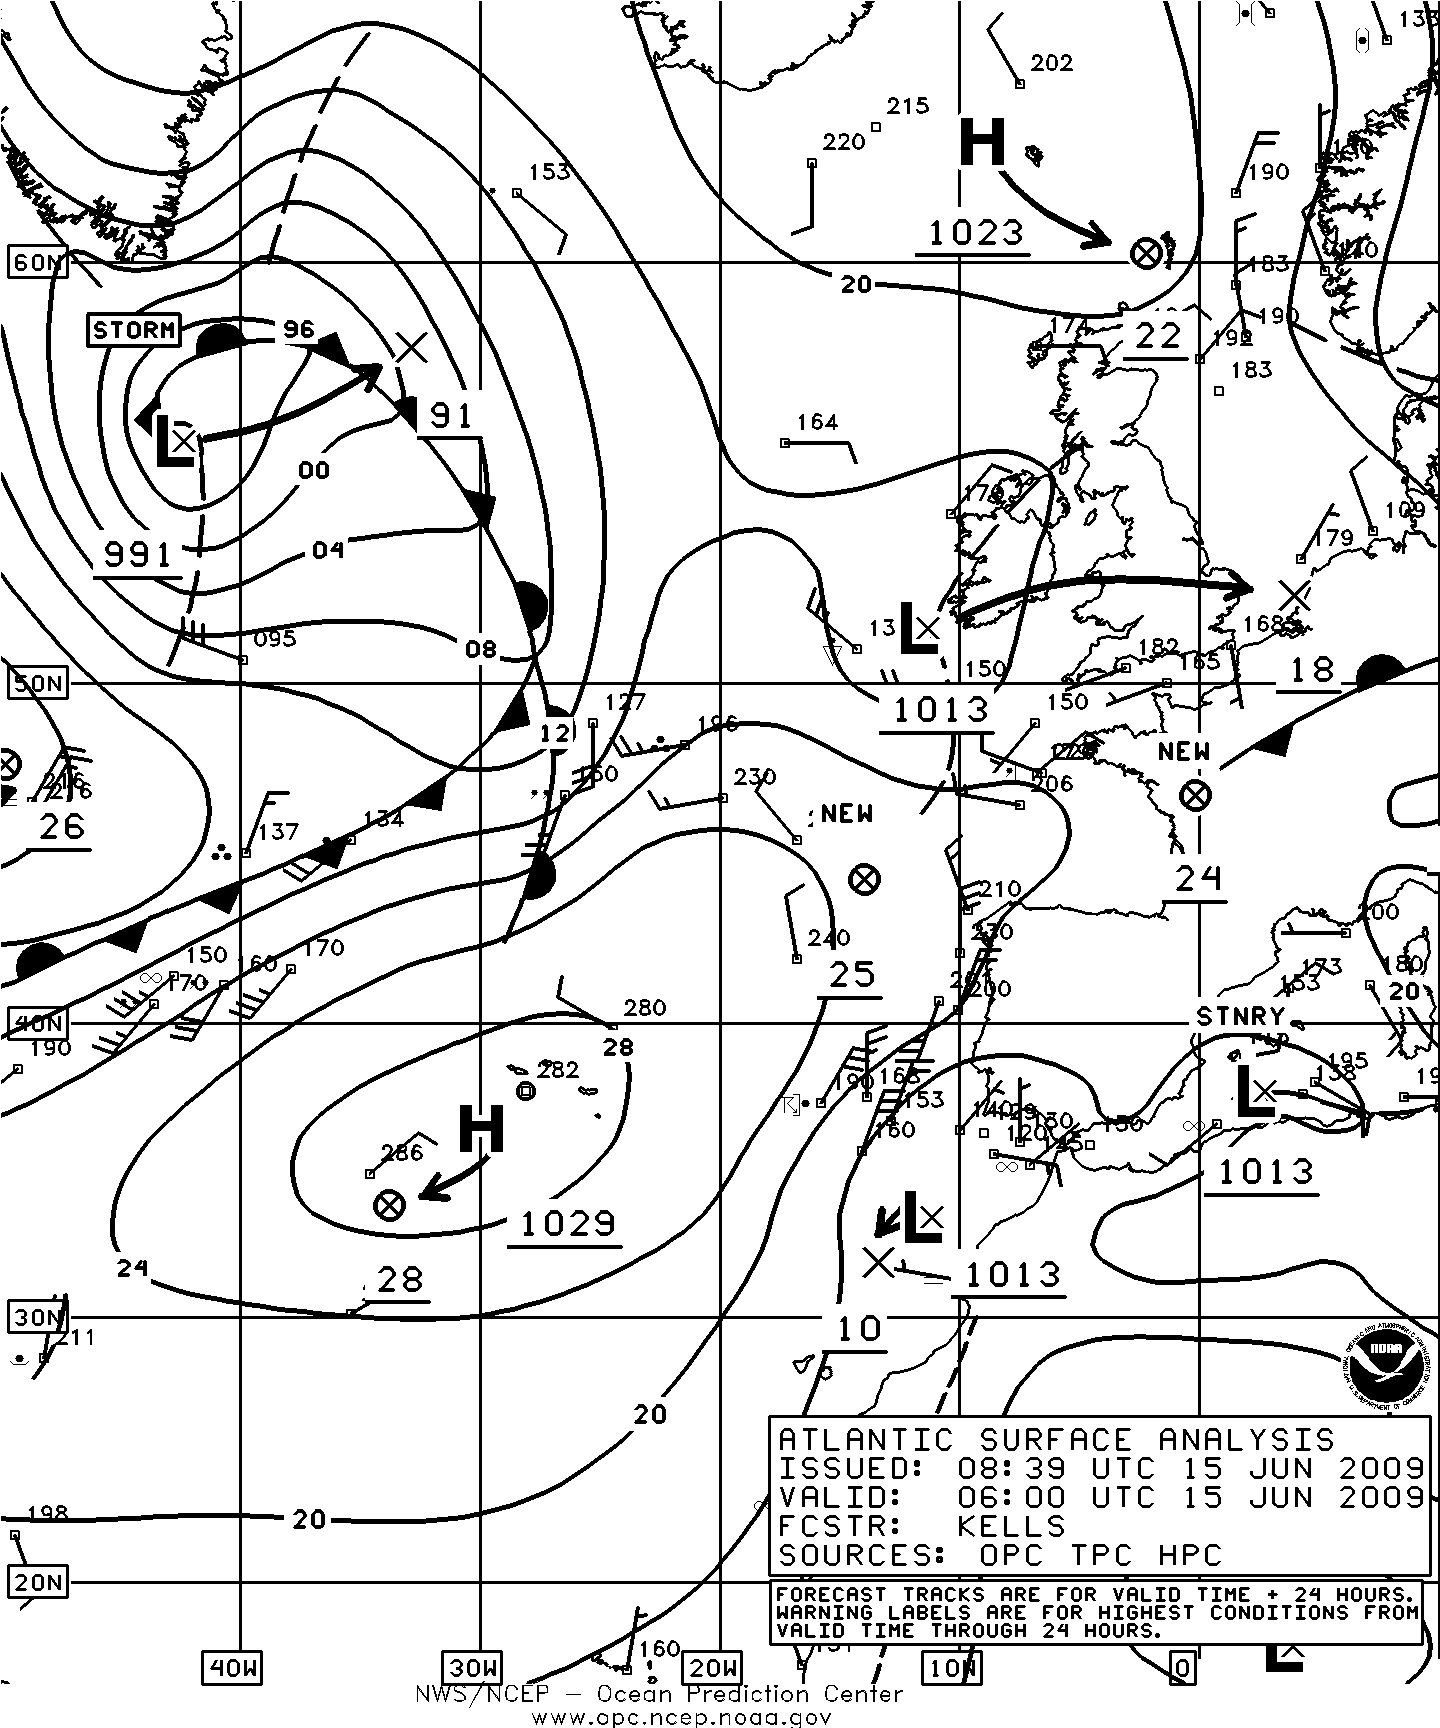
Figure 12. OPC North Atlantic Surface Analysis charts valid 0600 UTC June 13 (Part 2) and 0600 UTC June 15, 2009 (Part 1).
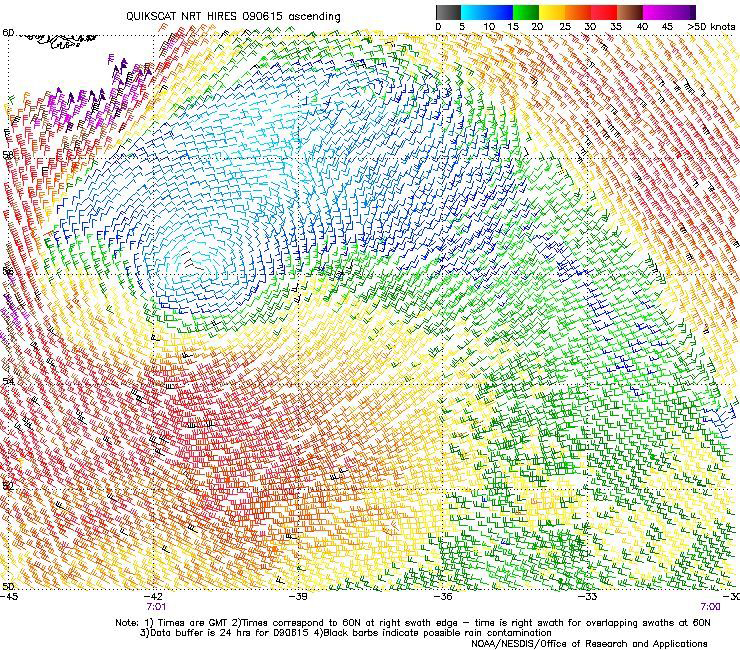
Figure 13. High resolution QuikSCAT scatterometer image of satellite-sensed winds around the storm shown in Figure 12. The valid time of the pass is 0701 UTC June 15, 2009, or about one hour later than the valid time of the second part of Figure 12. The center of the low appears near 56N 41W. The southern tip of Greenland appears near the upper-left corner of the image. Image is courtesy of NOAA/NESDIS/Office of Research and Applications.
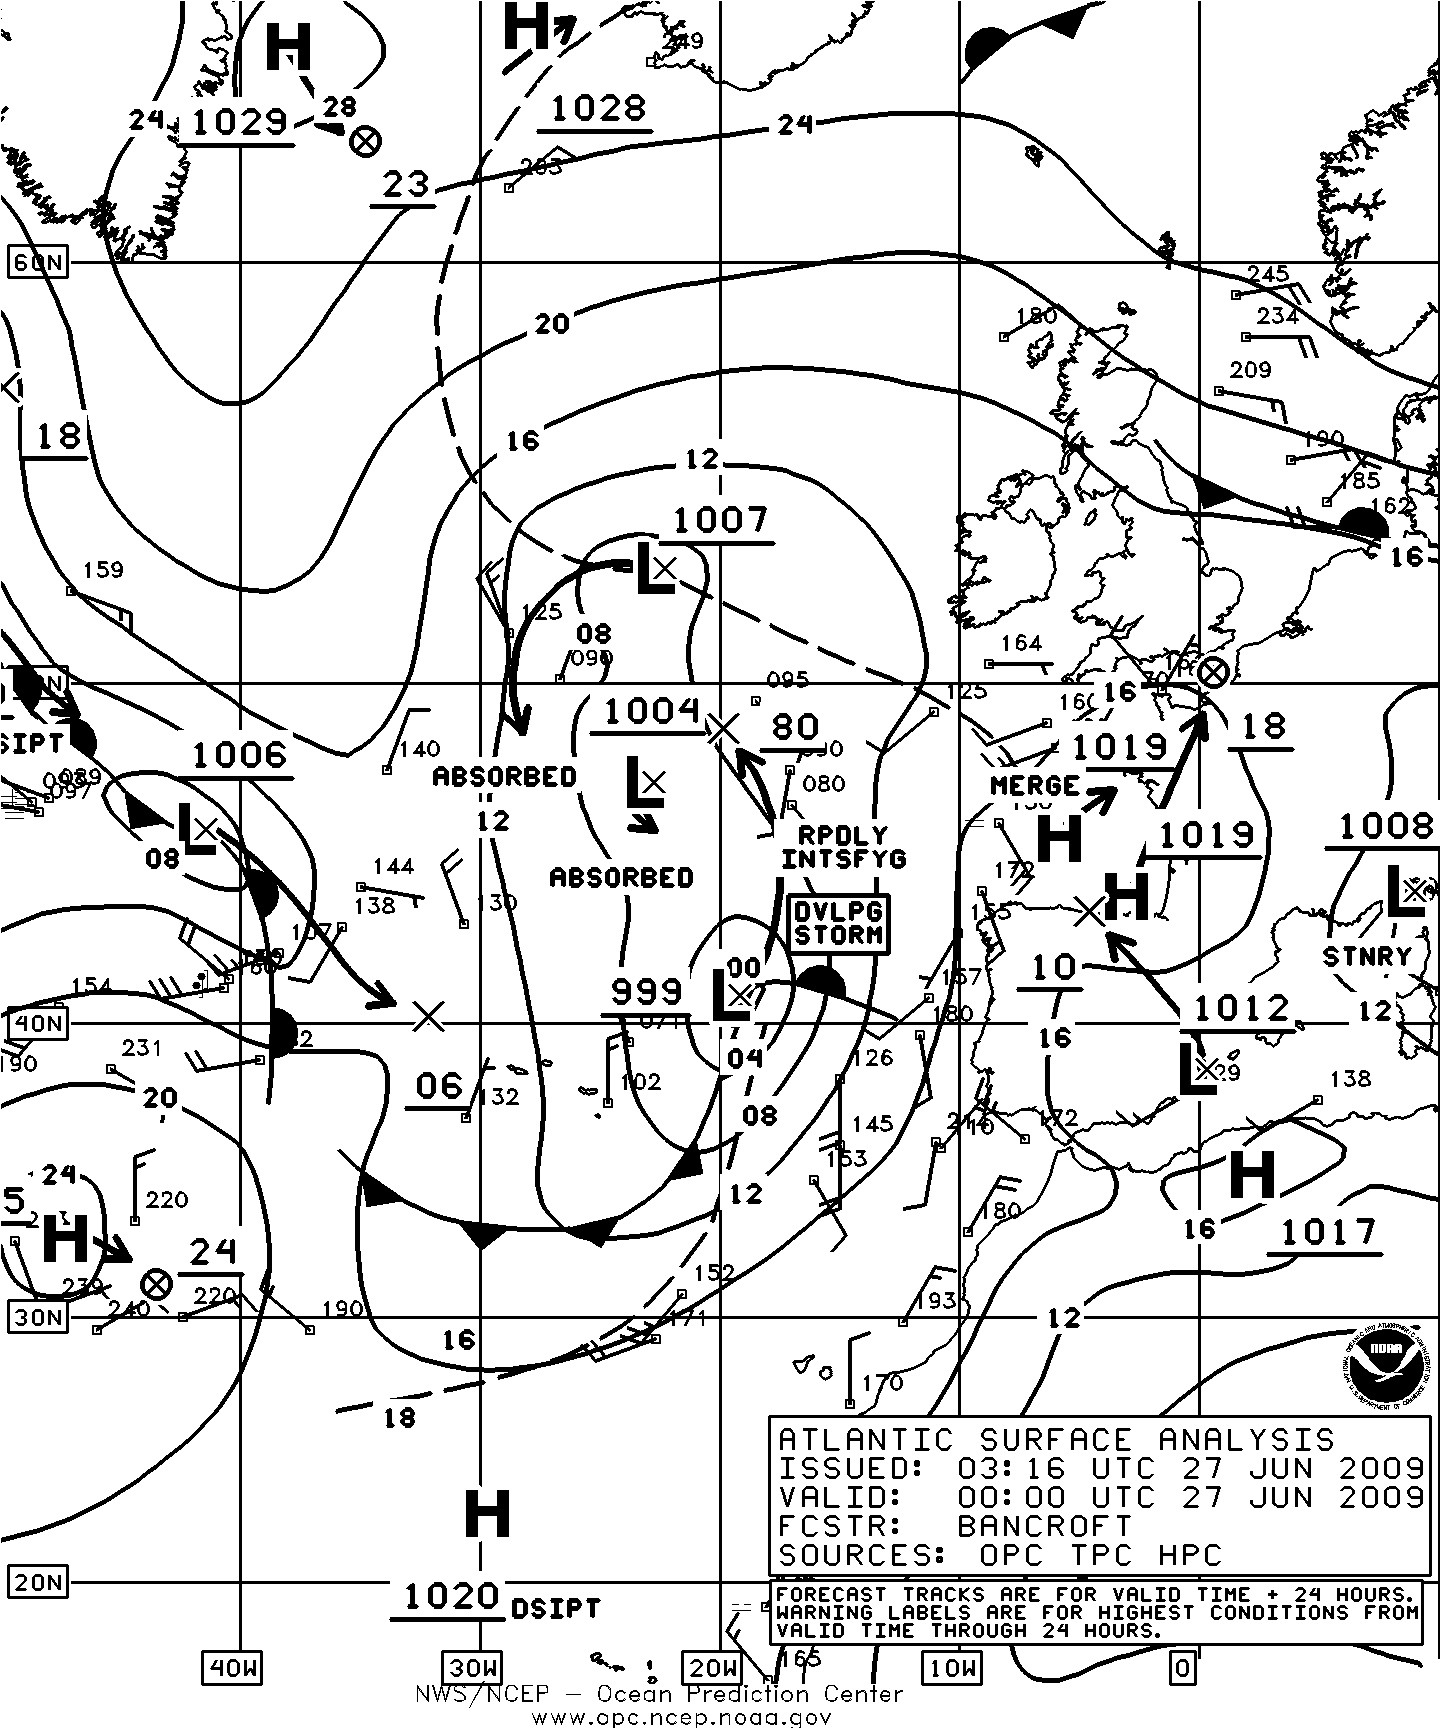
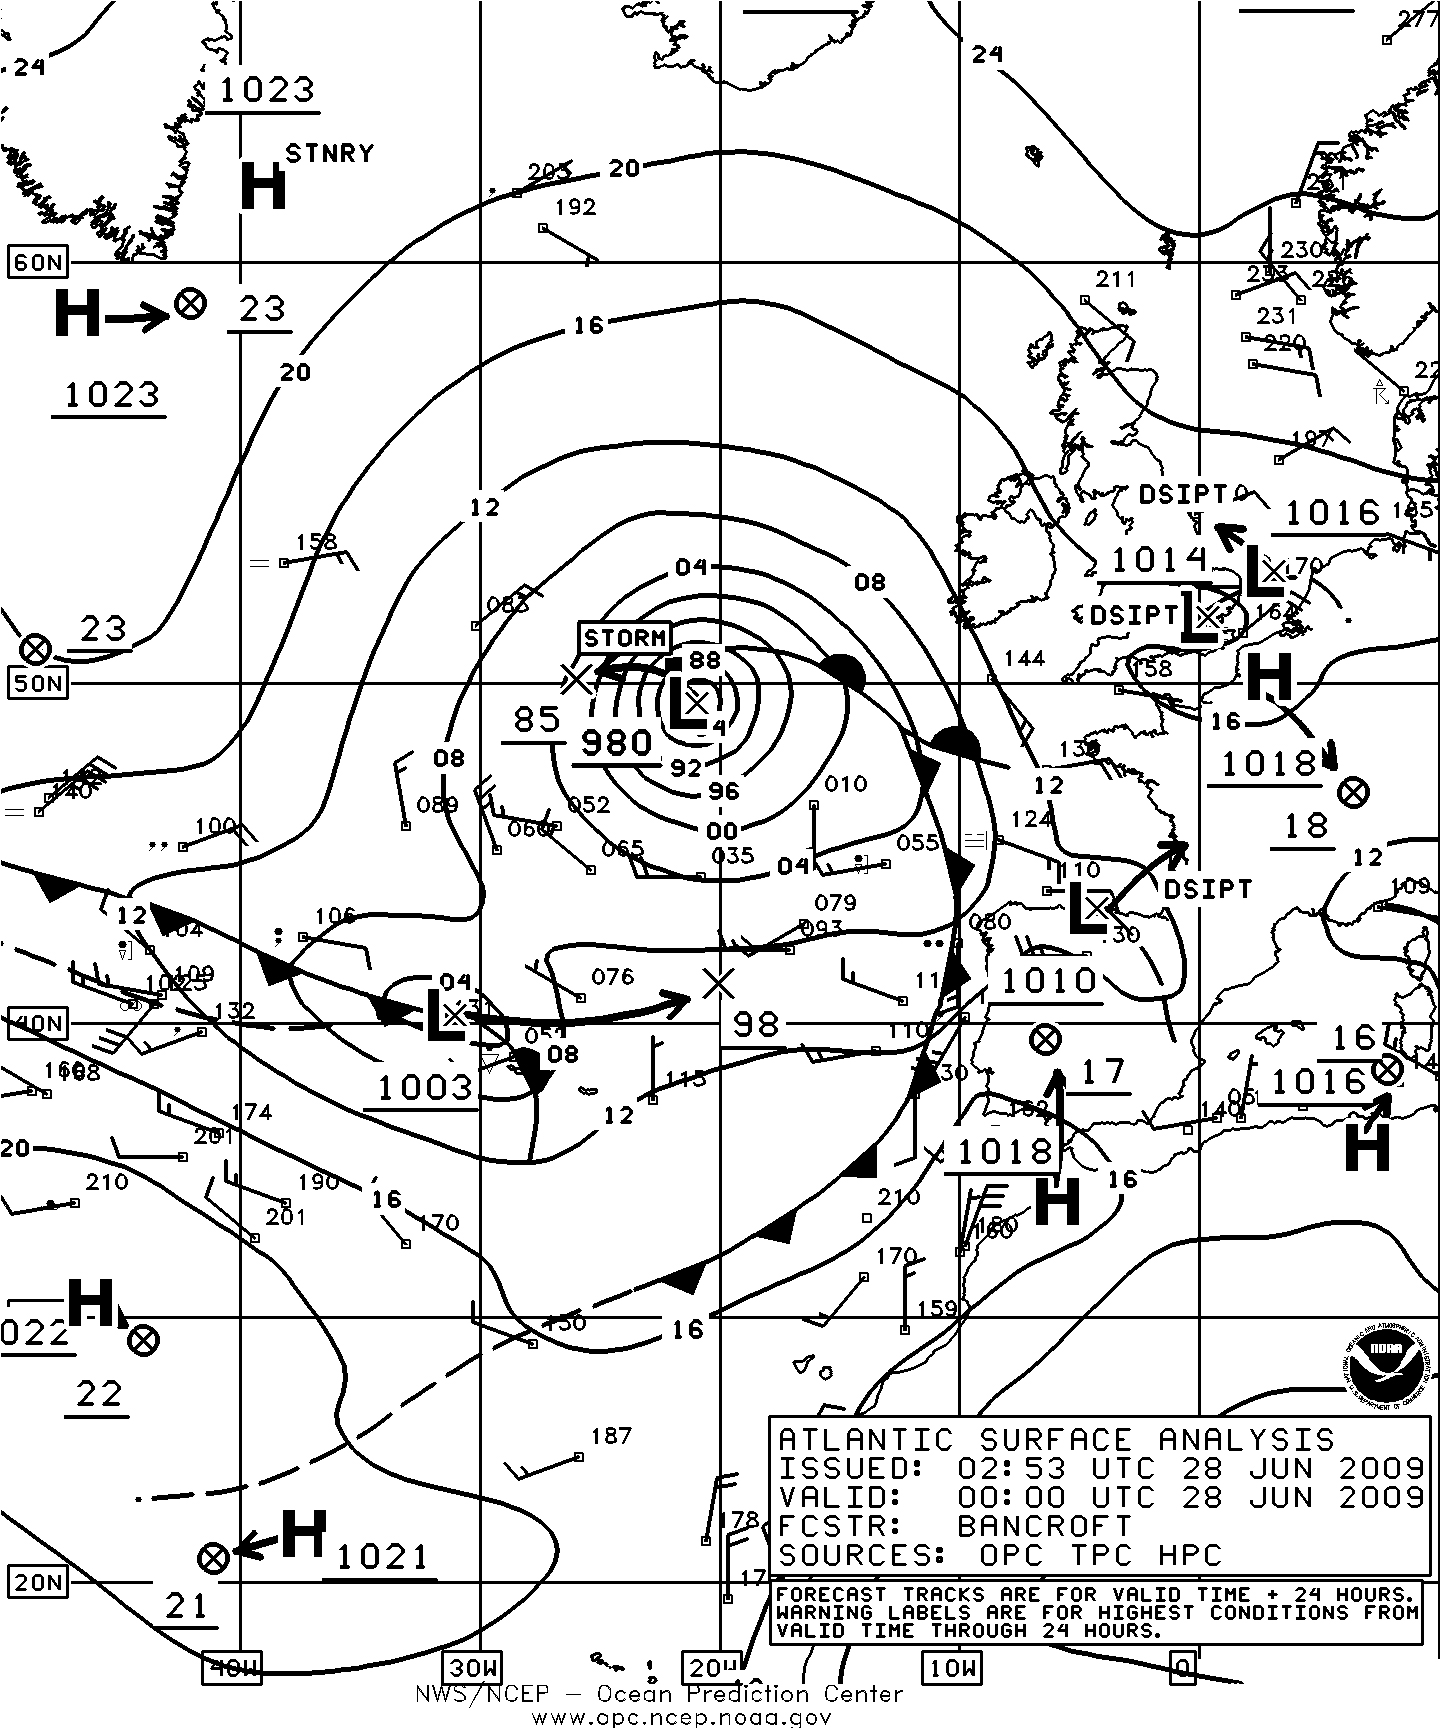
Figure 14. OPC North Atlantic Surface Analysis charts (Part 1) valid 0000 UTC June 27 and 28, 2009.
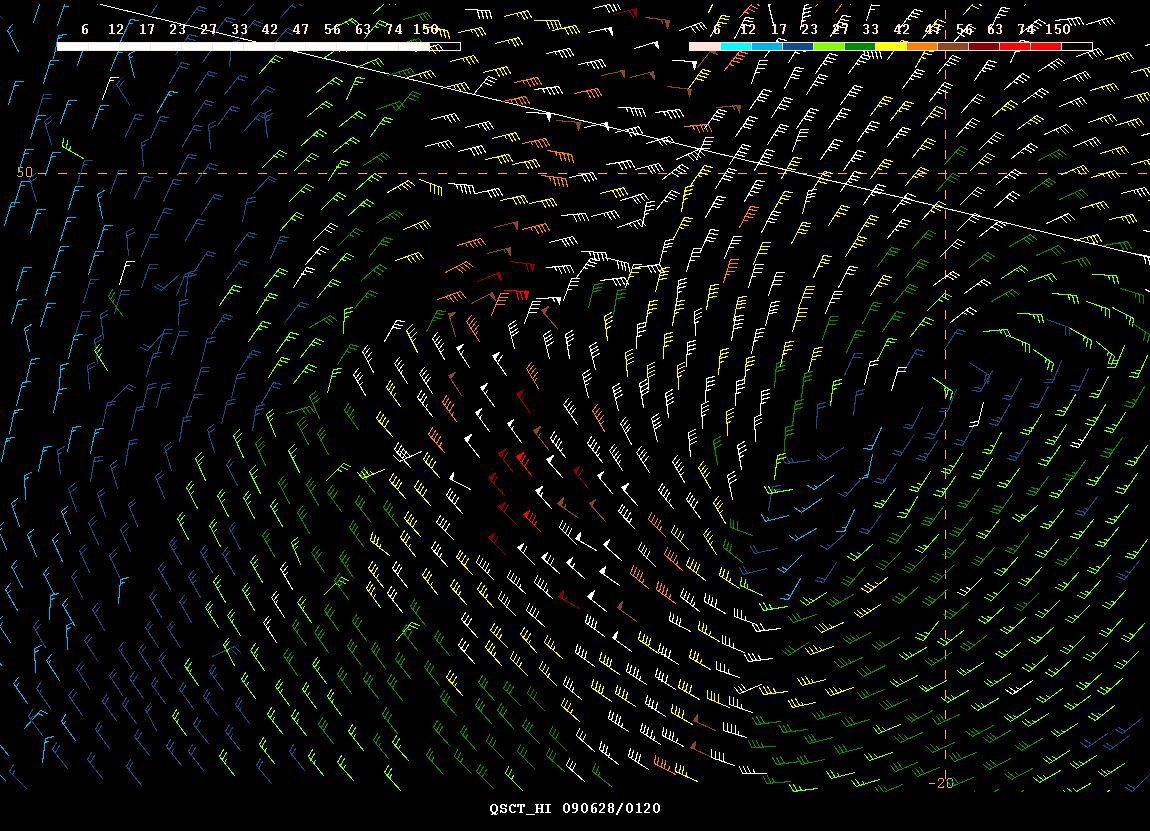
Figure 15. High resolution QuikSCAT scatterometer image of satellite-sensed winds around the storm shown in the second part of Figure 14. The valid time of the pass is approximately 1930 UTC June 27, 2009, or about four and one-half hours prior to the valid time of the second part of Figure 14. This version of display adapted to OPC use is the same type as that found in Figure 11. The center of the storm appears in the right-center part of the image.
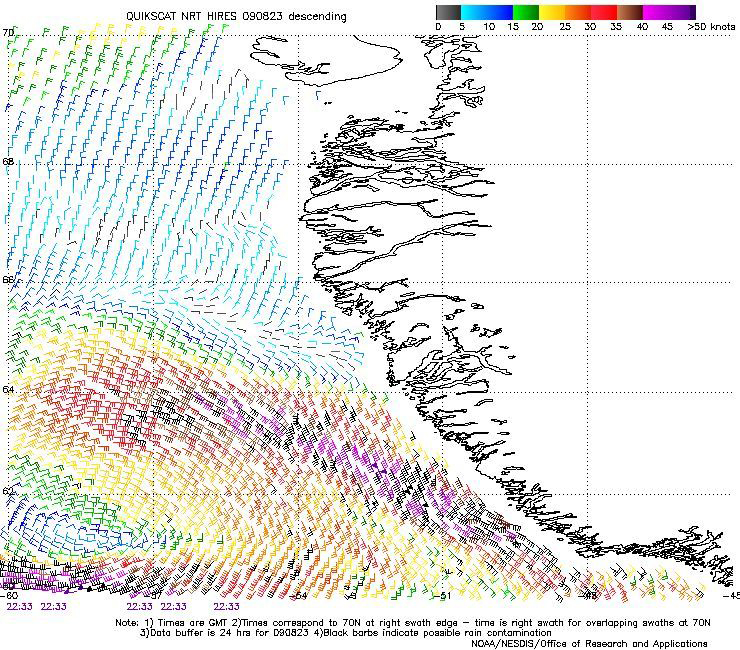
Figure 16. High resolution QuikSCAT scatterometer image of satellite-sensed winds around the storm shown in the first part of Figure 1. The valid time of the pass is 2233 UTC August 23, 2009, or about four and one-half hours later than the valid time of the first part of Figure 1. The center of the storm is near the lower-left corner of the image. Image is courtesy of NOAA/NESDIS/ Office of Research and Applications.
Back to top