Marine Weather Review North Pacific Area
May to August 2008
Introduction
The period of May to August includes the summer months, a time of weaker cyclonic activity. For the North Pacific 2008 was no exception, with May being most active with seven low pressure areas of non tropical origin producing winds of storm force or higher, while June and July featured no low pressure systems with winds exceeding gale force (higher than 47 kts). Activity picked up again in August beginning in the second week with the pattern becoming more fall-like as four cyclones developed storm force winds as they tracked east and northeast toward the northeastern waters. Like many of the non tropical significant events during this four month period, they were mainly central and northeast Pacific events.
Six western Pacific tropical cyclones affected OPCs ocean basin radiofacsimile chart area during the period, with Super Typhoon Rammasun occurring early in May, Tropical Storm Matmo in the middle of May, Tropical Storm Halong in late May, Typhoon Nakri in late May and early June, and Tropical Storms Vongfong and Nuri in mid-August. All affected the waters south of Japan before continuing west or recurving into the mid-latitude westerlies and becoming extra-tropical lows (with fronts) of the type found in middle and higher latitudes. All except Nuri became extra-tropical in OPCs waters but none redeveloped into intense extra-tropical lows with central pressures below 980 hPa.
Tropical Activity
Super Typhoon Rammasun:
Rammasun moved north into OPCs oceanic chart area well south of Japan fully developed as a super typhoon, near 17N 132E, with maximum sustained winds 135 kts and gusts to 165 kts, early on May 10. This intensity would be equivalent to a strong Category 4 on the Saffir-Simpson scale (Reference 4). Rammasun moved north with a gradual turn to the northeast and began a weakening trend on the 11th. By 1200 UTC on the 12th Rammasun was located near 29N 138E with winds down to minimal typhoon strength (maximum sustained winds of 65 kts with gusts to 80 kts) and is shown in the first part of Figure 3. Table 1 lists selected observations mainly from ships taken during passage of Rammasun. Rapid weakening followed, with Rammasun becoming extra-tropical twelve hours later and becoming a disorganized area of low pressure near 36N 162E late on the 14th with winds below gale force.
| Observation | Position | Date/Time (UTC) | Wind | Seas (m/ft) |
|---|---|---|---|---|
| Nikkei Eagle | 22N 136E 24N 136E |
12/0000 12/0600 |
SW 50 SW 45 | 8.0/26 8.0/26 |
| Unknown ship | 26N 131E | 12/0000 | N 40 | 8.5/28 |
| Unknown ship | 32N 134E | 12/0000 | NE 45 | 5.0/16 |
| Puteri Muitiara Satu | 32N 136E | 12/0600 | E 40 | |
| Bishu Maru | 33N 139E 33N 136E |
12/0900 12/1200 |
NE 45 NE 50 |
|
| PMSA | 33N 138E | 12/1200 | NE 50 | |
| Hanjin Boston | 41N 142E | 13/1200 | E 35 | 7.0/23 |
| MSC Texas | 31N 154E | 13/1800 | SW 35 | |
| Unknown ship | 36N 160E | 13/2100 | E 35 | 5.0/16 |
| Buoy 28401 | 32.3N 144E | 12/1500 | E 35 |
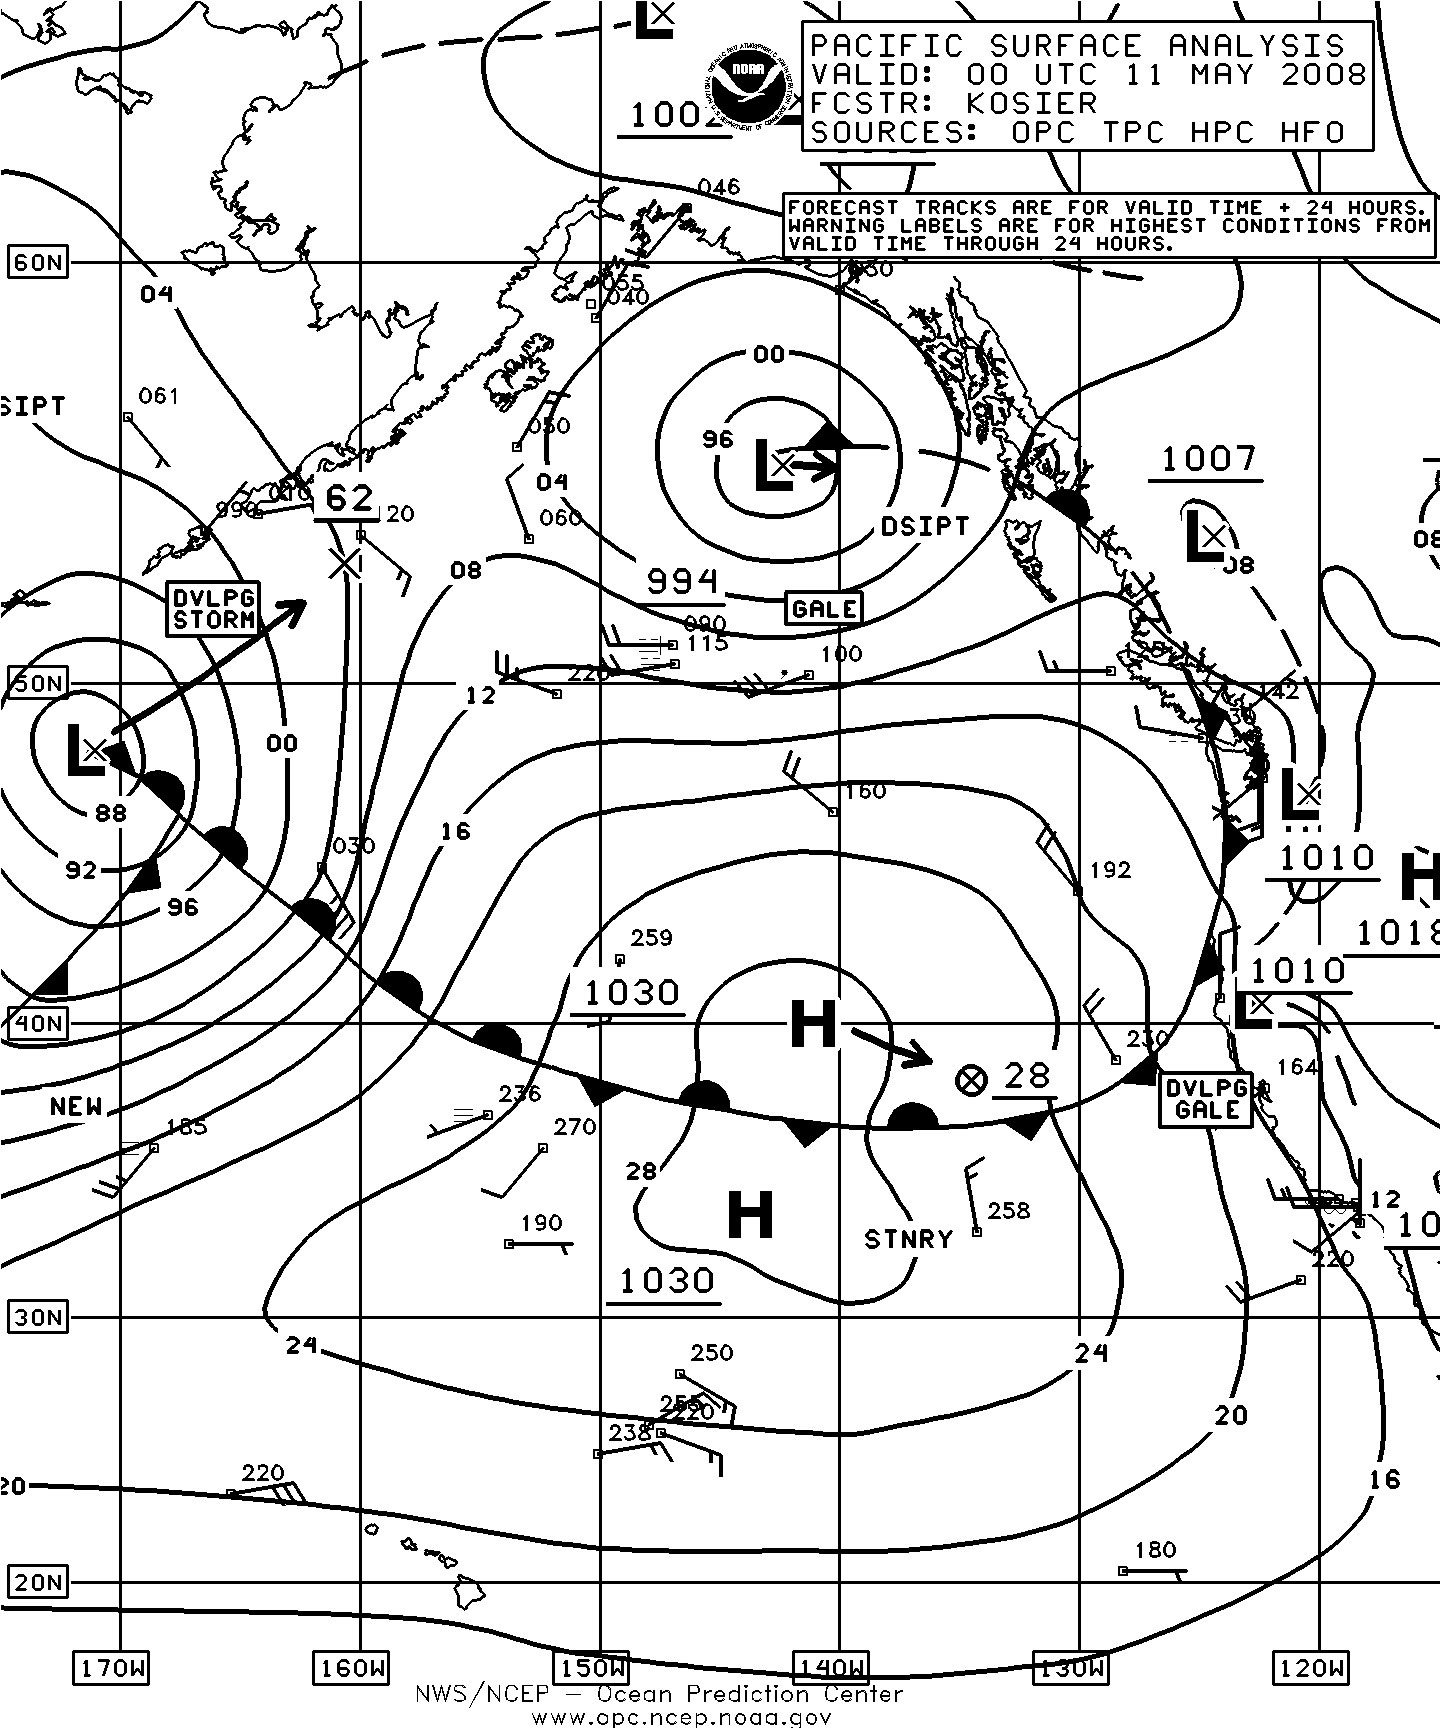

Figure 1. OPC North Pacific Surface Analysis charts (Part 1 - east) valid 0000 UTC May 11 and 12, 2008.
Tropical Storm Matmo: Tropical Storm Matmo formed from a weak non-tropical low 500 nmi south of Japan early on May 16 with maximum sustained winds of 40 kts and gusts to 50 kts but was short lived as a tropical cyclone, quickly becoming an extra-tropical gale later that day as it moved east. The cyclone then turned northeast on the 17th, becoming a 1000 hPa gale force low center near 34N 172E by 0600 UTC on the 18th. Matmos extra-tropical remains then continued on a northeastward track and merged with a front associated with an eastern Aleutians low on the 20th.
Tropical Storm Halong: Tropical Storm Halong moved northeast into OPCs oceanic map area ahead of an approaching cold front south of Japan. At 0000 UTC May 20 Halong was located near 25N 135E with sustained winds of 45 kts. The cyclone merged with the approaching front six hours later and became an extra-tropical gale. The Emirates Spring (DGOL)(29N 143E) reported southwest winds of 35 kts and 4.5 m seas (14 ft) at 1200 UTC May 20. The former Halong then moved northeast and then north as a frontal wave of low pressure, briefly developing storm force winds with the center at 41N 155E early on the 21st before weakening and dissipating near the southern Kamchatka Peninsula on May 23.
Typhoon Nakri: Tropical Storm Nakri moved into OPCs oceanic map area near 16N 137E on a northwestward track at 0600 UTC May 28 while rapidly intensifying, becoming a typhoon six hours later with maximum sustained winds of 65 kts with gusts to 80 kts. By 1200 UTC on the 29th Nakri was near 16N 136E with maximum sustained winds of 125 kts and gusts to 145 kts. Nakri then passed west of the area by the 30th and then recurved back northeast as a weakening typhoon as June began. Figure 8 shows Nakri re entering OPCs map area and becoming briefly the compact extra-tropical storm twelve hours later (second part of Figure 8). Figure 9 is a high resolution QuikSCAT image of extra-tropical Nakri still showing some tropical character such as having a compact circulation with strongest winds close to the center. While Nakri was a typhoon, the Northwest Seaeagle (ZCAS2) reported south winds of 50 kts and 8.0 m seas (27 ft) near 24N 135.5E at 0000 UTC June 2 . Unknown ship (32N 134E) reported northeast winds of 40 kts and 6.5 m seas (21 ft) nine hours later. At 0000 UTC June 3 Unknown ship (TBWUK39) (32N 139E) encountered northeast winds of 40 kts and 8.5 m seas (28 ft) while Unknown ship (S6BA) (34N 140E) reported east winds of 40 kts and 6.5 m seas (22 ft). The circulation of Nakri broadened as the cyclone headed northeast and its maximum winds shifted to the northeast side ahead of a front before the system weakened to a gale later on June 3. Nakris extra-tropical remains then accelerated northeast with winds dropping to below gale force as the cyclone passed 600 nmi south of the eastern Aleutians on the 7th. The system then redeveloped eastward as a gale near Vancouver Island on the 9th.
Tropical Storm Vongfong: Vongfong originated as Tropical Depression 12W near 28N 134E south of Japan at 1800 UTC August 14 with maximum sustained winds of 30 kts with gusts to 40 kts. The cyclone headed northeast and intensified to a tropical storm six hours later and by 0600 UTC on the 15th Vongfong was near 30N 136E at maximum intensity as a tropical storm with maximum sustained winds of 50 kts with gusts to 60 kts. The cyclone then began a weakening trend and Figure 10 shows Vongfong as a minimal tropical storm undergoing extra-tropical transition as it merged with a front.
Figure 11 is a scatterometer image of winds around former Vongfang which briefly re-intensified into an extra-tropical storm. Winds to 60 kts appear on the southeast side of a compact circulation similar to that of extra-tropical Nakri. The cyclone moved northeast and developed a lowest central pressure of 990 hPa near 44N 164E at 1800 UTC on the 17th before weakening to a gale twelve hours later. The remains of Vongfong then tracked east-northeast across the North Pacific before turning north into the Gulf of Alaska August 22, stalling and then dissipating near Southeast Alaska on the 25th.
Tropical Storm Nuri: Tropical Storm 13W moved northwest into the waters well south of Japan near 16N by 1800 UTC August 17 (Figure 10, second part) with maximum sustained winds of 40 kts with gusts to 50 kts. It was named Nuri six hours later when winds increased to 55 kts sustained with gusts to 70 kts. The cyclone then headed west of the waters, where it strengthened to a typhoon on the 18th.
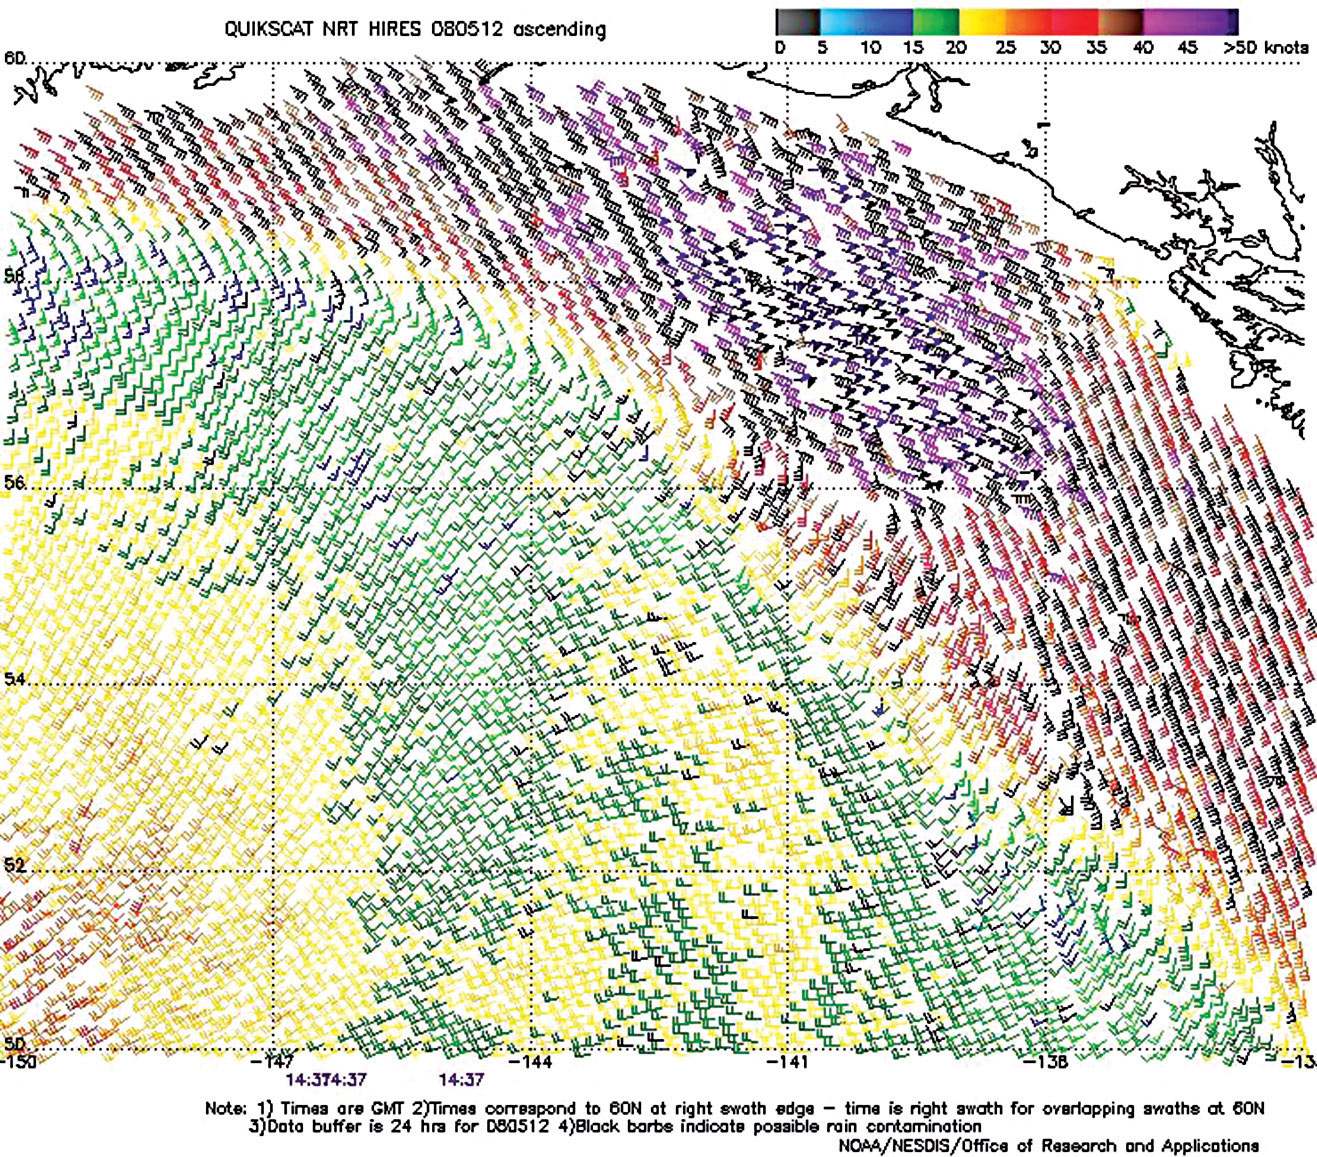
Figure 2. High-resolution QuikSCAT scatterometer image of satellite-sensed winds around the eastern side of the storm shown in the second part of Figure 1. The resolution is 12.5 km, versus 25 km in the coarser-resolution version of QuikSCAT imagery. The valid time of the pass is 1437 UTC May 12, 2008, or about fourteen and one-half hours later than the valid time of the second part of Figure 1. Image is courtesy of NOAA/NESDIS/ Office of Research and Applications.
Other Significant Events
Northeast Pacific Storm, May 1: The weather was quite active in May as a series of strong low pressure systems moved into the northeast Pacific and Gulf of Alaska. The first of these was an intensifying low moving northeast into the Gulf of Alaska May 1 and developing a lowest central pressure of 980 hPa near 56N 146W at 0000 UTC May 2. The cyclone briefly developed storm force winds at this time similar to those shown in Figure 2 for another low in the same area on May 12. The system then weakened while drifting northwest the following night and on the 2nd before dissipating on the 3rd.
Northeast Pacific Storm, May 8-9: A complex of low pressure centers moved east over the central North Pacific on May 7 with the eastern center intensifying and moving northeast on the 8th. It developed a lowest central pressure of 987 hPa near 54N 145W at 1800 UTC on the 9th and developed a brief period of storm force east to southeast winds ahead of its frontal system. The Ever Gaining (HPCL) (54N 143W) reported southeast winds of 65 kts and 7.0 m seas (23 ft) at 1800 UTC on the 9th. A check against remotely sensed scatterometer winds and other ships near that time indicated the reported winds may be 5 to 10 kts high. Unknown ship (NL9H) (52N 137W) reported southeast winds of 50 kts and 5.0 m seas (17 ft) at that time. The cyclone stalled and weakened in the central Gulf of Alaska later that day and on the 10th before dissipating on the 11th.
North Pacific Storm, May 11-12: The first and weaker of two unseasonably intense cyclones which affected the eastern and northeastern portions of the Pacific is shown in Figure 1. Two frontal waves of low pressure out near the dateline early on May 10 merged to form a 972 hPa low near 52N 165W twenty four hours later, with the central pressure dropping 26 hPa during this period. Storm force winds developed shortly thereafter with the second part of Figure 1 showing the cyclone at maximum intensity. The storm then stalled over the Alaska Peninsula late on the 11th while the front moved northeast toward the coast. The high resolution QuikSCAT image in Figure 2 shows the frontal band of gale to storm force winds approaching the Alaskan coast. At 1200 UTC on the 12th the ship Polar Resolution (WDJK) (59N 146W) reported east winds of 50 kts. The buoy 46061 (60.2N 146.8W) reported east winds of 40 kts and 5.0 m seas (16 ft) at 1800 UTC on the 12th and highest seas 6.5 m (22 ft) two hours later. The cyclone subsequently drifted west on the 12th and weakened in the southern Bering Sea.
North Pacific Storm of May 12-14: The development of the deepest low of the period in both oceans is depicted in Figure 3. The rapidly deepening frontal wave of low pressure in the first part of Figure 3 had its central pressure fall 32 hPa in the following twenty four hours, leading to the intense winter-like hurricane force storm with a lowest central pressure of 956 hPa shown in the second part of Figure 3. Figure 4 is an infrared satellite picture of the storm taken seven and one half hours after the time of maximum intensity. It reveals broad cold topped cloud bands wrapping around a well defined center. Elongation of the cloud system may be a sign of the beginning of a weakening trend. Figure 5 shows hurricane force winds to 70 kts south of a relatively compact storm circulation, observed about eight hours prior to the time of maximum intensity in high resolution QuikSCAT data. Table 2 lists selected ship and buoy data taken during the storm. A weakening trend followed early on the 14th as the system moved into the Gulf of Alaska, with the center moving inland over Alaska the next day.
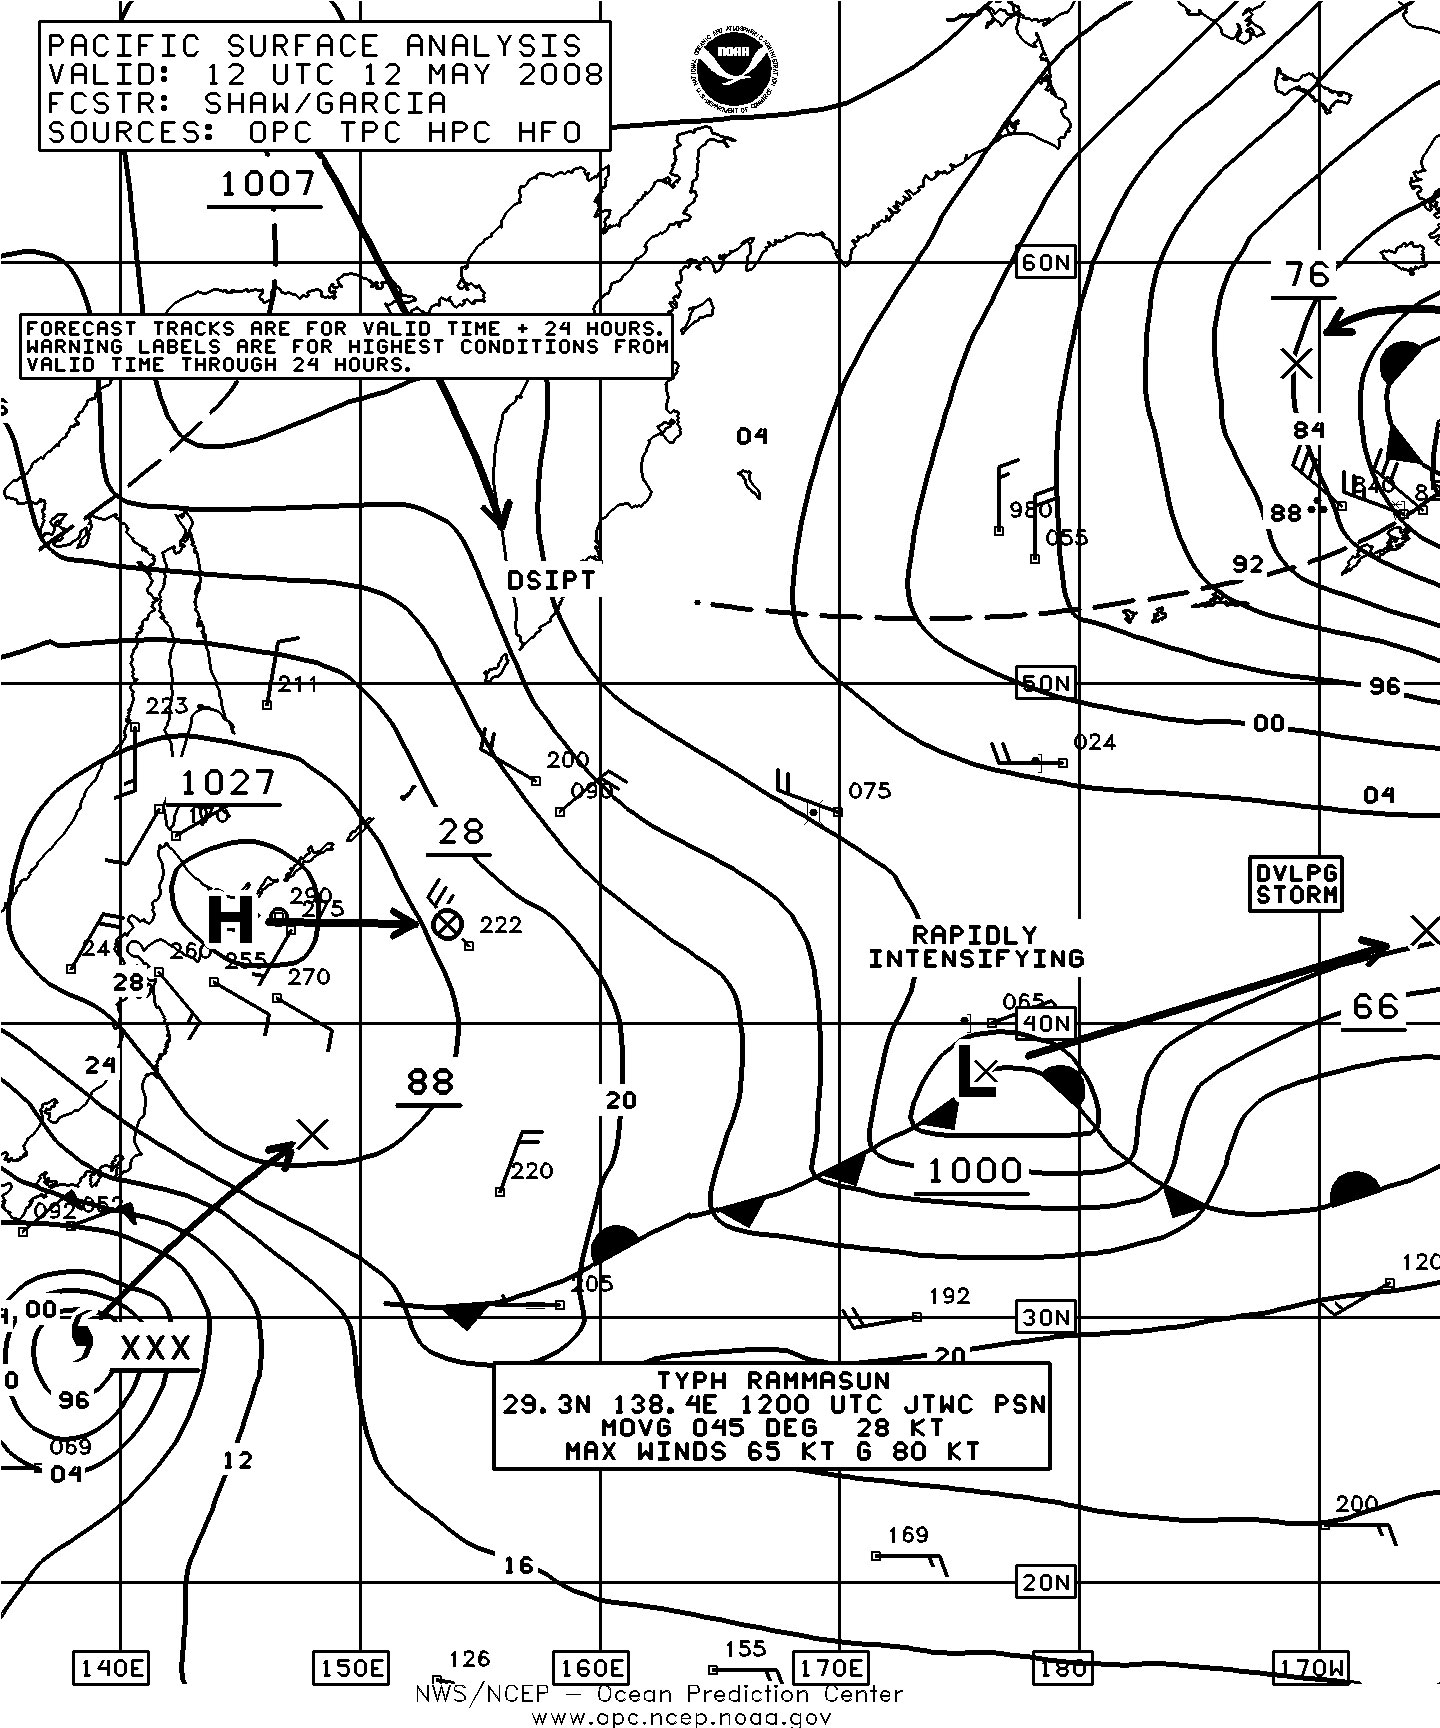
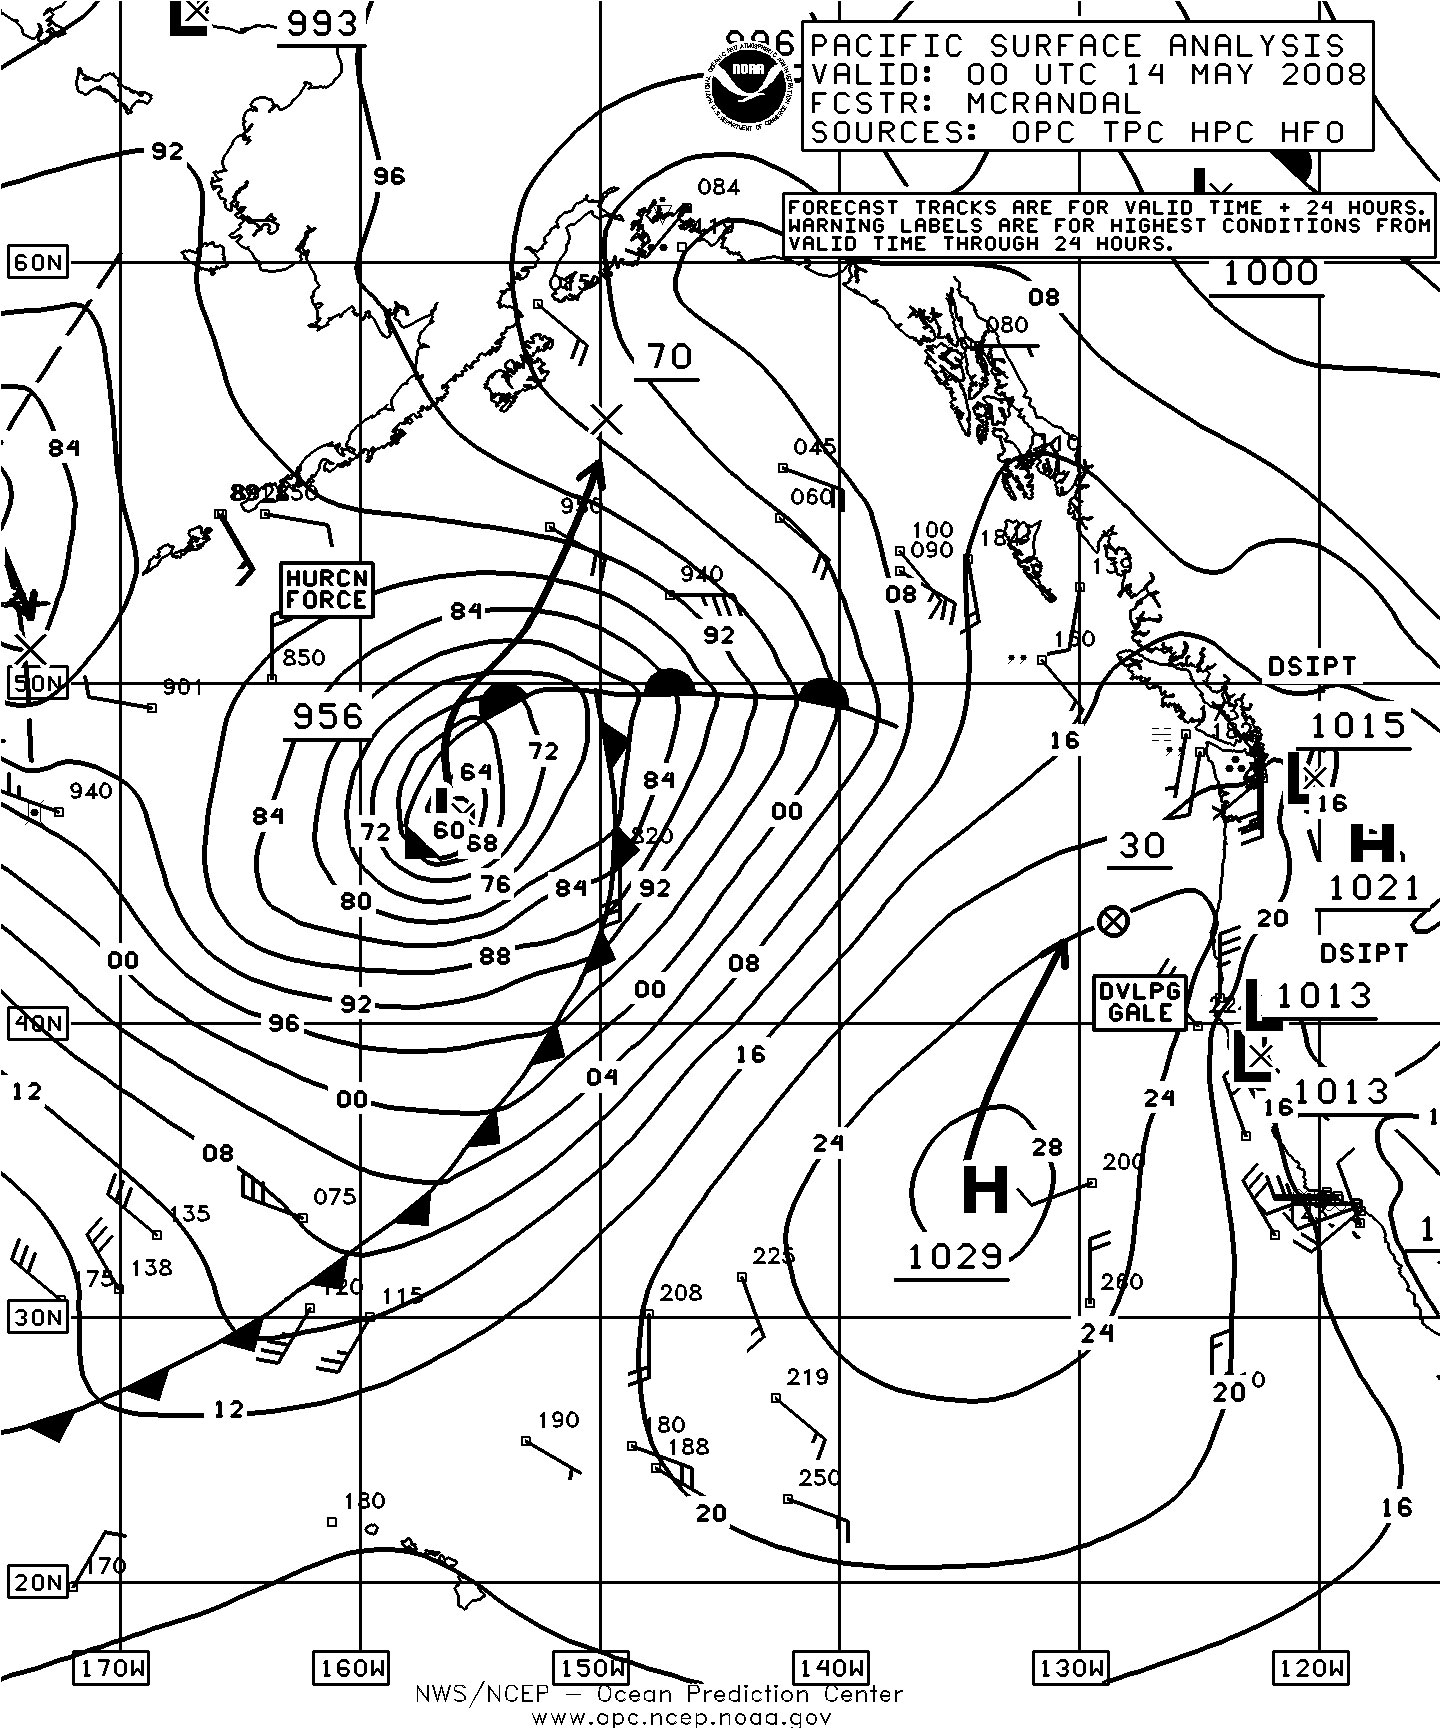
Figure 3. OPC North Pacific Surface Analysis charts valid 1200 UTC May 12 (Part 2 west) and 0000 UTC May 14, 2008 (Part 1 east).
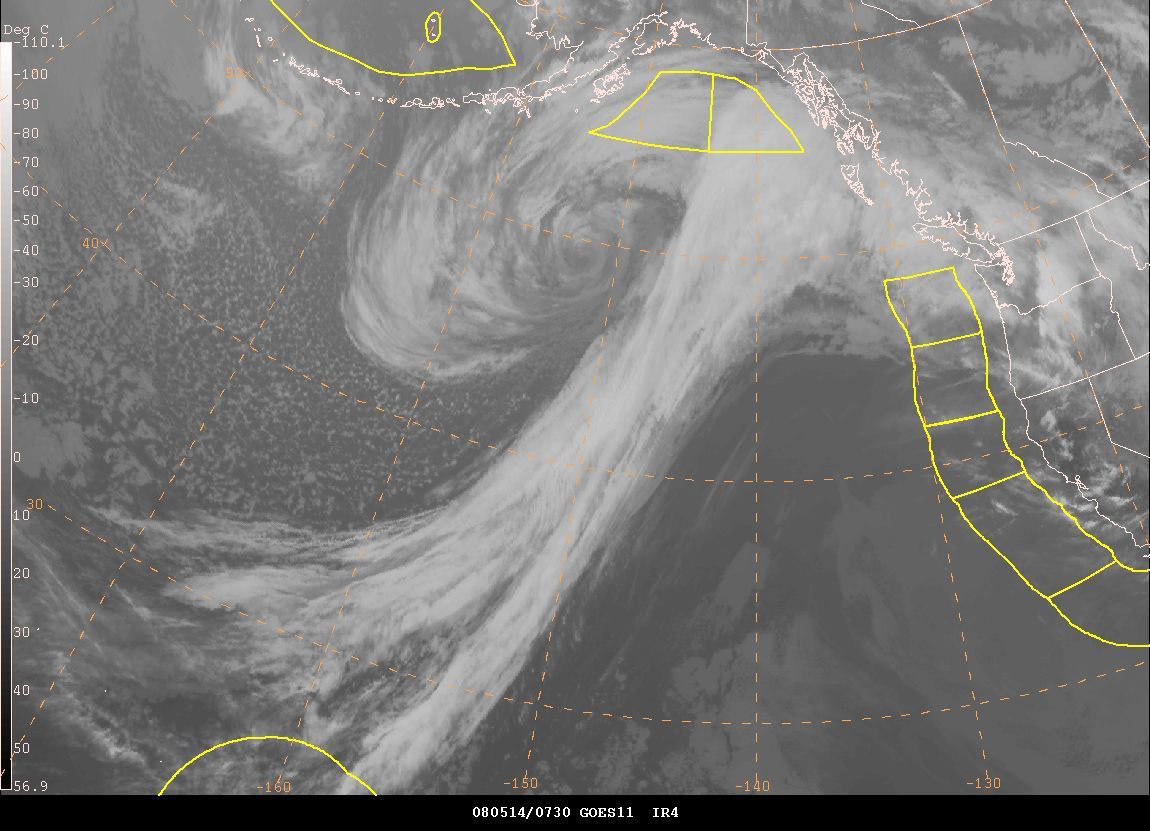
Figure 4. GOES11 infrared satellite image of the storm in Figure 3 near maximum intensity, valid at 0730 UTC May 14, 2008 or seven and one-half hours after the valid time of the second part of Figure 3. Satellite senses temperature on a gray scale ranging from warm (black) to cold (white) in this type of imagery.

Figure 5. High-resolution QuikSCAT scatterometer image of satellite-sensed winds around the storm shown in the second part of Figure 3. The valid time of the pass is 1549 UTC May 13, 2008, or about eight hours prior to the valid time of the second part of Figure 3. The center of the storm is near 44N 161E in the lower left part of the image with the stronger winds found to the north and south. Image is courtesy of NOAA/NESDIS/ Office of Research and Applications.
| Observation | Position | Date/Time (UTC) | Wind | Seas (m/ft) |
|---|---|---|---|---|
| Midnight Sun | 58N 148W | 14/1200 | E 45 | 3.0/10 |
| Pt. Oliktok | 57.7N 154.8W | 14/1600 | NE 50 | 3.5/12 |
| Hanjin Praha | 54N 148W | 14/0600 | E 35 | 6.0/19 |
| Buoy 46633 | 47.05N 145.5W | 14/0000 | SW 41 | |
| Buoy 21907 | 48.7N 153W | 14/0620 | Pressure 95 | 4.8 |
| Buoy 46085 | 55.9N 142.6W | 14/1100 15/0700 |
E 33 | 4.5/14 Maximum 9.0/30 |
| Buoy 46001 | 56.3N 148W | 14/1150 15/0400 |
E 39 | 5.0/17 Maximum 7.5/24 |
| Buoy 46077 | 57.9N 154.3W | 14/2100 | NE 40 | 4.5/15 |
Western North Pacific Storm, May 19-21: A strong low pressure system moved across Japan with its trailing front late on May 19 and early on the 20th, at the same time that Tropical Storm Halong passed south of Japan and merged with the front. At 1200 UTC on the 20th the system briefly developed storm force winds on the east side with the center developing a central pressure of 990 hPa over northern Japan, and 988 hPa six hours later. Unknown ship (A8OZ3) (43N 146E) reported southeast winds of 60 kts at 1200 UTC on the 20th. Four hours earlier, Unknown ship (C6WL5) (39N 144E) encountered south winds of 50 kts. At 0600 UTC on the 20th a ship using the SHIP callsign (36N 144E) reported southeast winds of 45 kts and 8.0 m seas (27 ft). The system weakened as it lifted north of Japan into the Sea of Okhotsk, where it dissipated on the 23rd.
North Pacific Storm of May 21-23: Figure 6 depicts the development of this eastern Pacific system over a twenty four hour period. It originated as a frontal wave of low pressure near 32N 171W at 0000 UTC on the 21st. The central pressure dropped 24 hPa in the twenty four hour period ending at 0000 UTC May 23. Storm force winds were observed with this system as revealed in scatterometer data from the morning of May 23 (Figure 7) with a swath of winds as high as 55 kts on the southeast side of the storm center. The Shanghai Express (DGSE) near 48N 161W reported southwest winds of 45 kts and 7.5 m seas (25 ft) at 1200 UTC on the 23rd. The cyclone subsequently weakened to a gale as it lifted north into the Bering Sea later that day, and then dissipated near the Bering Strait by the 26th.
Storm off California Coast, May 21-22: Figure 6 shows a pattern in the northeast Pacific that can lead to northerly gales or even storm force winds off the California coast, with a strong eastern North Pacific high pressure area interacting with a heat low or low pressure trough often found over California in the warm season. Some selected ship and buoy observations taken during this event are listed in Table 3.
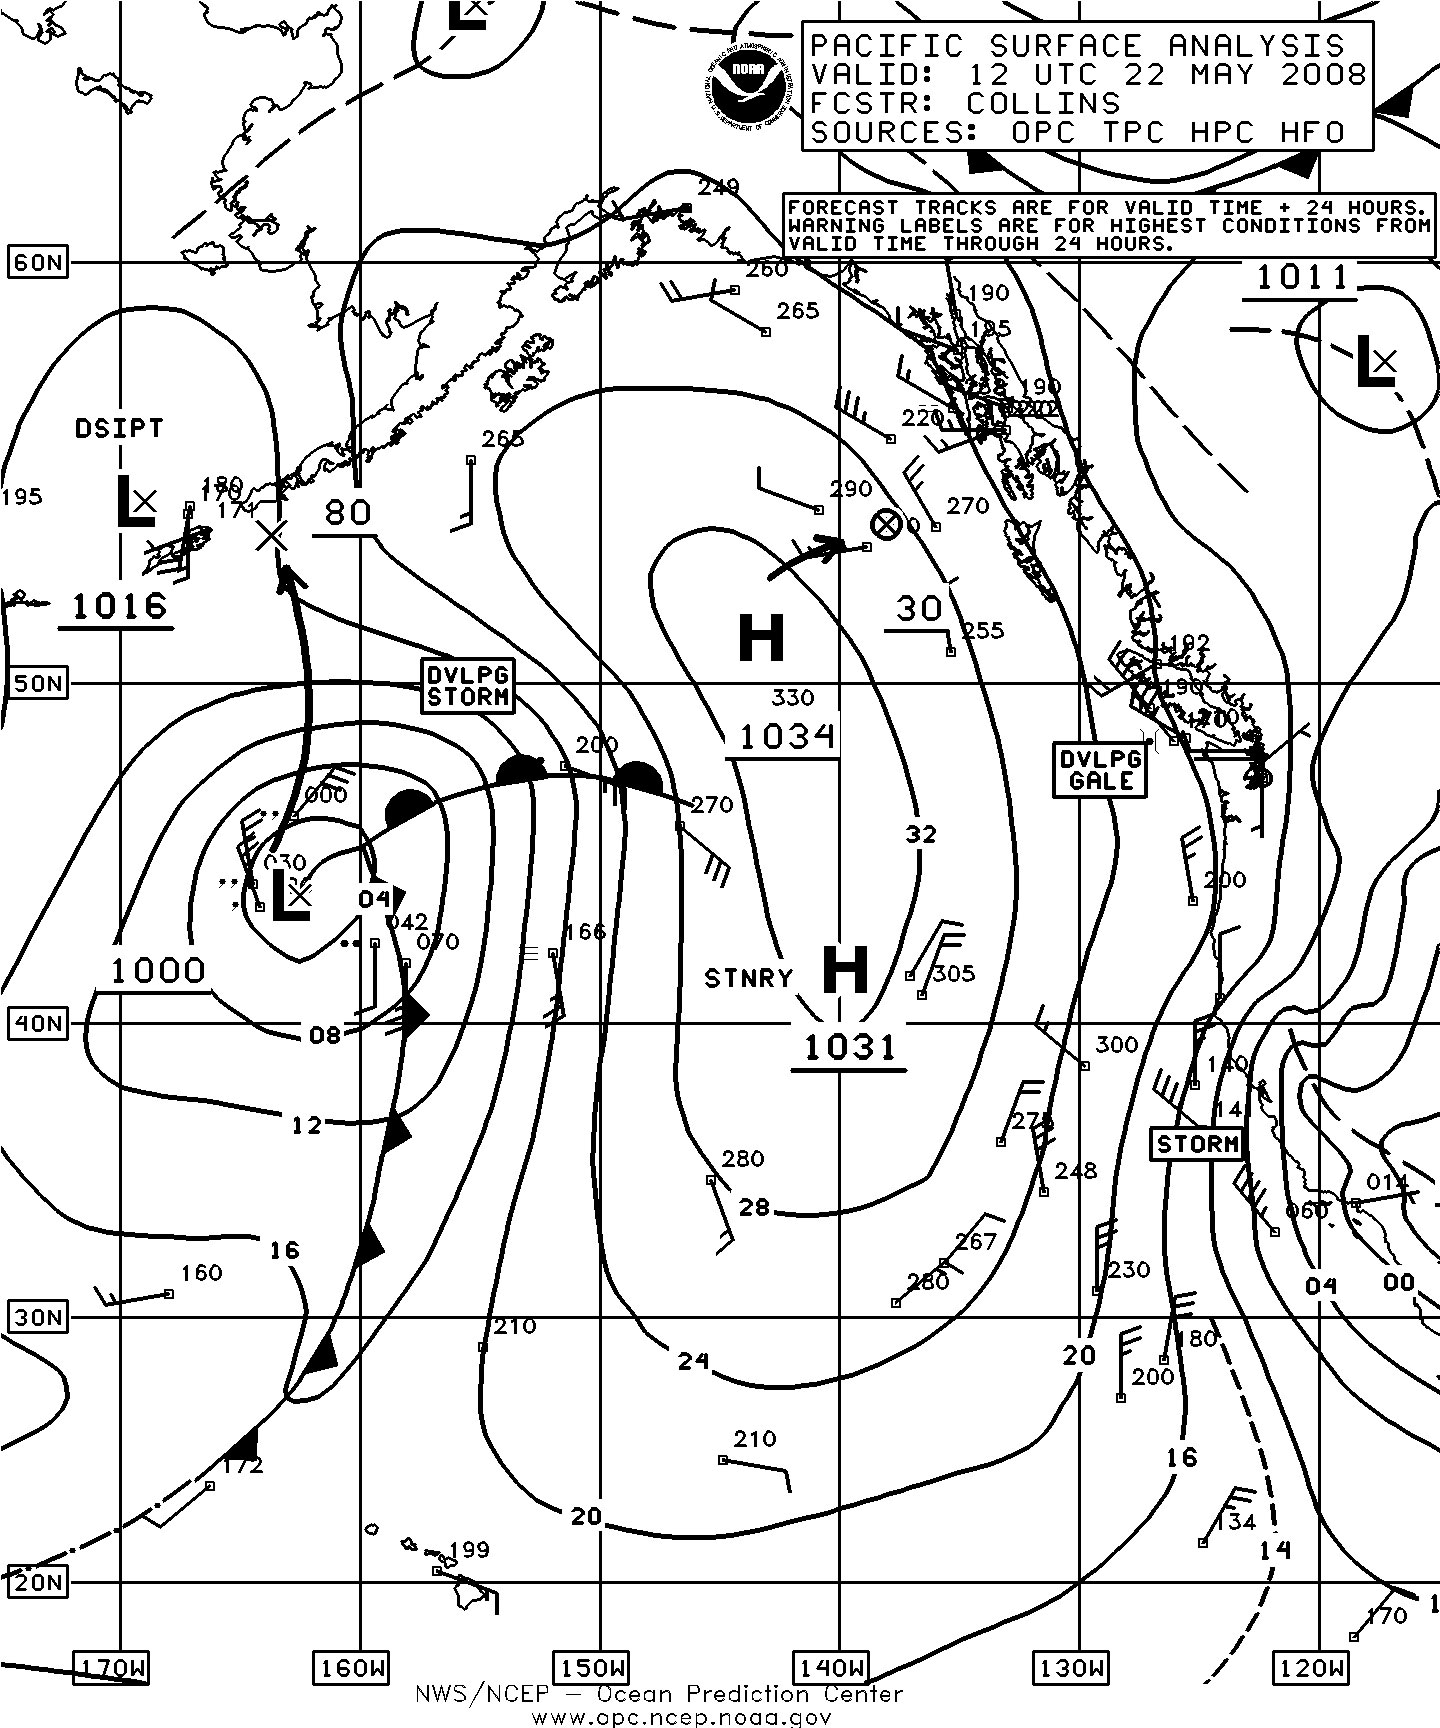
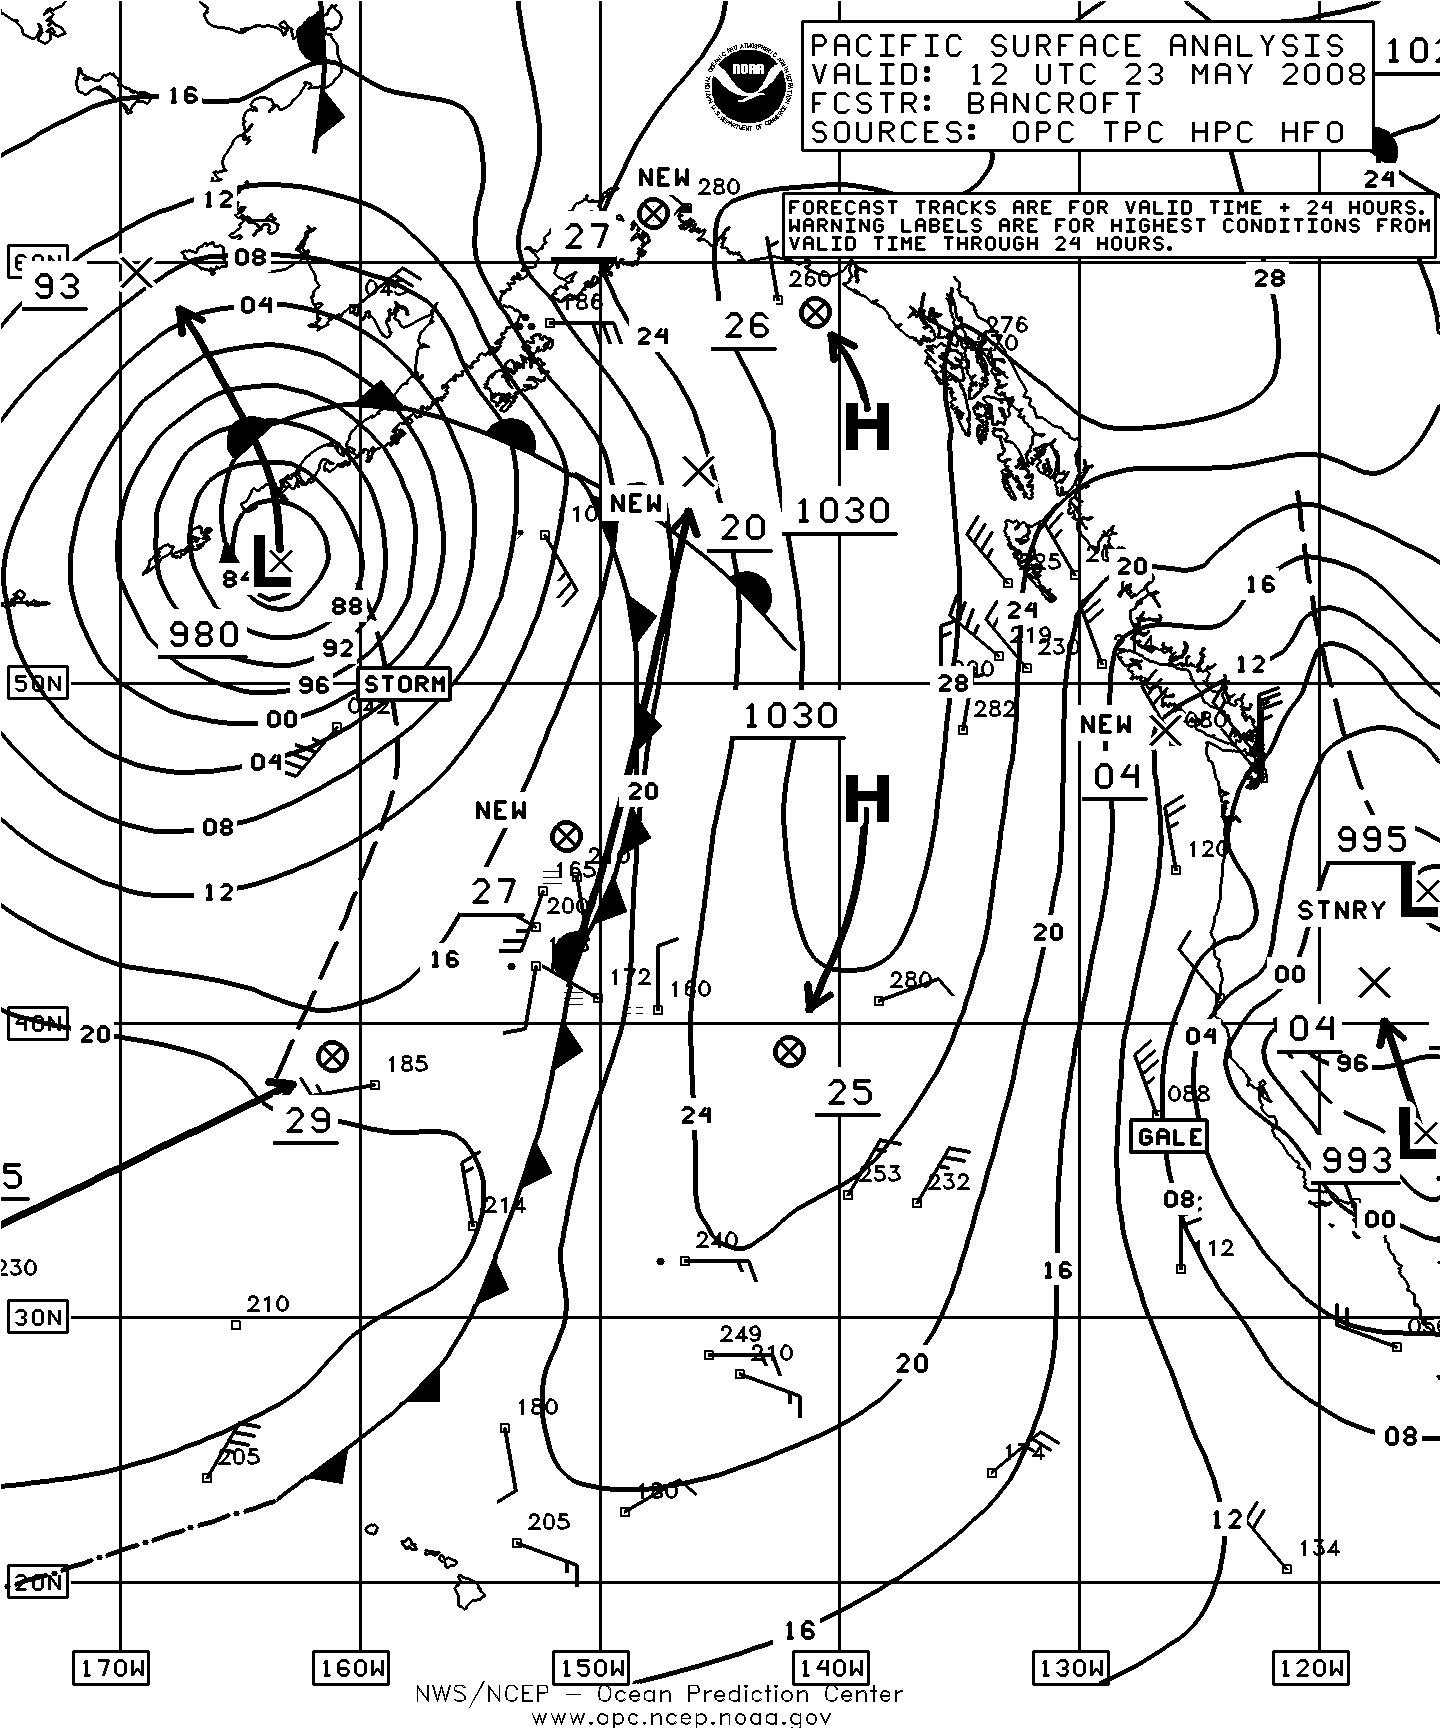
Figure 6. OPC North Pacific Surface Analysis charts (Part 1) valid 1200 UTC May 22 and 23, 2008.
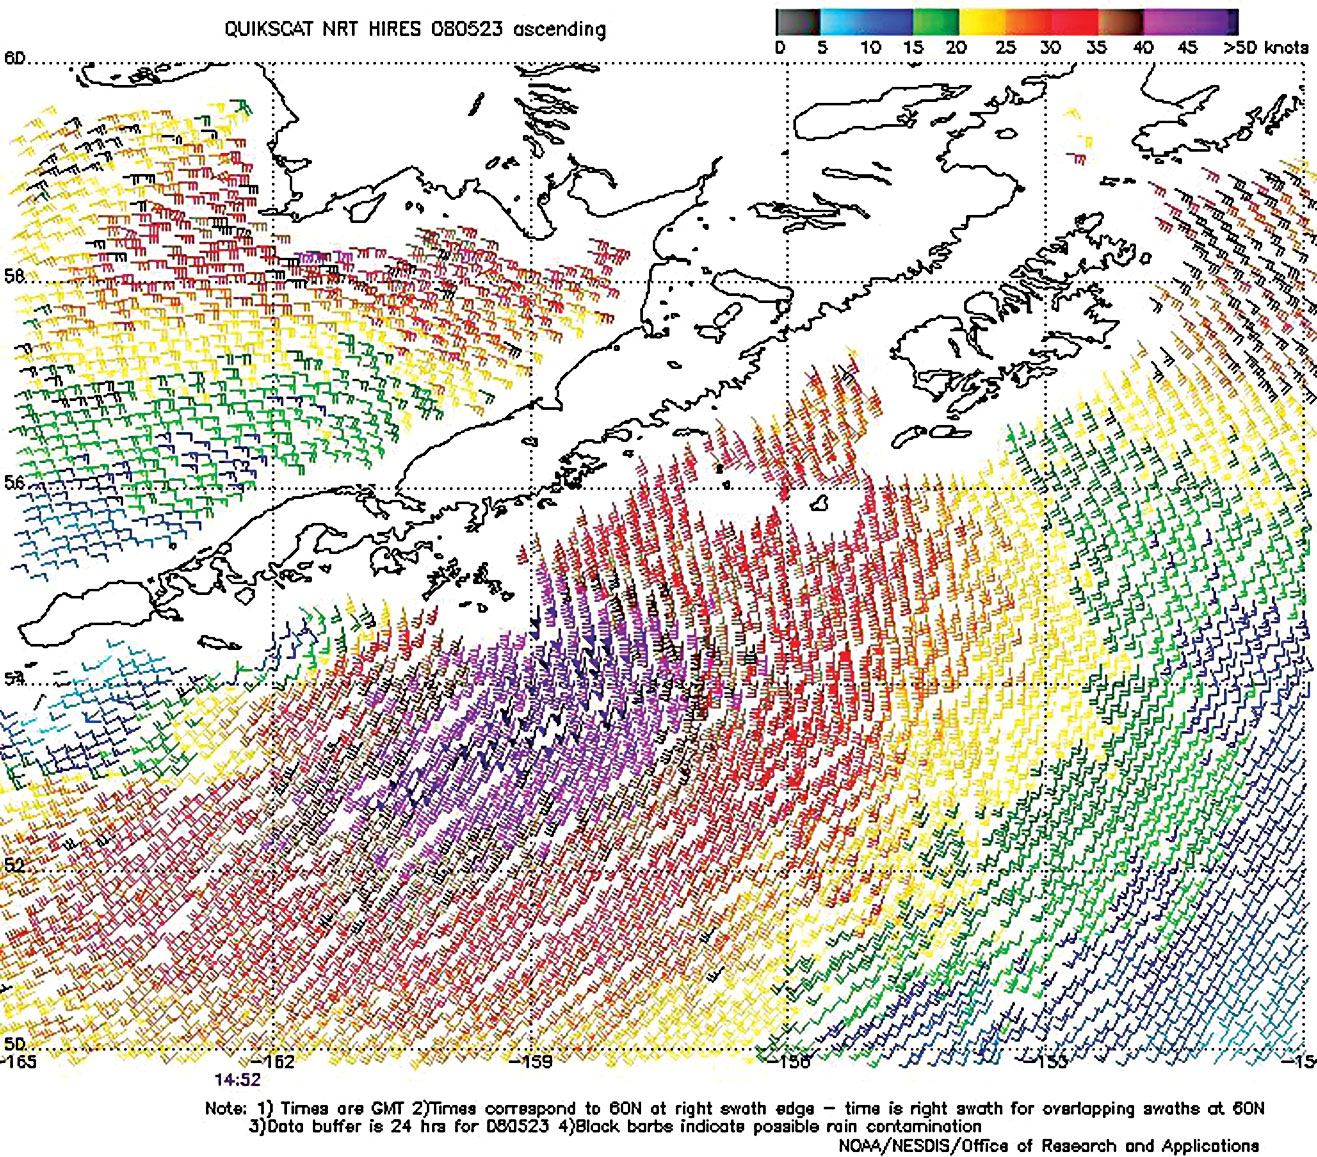
Figure 7. High-resolution QuikSCAT scatterometer image of satellite-sensed winds around mainly the eastern side of the storm shown in the second part of Figure 6. The valid time of the pass is 1452 UTC May 23, 2008, or about three hours later than the valid time of the second part of Figure 6. The center of the storm is over the eastern Aleutian Islands near 55N 164W near the left edge of the image. Image is courtesy of NOAA/NESDIS/ Office of Research and Applications.

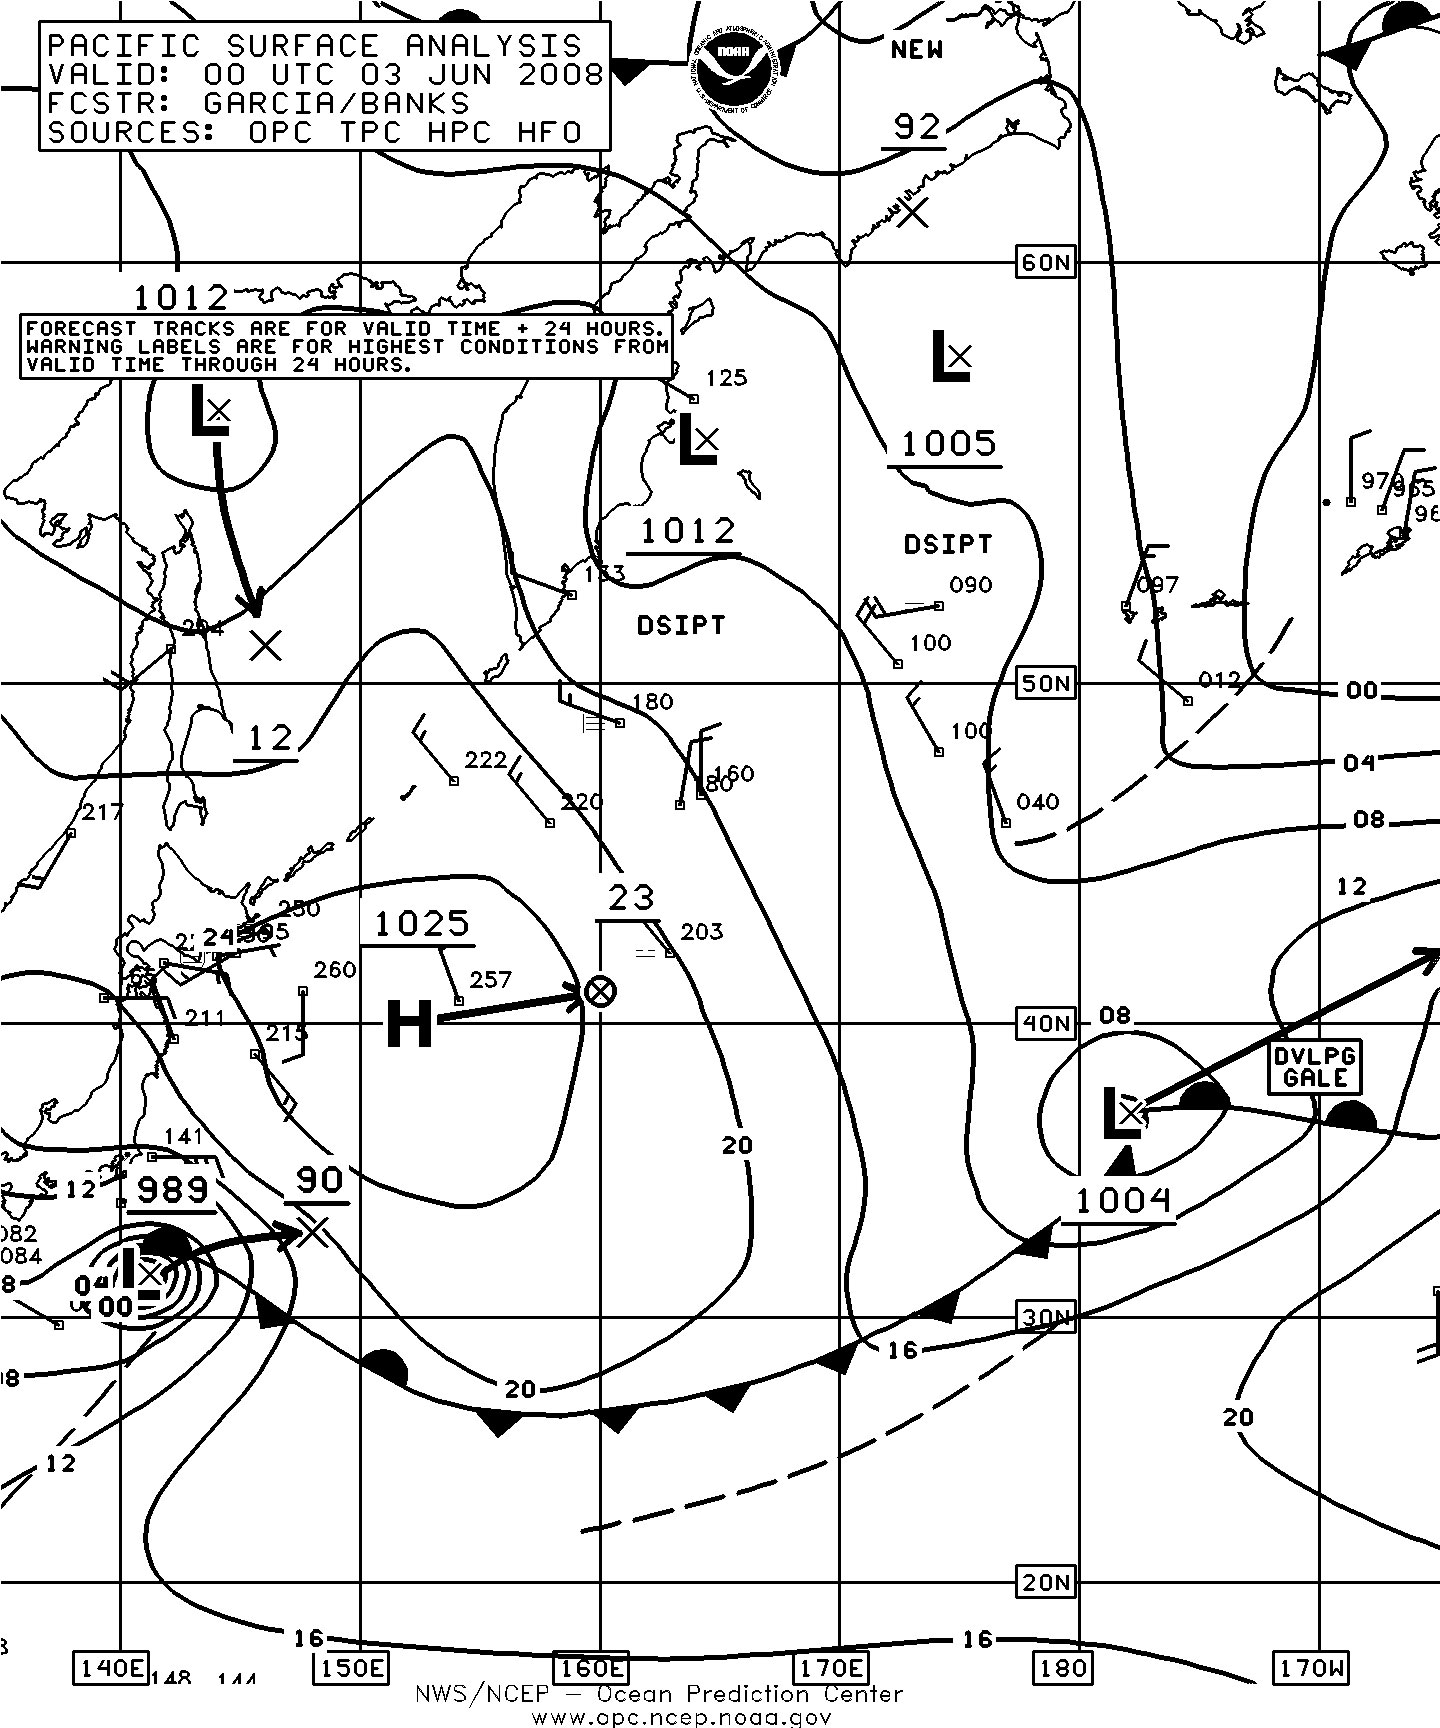
Figure 8. OPC North Pacific Surface Analysis charts (Part 2 - west) valid 1200 UTC June 2 and 0000 UTC June 3, 2008.
| Observation | Position | Date/Time (UTC) | Wind | Seas (m/ft) |
|---|---|---|---|---|
| S6BA | 34N 123W 34N 125W |
21/1200 21/1800 |
NW 50 NW 45 |
6.5/21 |
| Hanjin Boston | 36N 124W 35.5N 123W |
22/0200 22/0600 |
NW 50 NW 40 |
8.5/28 |
| Matsonia | 32N 124W 33N 122W |
22/0600 22/1200 |
NW 35 NW 45 | 7.5/25 |
| SeaLand Pacific | 36N 125W | 22/1200 | NW 35 | 7.5/25 |
| Buoy 46028 | 35.7N 121.9W | 22/1000 22/1200 |
NW 33 G43 | 7.0/23 |
| Buoy 46012 | 37.4N 122.9W | 22/0200 22/0800 |
NW 37 G45 | 5.0/16 Maximum 6.0/20 |
| Buoy 46013 | 38.2N 123.3W | 22/0100 22/0600 |
NW 37 G47 | 5.0/16 |
| Buoy 46027 | 41.9N 124.4W | 23/0400 | N 33 G41 | 3.0/10 |
| Buoy 46063 | 34.3N 120.7W | 21/1500 22/0900 | NW 31 G39 | 4.5/15 Maximum 6.5/21 |
| Buoy 46023 | 34.7N 121.0W | 22/0500 | NW 35 G45 | 6.0/20 |
North Pacific Storm of August 11-12: After a quiet June and July the pattern over the North Pacific became more active entering late summer, with a series of cyclones beginning in the second week of August tracking east to the south of the Aleutians and developing storm force winds before turning north into the Gulf of Alaska. The first of these originated 600 nmi south of the Kurile Islands early on the 9th and moved to just south of the western Aleutians as a gale force low late on August 10 before turning east and intensifying into a storm 200 nmi south of the eastern Aleutians by 0000 UTC on the 12th. The cyclone developed a lowest central pressure of 978 hPa near 49N 158W at 1200 UTC on the 12th with the pressure dropping 20 hPa over the preceding twenty four hours. The Busan Express (DCPX2) (50N 168W) reported northwest winds of 45 kts and 6.5 m seas (21 ft) at 0000 UTC on the 12th. A high resolution QuikSCAT pass from about five hours later revealed west to northwest winds to 50 kts from 48N to 49N between 162W and 165W. The cyclone then turned north toward the Gulf of Alaska late on August 12 and its winds weakened to gale force. Dissipation followed late on the 14th, in the northern Gulf of Alaska.
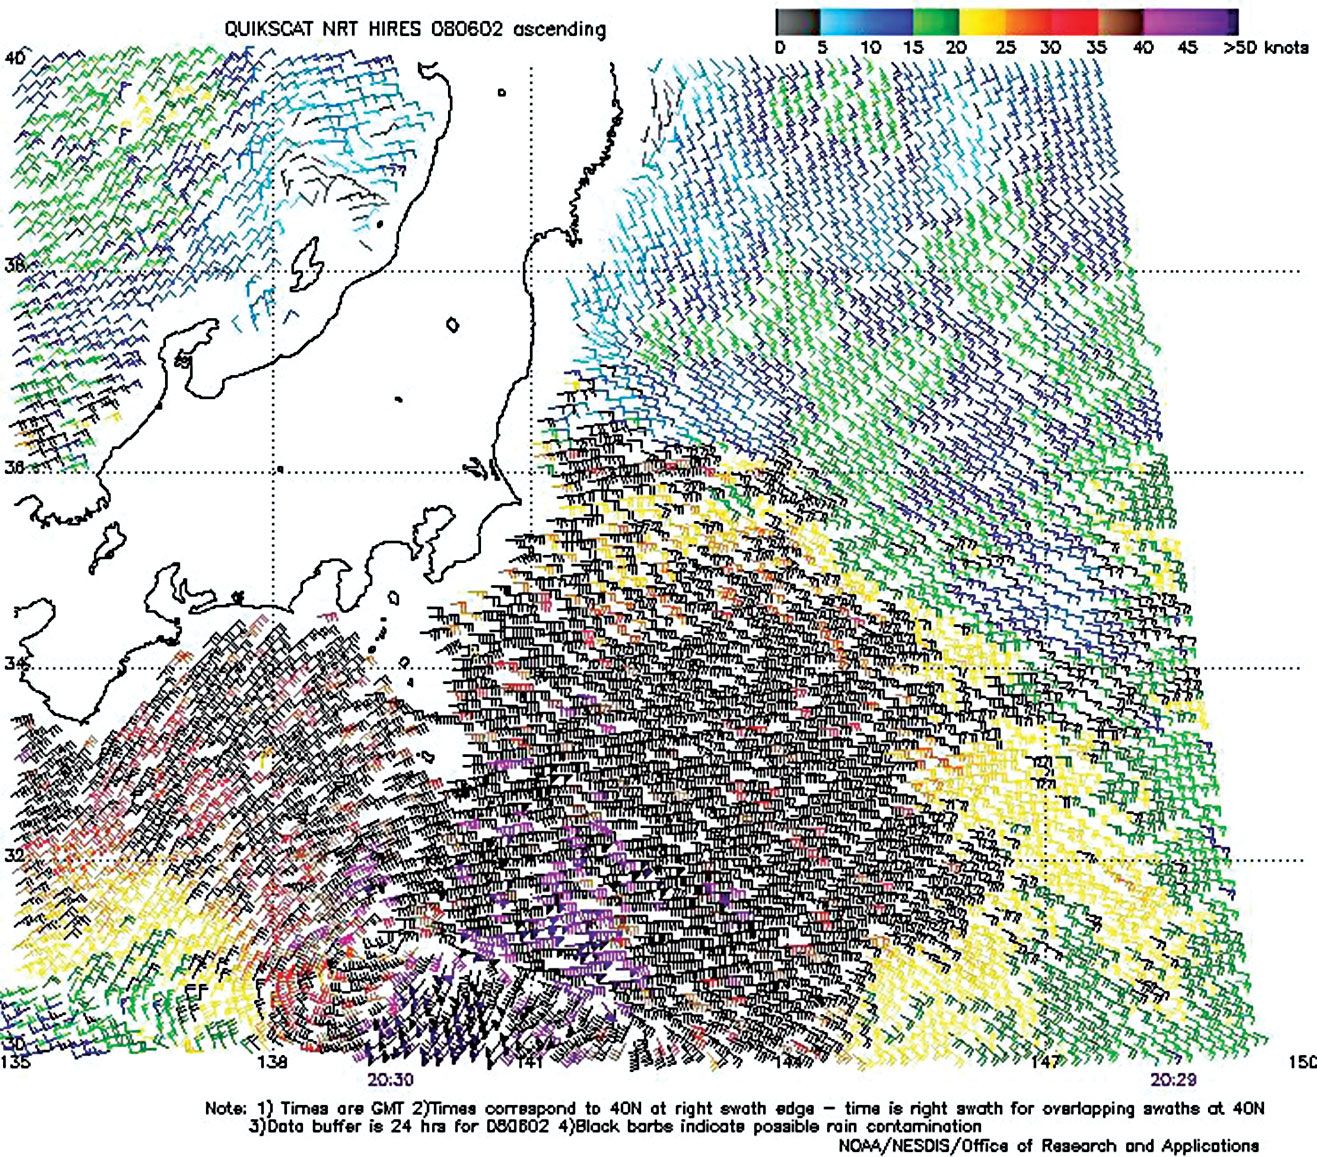
Figure 9. High-resolution QuikSCAT scatterometer image of satellite-sensed winds around Typhoon Nakri as it was undergoing transition to an extratropical storm, depicted in the second part of Figure 8. The valid time of the pass is 2030 UTC June 2, 2008, or about three and one-half hours prior to the valid time of the second part of Figure 8. The storm center appears near 31N 140E in the lower left side of the image. Image is courtesy of NOAA/NESDIS/ Office of Research and Applications.
Northeast Pacific Storm, August 17-18: This cyclone originated as a secondary development near the western Aleutians associated with a stalled primary low center near the Kamchatka Peninsula on August 16 (Figure 10). This cyclone tracked east and deepened rapidly while passing south of the Alaska Peninsula on the 17th and turned north into the Gulf of Alaska early on the 18th. The system developed storm force winds by 0000 UTC August 19 when the cyclone center passed near 55N 151W with the central pressure down to 976 hPa. The Signet Courageous (WDB7918) (57N 151W) reported northeast winds of 40 kts near 57N 151W at 0200 UTC on the 19th, while another vessel, Sun Princess (ZCBU6), encountered east winds of 40 kts and 5.5 m seas (18 ft) near 58N 147W one hour later. A high resolution scatterometer pass from 1535 UTC August 18 revealed scattered 50 kts wind barbs around the west and north sides of the cyclone with an isolated 55 kts. The maximum intensity of 974 hPa occurred at 0600 UTC on the 19th. The cyclone subsequently turned east and then southeast and weakened to a gale late on the 19th, before dissipating near Vancouver Island late on the 20th.


Figure 10. OPC North Pacific Surface Analysis charts (Part 2) valid 1800 UTC August 16 and 1200 UTC August 17, 2008.

Figure 11. High-resolution QuikSCAT scatterometer image of satellite-sensed winds around the extratropical storm, former Tropical Storm Vongfong, shown in the second part of Figure 10. The valid time of the pass is 0758 UTC August 17, 2008, or about four hours prior to the valid time of the second part of Figure 10. The well-defined center of the cyclone appears near 39N 155E near the top edge of the image. Image is courtesy of NOAA/NESDIS/ Office of Research and Applications.
Northeast Pacific Storm, August 25-26: After initial development 300 nmi southeast of the Kamchatka Peninsula early on the 23rd, the system passed near the central Aleutians on the 24th as a gale force low before turning southeast to a position near 48N 170W early on the 25th as a 994 hPa gale force low. The system redeveloped northeast to a new center which became dominant and intensified to 986 hPa near 52N 148W early on the 26th, when it briefly developed storm force winds of 50 kts in a small area south of the center (from high resolution QuikSCAT data). The SeaLand Tacoma (KGTY) reported south winds of 35 kts and 6.5 m seas (21 ft) near 50N 130W at 1800 UTC on the 26th, among other ships in the area reporting winds to 35 kts. The cyclone subsequently weakened while moving northeast and dissipated over Southeast Alaska on the 27th.
Northeast Pacific Storm, August 30-31: The development of the strongest of the cyclones to occur in August is depicted in Figure 12. The central pressure dropped 30 hPa in the twenty four hour period ending at 1200 UTC on the 31st leading to the cyclones reaching a maximum intensity of 971 hPa as shown in the second part of Figure 12. The compact appearance of the cyclone in the second part of Figure 12 is reflected in the tight circulation of winds to storm force appearing in the high resolution scatterometer pass of Figure 13. Winds of 50 to as high as 60 kts appear around the center with some higher winds north of the center likely rain contaminated and unreliable. Selected ship and buoy observations are listed in Table 4. The cyclone subsequently weakened to a gale as it moved north to Kodiak Island late on the 31st.


Figure 12. OPC North Pacific Surface Analysis charts (Part 1) valid 1200 UTC August 30 and 31, 2008.
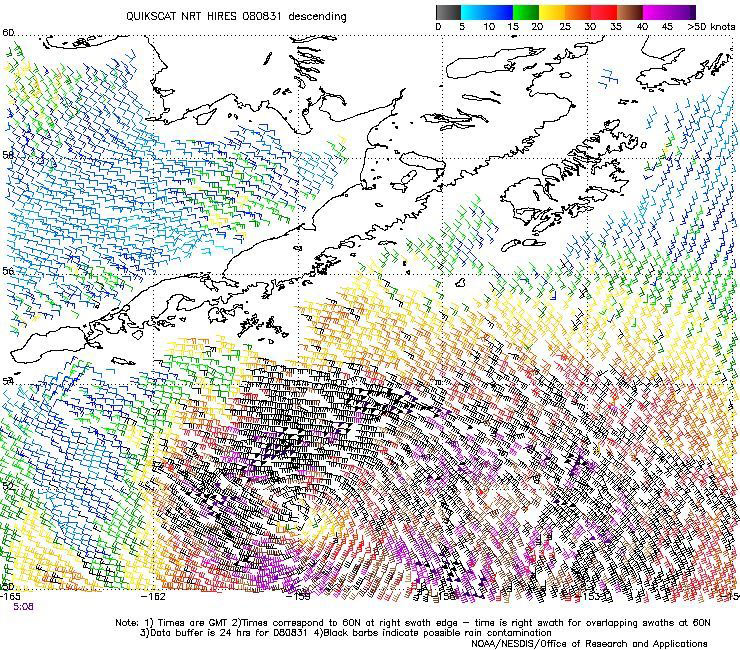
Figure 13. High-resolution QuikSCAT scatterometer image of satellite-sensed winds around the storm shown in the second part of Figure 12. The valid time of the pass is 0508 UTC August 31, 2008, or about seven hours prior to the valid time of the second part of Figure 12. The center of the storm appears near 52N 159W in the lower-left side of the image. Image is courtesy of NOAA/NESDIS/ Office of Research and Applications.
References
Archived tropical cyclone reports, http://www.nhc.noaa.gov/archive/2008/tws/MIATWSAT_jul.shtml?
E-mail communication, Thomas, Bridget, Climate Data and Analysis
Section(Environment Canada) through Robert Luke (NDBC), September 17, 2007.
QuikSCAT in the Ocean Prediction Center, http://www.opc.ncep.noaa.gov/quikscat/index.shtml
Saffir-Simpson Scale of Hurricane Intensity, http://www.nhc.noaa.gov/aboutsshs.shtml
Back to top