Marine Weather Review - North Pacific Area
May to August 2007
By George P. Bancroft, NOAA National Center for Environmental Prediction
Introduction
The period of May to August includes the least active part of the year. For the North Pacific, 2007 was no exception, with May and June accounting for seven of the nine low-pressure systems that developed storm-force winds during the period, with May having five. These cyclones included one in May with tropical origin. July and August produced only two storm-force lows, both former typhoons. The most active cyclones occurred in the western North Pacific as low-pressure systems tracked northeast from near Japan toward the Aleutians or sometimes the Kamchatka Peninsula before weakening or turning more east toward the Gulf of Alaska.
Five western Pacific tropical cyclones affected OPC’s ocean basin radiofacsimile chart area during the period, with Typhoon Yutu occurring in late May, Typhoon Man-Yi in mid-July, Typhoon Usagi in late July and early August, Tropical Storm Sepat in mid-August and Typhoon Fitow at the end of August. Of these, the first three redeveloped as extratropical storm-force cyclones.
Tropical Activity
Typhoon Yutu: Typhoon Yutu moved into OPC’s oceanic analysis area for radiofacsimile charts early on May 20, centered near 20N 135E at at 1200 UTC May 20 with maximum sustained winds of 125 kts with gusts to 150 kts. This would place Yutu at Category 4 on the Saffir-Simpson scale of hurricane intensity (Reference 2). Yutu headed northeast and began weakening, dropping in intensity to a minimal typhoon near 26N 145E at 0000 UTC May 22 with maximum sustained winds of 65 kts with gusts to 80 kts. Yutu then continued weakening and approached a frontal zone as depicted in Figure 1, with transition to a compact extratropical storm-force cyclone following (Figure 1). Figure 2 is a high-resolution QuikSCAT image of winds around Yutu, still a tropical cyclone, exhibiting the tropical characteristic of having its strongest winds concentrated close in to the center. The time of the image precedes that of the first part of Figure 1 by about three hours. Extratropical storm Yutu then moved northeast and gradually weakened, becoming a gale-force low near 37N 177W (1000-hPa central pressure) at 0000 UTC May 25. At this time, the ship A8HR7 (31N 180) reported a west wind of 45 kts and 5.5-m seas (18 ft). At 1800 UTC on the 24th Tellus (WRYG) reported near 35N 175W with south winds of 35 kts. The cyclone later re-intensified to a 988-hPa gale-force low as it passed well south of Kodiak Island early on May 28, and then turned north into the Gulf of Alaska on the 29th, where it weakened. Dissipation followed on the 30th.
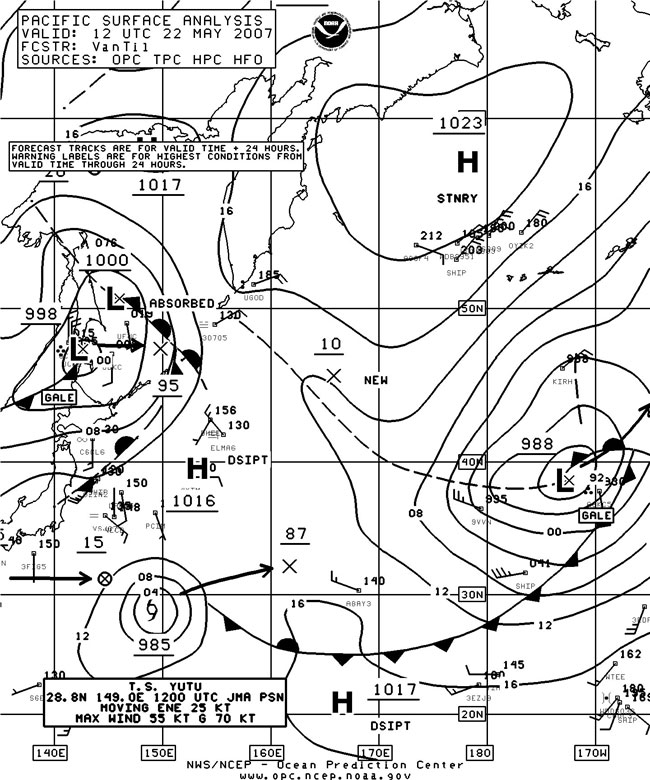
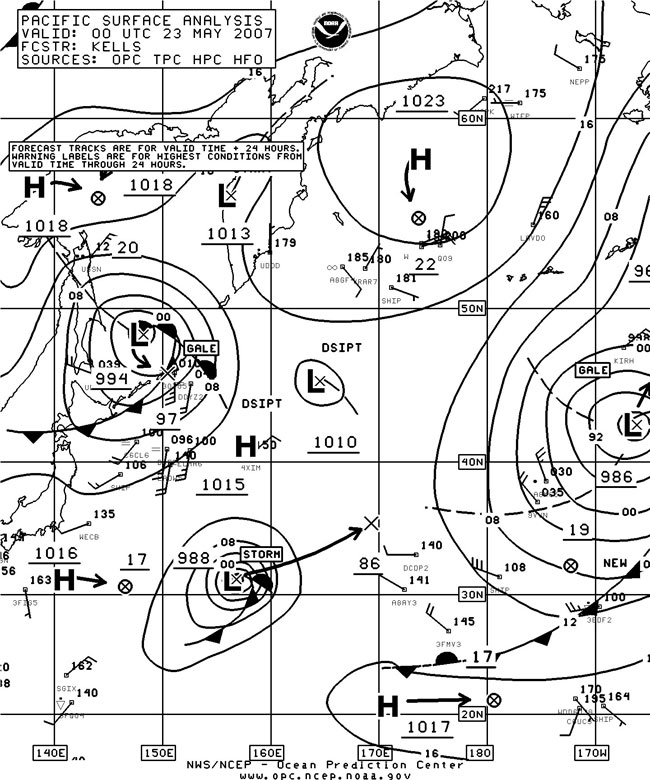
Figure 1. OPC North Pacific Surface Analysis charts (Part 2 - west) valid 1200 UTC May 22 and 0000 UTC May 23, 2007. The arrows are 24-hour forecast tracks of surface pressure centers to the 24-hour forecast positions with forecast pressures given with the last two whole digits in millibars.
(Click the image to enlarge)
Figure 2. High-resolution QuikScat scatterometer image of satellite-sensed winds around Typhoon Yutu shown in Figure 1. The resolution is 12.5 km, versus 25 km in the coarser-resolution version of QuikScat imagery. The valid time of the pass is 0855 UTC May 22, 2007, or about three hours prior to the valid time of the first part of Figure 1 when Yutu was classified as a tropical storm and nine hours before Yutu became extratropical. Image is courtesy of NOAA/NESDIS/ Office of Research and Applications.
(Click the image to enlarge)
Typhoon Man-Yi: Man-Yi moved northwest across the southwest corner of OPC’s oceanic radiofacsimile chart area as a strengthening typhoon, centered near 16N 134E at 0000 UTC on July 11, with maximum sustained winds of 80 kts with gusts to 100 kts. After becoming a super typhoon west of the area, Man-Yi made a turn northeastward and weakened, dropping below typhoon strength while passing near the south coast of Japan on July 14. Figure 3 depicts Man-Yi as a tropical storm approaching a stationary front at 0000 UTC on the 15th and becoming an extratropical storm twenty-four hours later. Figure 4 is an infrared MTS satellite image of Tropical Storm Man-Yi showing signs of extratropical transition, such as the circular dense cloud pattern of the tropical cyclone being eroded by dry air on the west side and the approach to the jet-stream cloud pattern across and east of northern Japan. Table 1 contains a list of selected ship observations taken during the weakening phase of Man-Yi and extratropical transition. Although the cyclone was weakening, there were several reports of seas above 12 m (40 ft). In the second part of Figure 3 Man-Yi is shown at maximum intensity as an extratropical low. After initially weakening to a gale-force low near 37N 153E at 0000 UTC on the 17th, Man-Yi’s extratropical remains re-intensified to a storm-foce low by 0600 UTC on the 19th near 44n 169E with a 981-hPa central pressure. The cyclone then weakened to a subgale low on July 20, but redevelopment on an associated front approaching the U.S. Pacific Northwest offshore waters led to gale-force conditions there early on July 22.
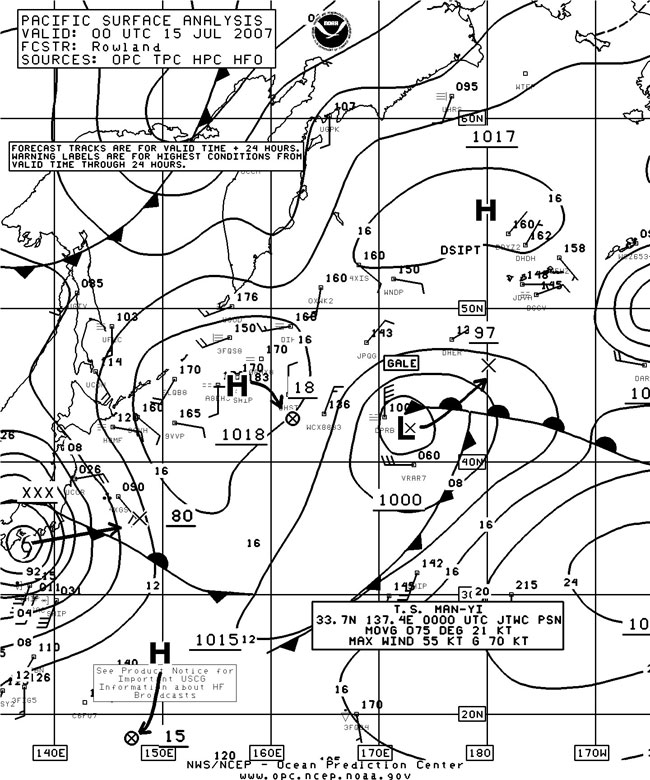
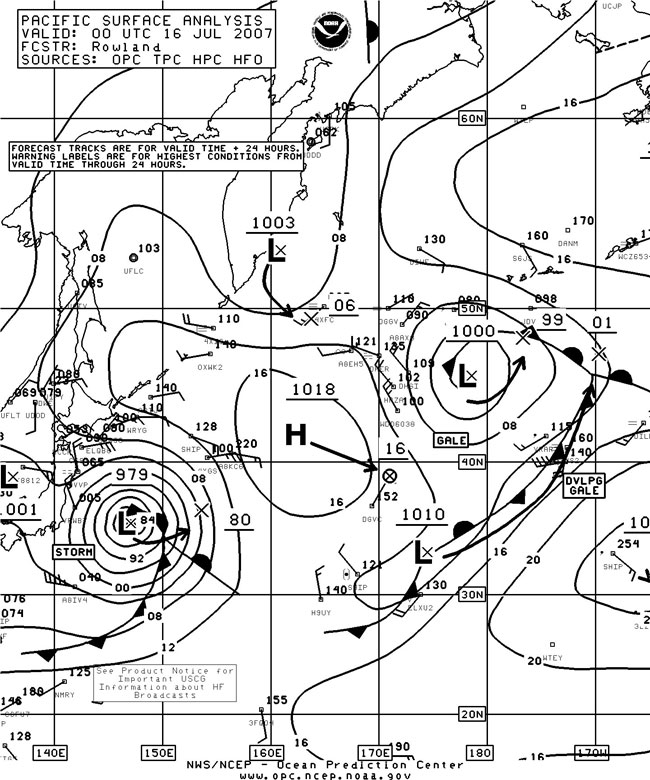
Figure 3. OPC North Pacific Surface Analysis charts (Part 2) valid 0000 UTC July 15 and 16, 2007.
(Click the image to enlarge)
| OBSERVATION | POSITION | DATE/TIME(UTC) | WIND | SEAS(m/ft) |
|---|---|---|---|---|
| Contship Vision(DGGV) | 31N 141E | 07/0300 | W 55 | 10.5/35 |
| ELYB2 | 31N 145E | 07/0600 | W 50 | 12.5/41 |
| WDC4696 | 34N 160E | 07/1200 | S 50 | 9.5/31 |
| 34N 163E | 07/1800 | S 50 | ||
| CSX Spirit (WFLG) | 42N 165E | 07/1200 | SE 50 | |
| 44N 168E | 07/2100 | SE 65 | ||
| 44N 169E | 08/0000 | S 75 | ||
| Polar Eagle (ELPT3) | 43N 140E | 07/2100 | W 40 | 9.0/30 |
| 44N 153E | 08/0700 | W 65 | ||
| 44N 154E | 08/0900 | W 70 | ||
| 45N 156E | 08/1500 | W 65 | ||
| 45N 157E | 08/2100 | W 65 | ||
| 46N 158E | 09/0000 | W 55 | ||
| VRVB5 | 46N 152E | 08/1200 | NW 50 | 9.5/31 |
| ELYB2 | 31N 144E | 08/1800 | NW 35 | 10.5/34 |
| Buoy 46035 | 57N 177.7W | 09/1300 | S 25 | 7.5/25 |
| Buoy 46071 | 51.3N 179.1E | 10/0000 | S 25 | 8.5/28 |
Table 1. Ship and buoy observations taken during the passage of Tropical Cyclone Man-Yi.
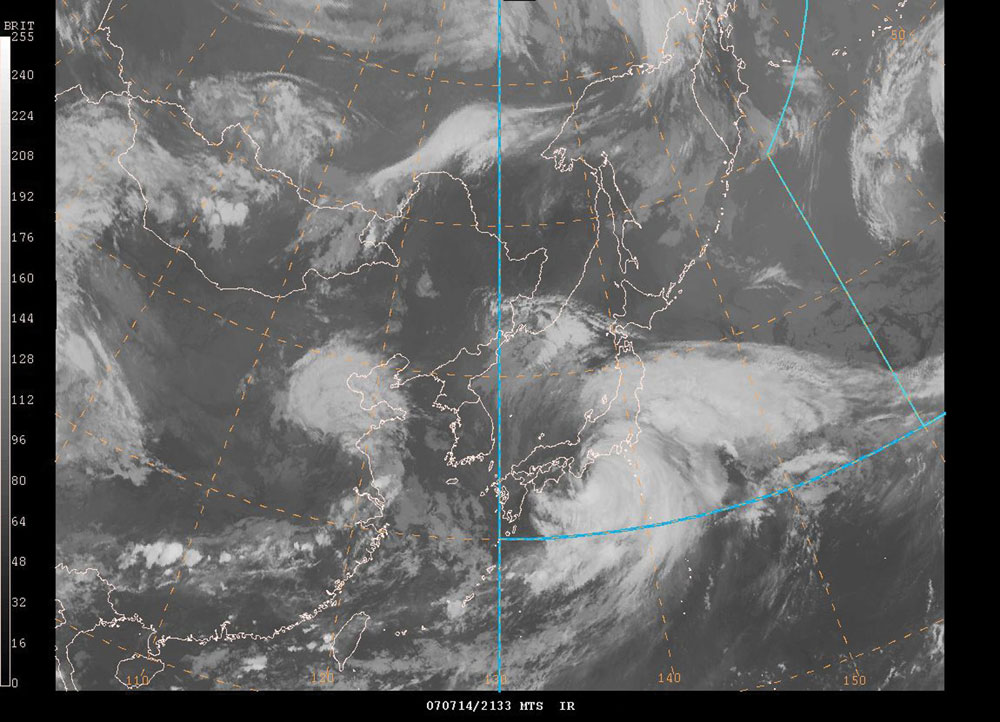
Figure 4. MTS infrared satellite image of Typhoon Man-Yi about fourteen hours prior to becoming extratropical. The satellite senses temperature on a scale from cold (white) to warm (black). The valid time of the image is 2133 UTC July 14, 2007, or about two and one-half hours prior to the valid time of the first part of Figure 3.
(Click the image to enlarge)
Typhoon Usagi: Tropical Storm 05W developed from a nontropical low near 18N 148E at 1800 UTC July 28 with maximum sustained winds of 35 kts with gusts to 45 kts. The cyclone was named Usagi at 0600 UTC on the 29th, with intensification through the end of the month as the cyclone moved northwest. At 0000 UTC August 1, Usagi attained a maximum intensity at 120 kts for sustained winds with gusts to 145 kts, near 25N 137E. A weakening trend followed as Usagi moved into the Sea of Japan late on August 2, where it became a tropical storm. Usagi then turned toward the northeast and weakened to a gale-force extratropical low near northern Japan late on the 3rd. Re-intensification followed as the cyclone tracked northeast across the Kurile Islands as depicted in Figure 5. Extratropical storm Usagi is shown in the second part of Figure 5, and Figure 6 reveals storm-force winds as high as 55 kts in high-resolution QuikSCAT-derived winds on the east side of the storm center. Table 2 lists selected ship and buoy observations taken during Tropical Cyclone Usagi and also during its extratropical transition. The lowest central pressure of 980 hPa was reached six hours later, at 0600 UTC as Usagi made a turn to the north. The cyclone then became stationary and weakened near the Commander Islands later on the 6th, before drifting southeast on the 7th and remaining a gale until early on August 8. The remains of Usagi then became absorbed by a stronger low approaching from the south late on the 10th.
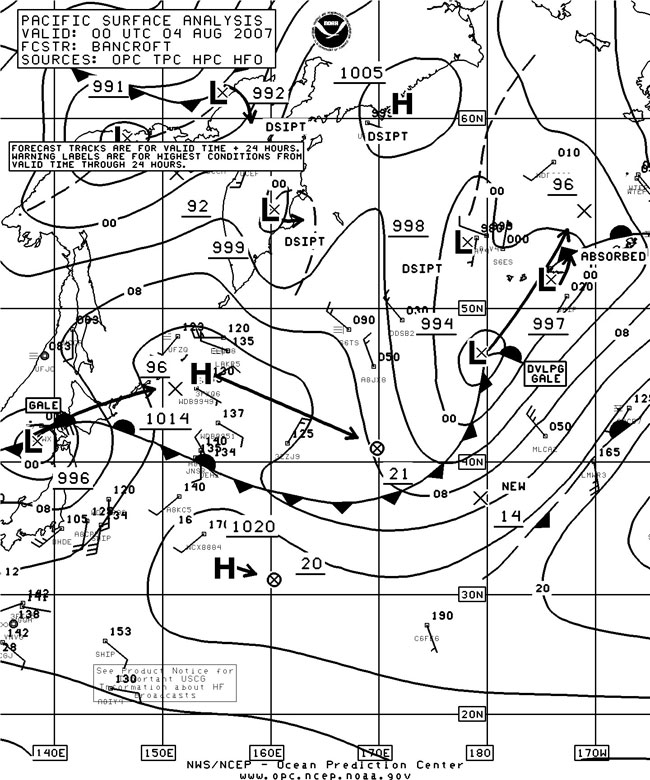
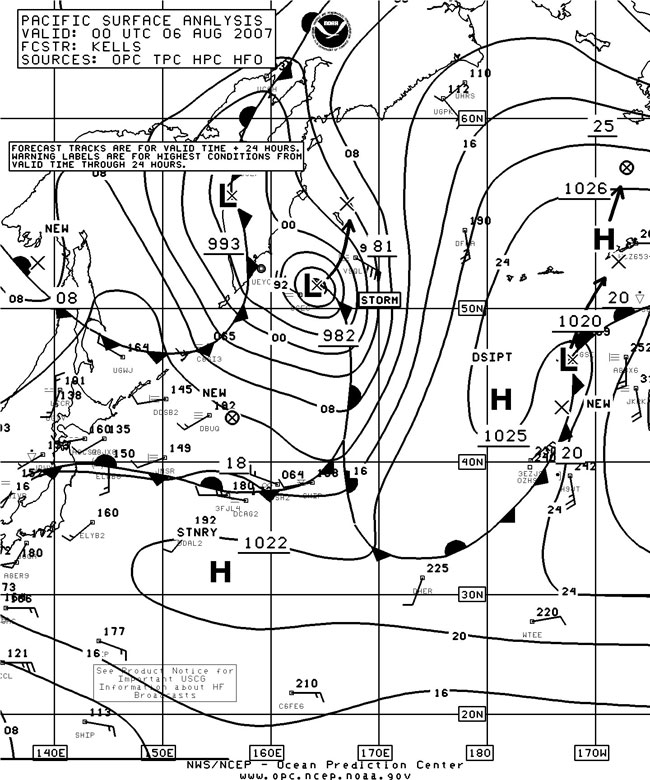
Figure 5. OPC North Pacific Surface Analysis charts (Part 2) valid 0000 UTC August 4 and 6, 2007.
(Click the image to enlarge)
| OBSERVATION | POSITION | DATE/TIME(UTC) | WIND | SEAS(m/ft) |
|---|---|---|---|---|
| OXQP2 | 36N 169W | 24/0600 | SW 45 | 7.5/25 |
| 37N 164W | 24/1800 | S 45 | 8.0/27 | |
| CSX Enterprise | 48N 179W | 24/1200 | NW 55 | |
| (KRGB) | 48N 172W | 25/0600 | NW 45 | 9.5/31 |
| NMEL | 55N 165W | 25/0900 | NE 55 | 8.0/26 |
| 55N 165W | 25/1200 | N 45 | 8.0/26 | |
| Buoy 46707 | 45.7N 153.1W | 25/0300 | S 50 | |
| Buoy 46075 | 53.9N 160.9W | 25/0600 | E 40 | 7.5/25 |
| 25/0900 | SE 20 | 8.5/28 |
Table 2. Selected ship and buoy observations taken during passage of Tropical Cyclone Usagi and after extratropical transition.
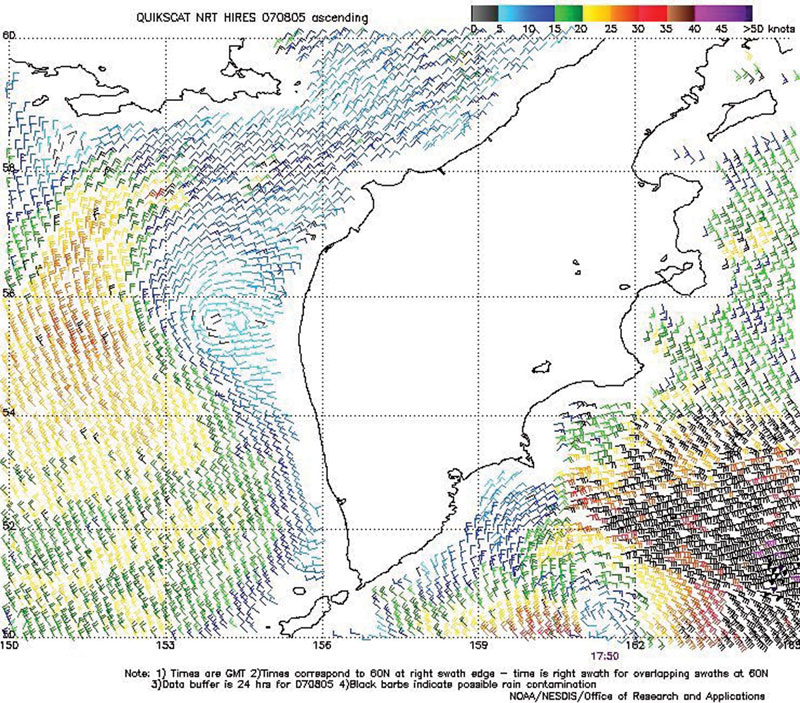
Figure 6. High-resolution QuikScat scatterometer image of satellite-sensed winds around the storm, former Typhoon Usagi, shown in the second part of Figure 5. The resolution is 12.5 km, versus 25 km in the coarser-resolution version of QuikScat imagery. The valid time of the pass is 1750 UTC August 5, 2007, or about six hours prior to the valid time of the second part of Figure 5. Image is courtesy of NOAA/NESDIS/ Office of Research and Applications
(Click the image to enlarge)
Tropical Storm Sepat: Sepat made a brief appearance of OPC’s oceanic surface analyses at 1800 UTC August 12, forming near 17N 135E with maximum sustained winds of 40 kts with gusts to 50 kts. Sepat then headed west-southwest and intensified to a typhoon west of OPC’s chart area while continuing to move west.
Typhoon Fitow: Fitow originated from a non-tropical low that was near 16N 150E at 1800 UTC August 18. It became initially Tropical Storm 10W near 21N 156E at 0000 UTC on the 29th, moving north with maximum sustained winds of 35 kts with gusts to 45 kts, and was renamed Fitow six hours later. By the 30th, Fitow became a slowly intensifying typhoon with maximum sustained winds of 70 kts with gusts to 85 kts. Fitow’s history will be continued into September, to be described in the April 2008 issue of MWL.
Other Significant Events
Western North Pacific Storm, May 6-8: Low pressure developed just south of Japan late on May 5 and moved northeast but was forced north on the 6th by a large high-pressure area in the central Pacific. The cyclone developed storm-force winds early on the 6th near 36N 141E with the central pressure down to 990 hPa. The central pressure lowered to 980 hPa with the center near 47N 149E at 1800 UTC on the 7th. The cyclone then stalled and weakened west of the Kamchatka Peninsula on the 9th. At 0600 UTC May 5 the ship C6CL6 (42N 144E) reported southwest winds of 40 kts and 5.5-m seas (18 ft). At 1200 UTC on the 6th, OOCL Japan (VRWB7) reported south winds of 40 kts near 36N 142E. Later, at 0000 UTC on the 8th, the ship UDDD (51N 157E) encountered east winds of 50 kts.
Western North Pacific Storm, May 10-11: Low pressure moved east from Japan and intensified to a storm-force low within twenty-four hours as depicted in Figure 7. The second part of Figure 7 shows the cyclone at maximum intensity. The high-resolution QuikSCAT image (Figure 8) reveals winds to 55 kts around the west and northwest sides of the storm center about nine and one-half hours before the time of second part of Figure 7. At 0600 UTC May 11, the Albert (DGTX) reported southwest winds of 40 kts and 5.0-m seas (16 ft) near 35N 148E. Six hours later, the Shanghai Express (DGSE) encountered north winds of 45 kts near 38N 145E. The cyclone subsequently turned north like its predecessor into the Sea of Okhotsk, where it stalled and weakened on the 13th and 14th.
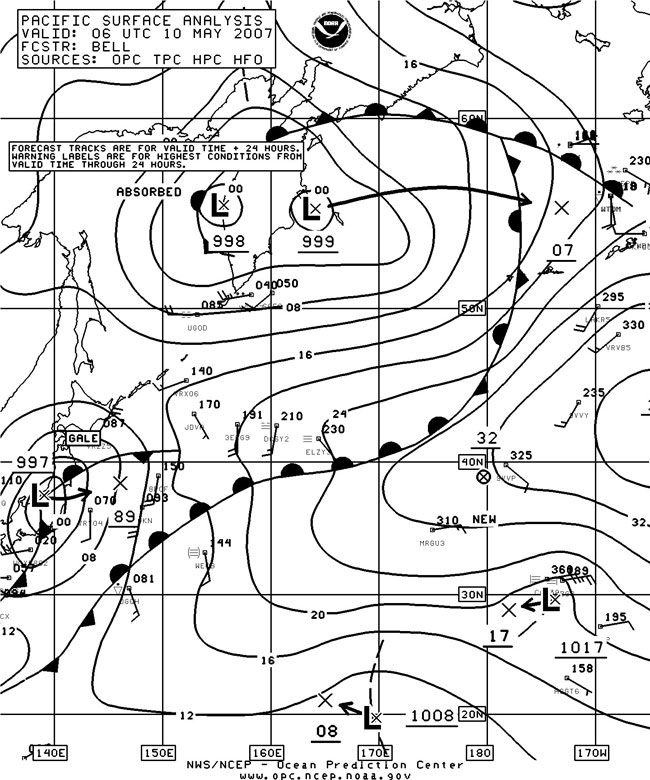
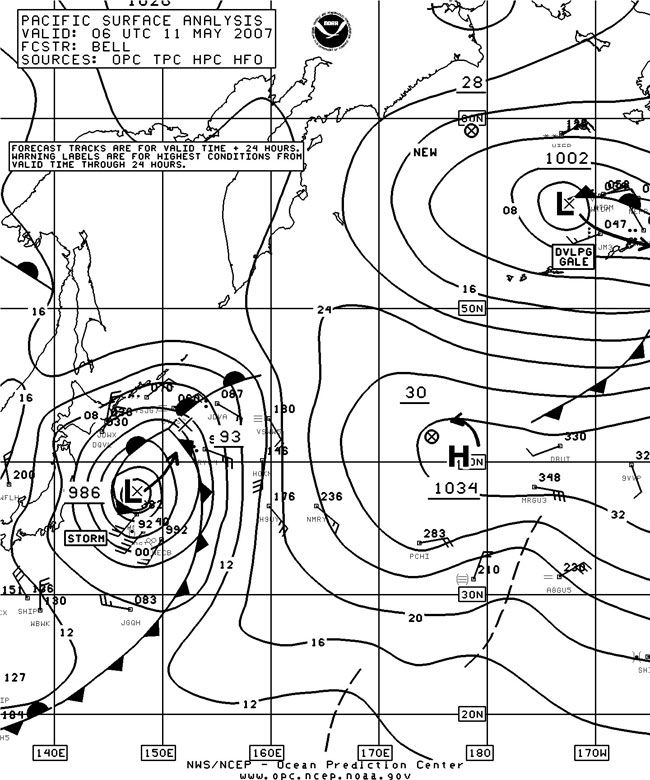
Figure 7. OPC North Pacific Surface Analysis charts (Part 2) valid 0600 UTC May 10 and 11, 2007.
(Click the image to enlarge)
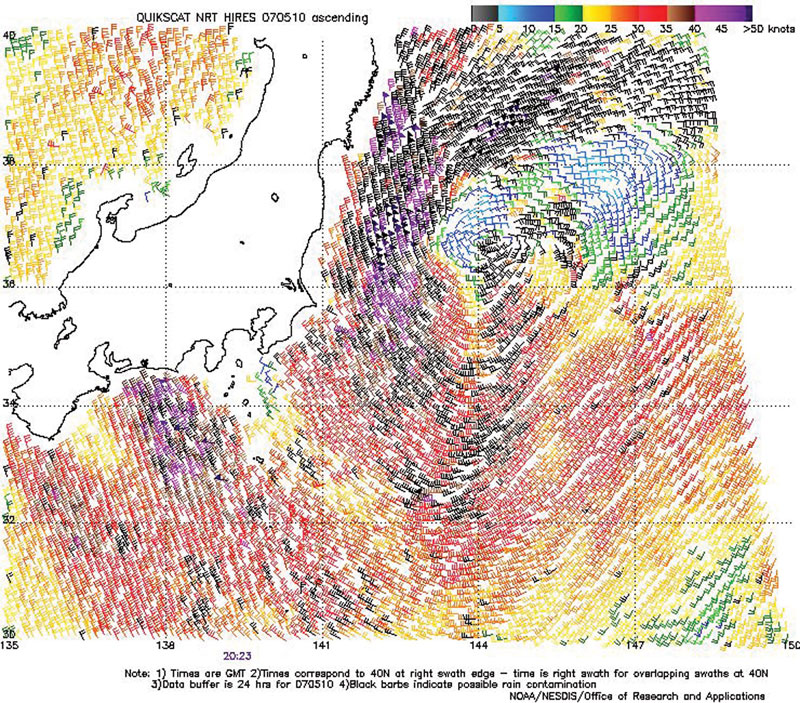
Figure 8. High-resolution QuikScat scatterometer image of satellite-sensed winds around the storm shown in Figure 7. The valid time of the pass is 2023 UTC May 10, 2007, or about nine and one-half hours prior to the valid time of the second part of Figure 7. Image is courtesy of NOAA/NESDIS/ Office of Research and Applications.
(Click the image to enlarge)
Eastern North Pacific Storm, May 17-18: The development of this storm is depicted in Figure 9, as a frontal wave of low pressure passed south of an old stalled system in the Gulf of Alaska and was likely enhanced by it. The central pressure dropped 20 hPa in the twenty-four hour period ending at 0000 UTC May 18. The relatively compact appearance of the storm in the second part of Figure 9 is reflected in the high-resolution QuikSCAT image (Figure 10) with the stronger winds close to the well-defined center. Winds up to 60 kts southwest of the center make this cyclone appear to have the strongest winds in a non-tropical low in the North Pacific during the four-month period. The system subsequently weakened to a gale-force low six hours later as it drifted northeast. Dissipation followed near Vancouver Island on May 20.
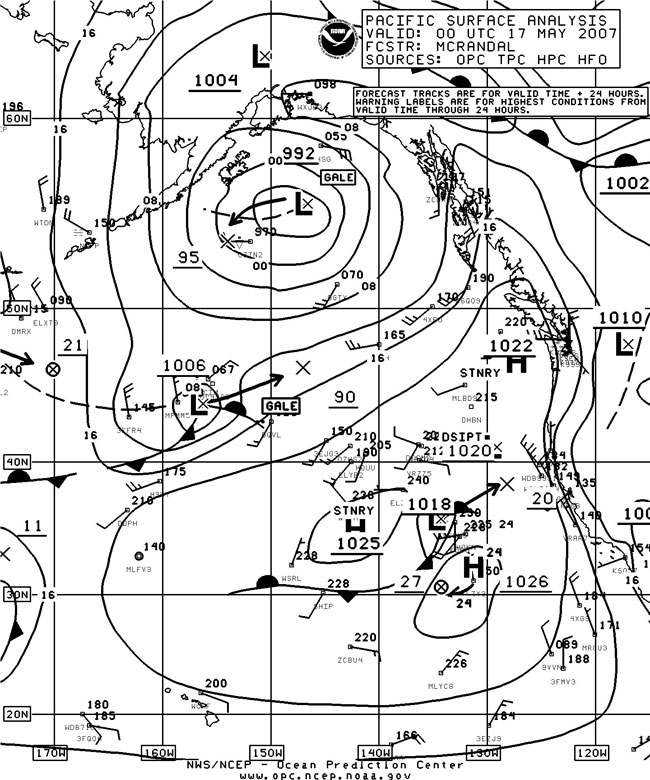
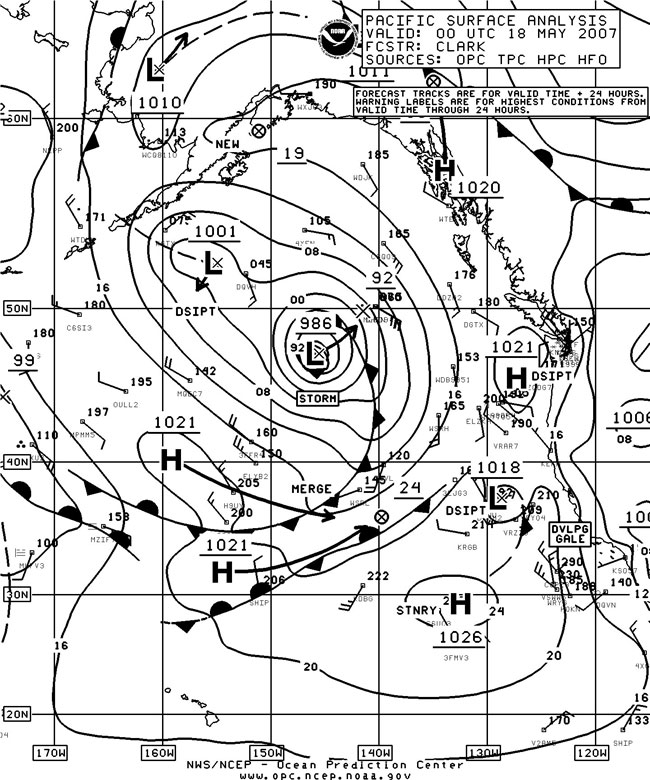
Figure 9. OPC North Pacific Surface Analysis chart (Part 1 - east) valid 0000 UTC May 17 and 18, 2007.
(Click the image to enlarge)
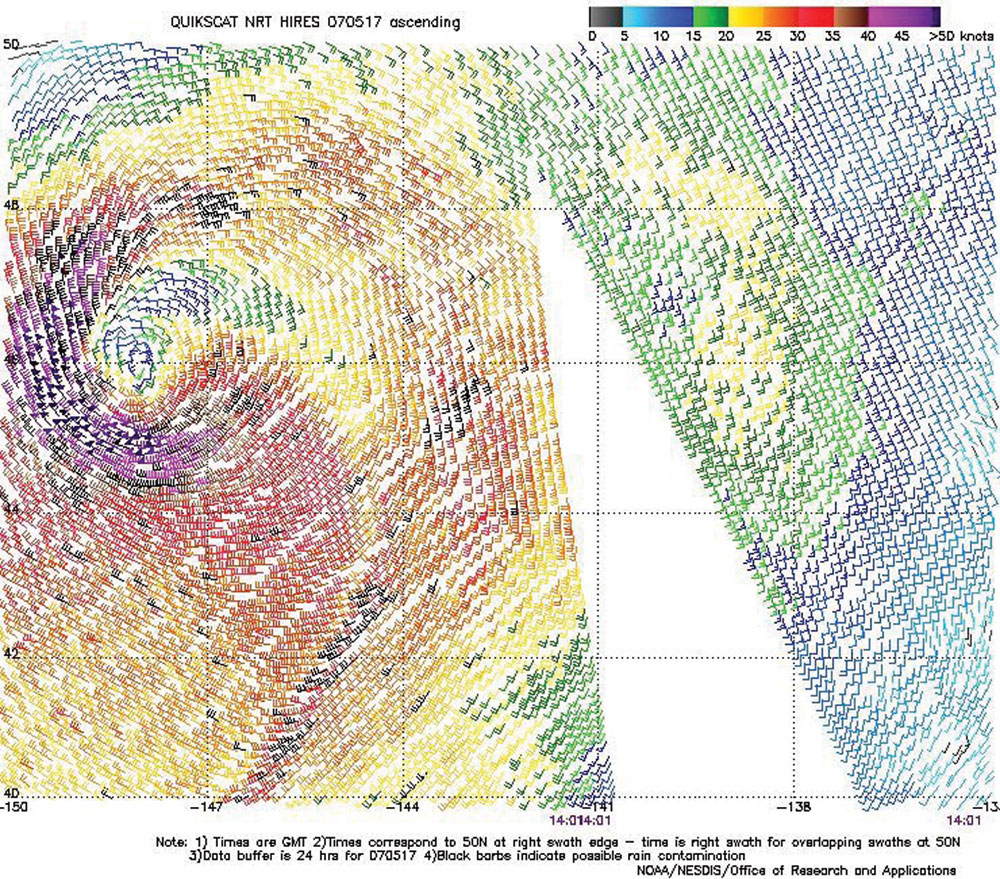
Figure 10. High-resolution QuikScat scatterometer image of satellite-sensed winds around the storm shown in Figure 9. The valid time of the pass is 1401 UTC May 17, 2007, or about ten hours prior to the valid time of the second part of Figure 9. Image is courtesy of NOAA/NESDIS/ Office of Research and Applications.
(Click the image to enlarge)
North Pacific Storm of May 22-23: A low-pressure system tracked east across the Pacific from Japan, between 40N and 43N before turning north toward the eastern Aleutians on May 23. Winds were mostly gale force with this cyclone, except for brief marginal storm conditions on its southwest side indicated in QuikSCAT imagery near 1800 UTC on the 23rd, when the center was at 46N 162W with a 984-hPa central pressure. The ship V2OB8 (43N 158W) reported southeast winds of 35 kts at 0600 UTC on the 23rd. The cyclone then weakened while moving northeast, and dissipated near Kodiak Island on the 26th.
Western North Pacific Storms, June 16-23: Two marginal storm-force lows developed in close succession over the western waters during this period, with the stronger one described here (June16-18). This developing storm was similar in track and intensity to the May 10-11 event. It was already a gale when over Japan and intensified to a storm-force low east of Japan as depicted in Figure 11. A high-resolution QuikSCAT image available from 1900 UTC on the 16th (not shown but similar to Figure 8) revealed 50-kts winds west of the center. With blocking high pressure to the east, the cyclone was forced north toward the Kamchatka Peninsula, where it weakened on the 19th.
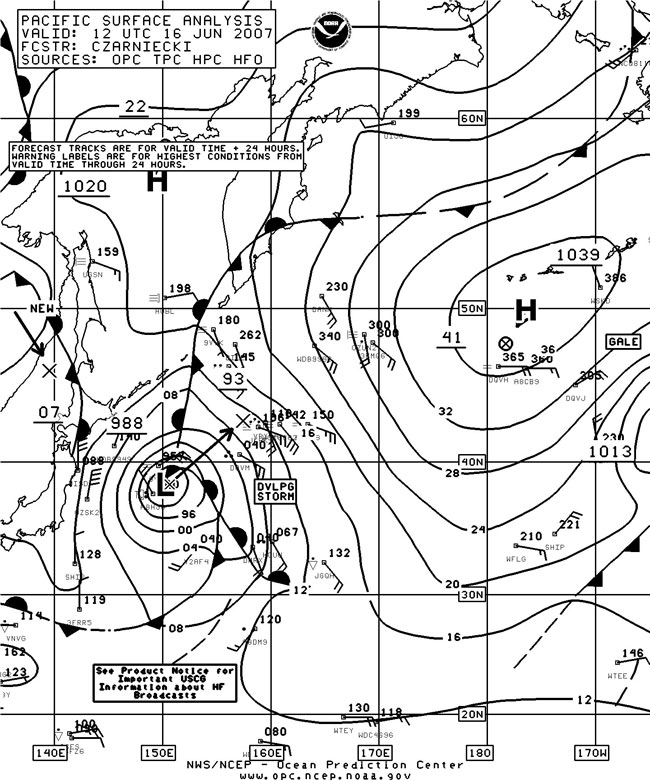
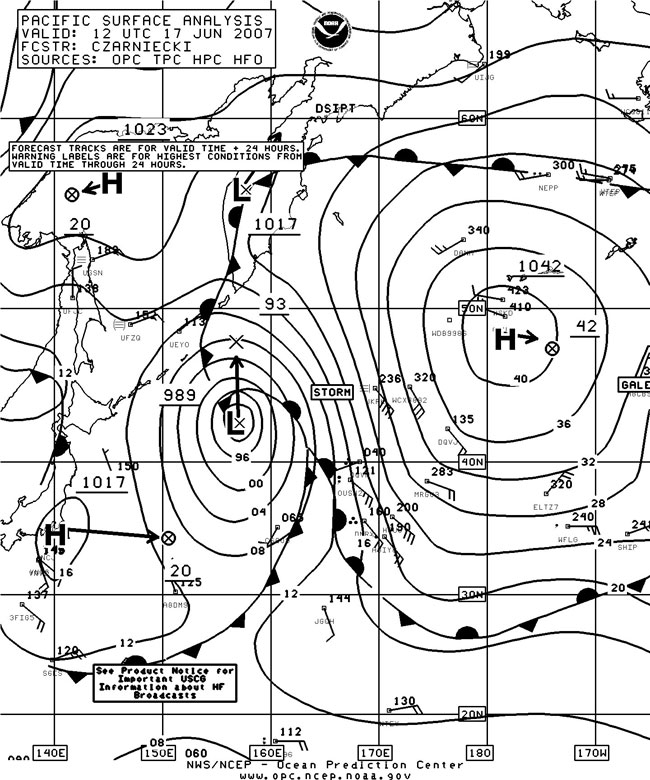
Figure 11. OPC North Pacific Surface Analysis charts (Part 2) valid 1200 UTC June 15 and 17, 2007.
(Click the image to enlarge)
References
- QuikSCAT in the Ocean Prediction Center, http://www.opc.ncep.noaa.gov/quikscat/index.shtml
- Saffir-Simpson Scale of Hurricane Intensity, http://www.nhc.noaa.gov/aboutsshs.shtml