Mean Circulation Highlights and Climate Anomalies
May through August 2007
Anthony Artusa, Meteorologist, Climate Operations Branch, Climate Prediction Center NCEP/NWS/NOAA.
May-June 2007
The circulation pattern over the Northern Hemisphere during May and June was characterized by above normal mid-tropospheric heights which extended northward from the north-central Pacific across eastern Siberia and the Bering Sea up to the North Pole. Above normal heights were also observed across much of the western and interior northeastern sections of the contiguous United States, as well as from eastern Europe to the Caspian Sea. In contrast, below normal mid-tropospheric heights were observed to the north of this latter region, namely across much of northern Europe and Russia.
The above normal 500 hPa heights and above normal sea level pressure (SLP) over the interior Northeast U.S. was accompanied by warmer than normal surface temperatures. Above normal mid-tropospheric heights over a large portion of the West were also associated with relative warmth, though the sea level pressure anomaly pattern was very weak and ill-defined. An area of near to below normal surface temperatures developed over the southern Great Plains in May, and then expanded northward throughout Oklahoma and Kansas in June. This was related to an unusually prolonged spell of stormy weather, caused by weak disturbances which drifted aimlessly across this region. Much of the western and eastern thirds of the lower 48 states reported relatively dry conditions in May, with the dryness persisting across the east-central states in June.
The Tropics
Neutral ENSO conditions at the start of May were slowly trending toward La Nina conditions. Cooler than average sea surface temperatures (SSTs) were observed across the equatorial Pacific from near the Date Line to the coast of South America, though by June the western margin of this area of cool ocean waters briefly retracted to near 140W. In addition, stronger than average low level trade winds were reported in the vicinity of the Date Line. This is also consistent with a gradual evolution towards a cold episode. The first tropical cyclone of the 2007 Atlantic season was a subtropical storm named Andrea which formed off the Southeast coast on May 9th. According to the National Hurricane Center, although this storm remained offshore and reached subtropical storm status for only a day or two, it was the first May cyclone in the Atlantic basin since 1981. In early June, short-lived Tropical Storm Barry brought beneficial rains to parts of Florida. Tropical activity commenced on schedule for the eastern Pacific, with the formation of Tropical Storms Alvin and Barbara. A very unusual event for early June in the northern Indian Ocean was the development of a very powerful tropical cyclone, Gonu, with winds up to 130 kts. Although this storm weakened significantly as it approached Oman's capital city of Muscat, it still resulted in a number of casualties and widespread damage with its strong winds and torrential rains before moving into southern Iran as a much weaker tropical storm.
July-August 2007
The mean circulation for July and August featured significantly above normal mid-tropospheric heights across a large portion of the Arctic basin. Above normal heights were also observed over the interior Western U.S., accompanied by an upper ridge. Although there was a trough over eastern North America during this period, heights remained close to seasonal values. Weak anomalous troughs dominated the Gulf of Alaska, as well as western and northern Europe.
The sea level pressure anomaly map indicates modest departures from average over most of North America. Despite this non-descript pattern in the two-month mean, there were several notable events that occurred. On August 8th, Reagan National Airport in the Washington, D.C. area saw a record high for the day of 39C (102F). Another unusual event on the same day was the tornado that affected parts of the New York City Metro area, with top winds estimated at 96-117 kts. The Southwest Summer Monsoon started up in early July as is typical, bringing above average amounts of rainfall to New Mexico for the month of July, while hot temperatures, gusty winds and very dry air contributed to extensive wildfire coverage across the interior Northwest CONUS. Elsewhere, a broad band of below normal SLP extended from Europe eastward across northern Russia and Siberia.
The Tropics
In mid-August, a classic Cape Verde hurricane named Dean attained hurricane intensity well east of the Lesser Antilles. It continued west-northwestward across the Caribbean, passing just south of Jamaica, and strengthened to a Category 5 storm just prior to landfall along the Yucatan coast on August 21st. After crossing the Yucatan Peninsula, Dean remained a hurricane (though significantly weakened) and briefly headed west across the Bay of Campeche before making landfall a second time along the Mexican coast. In the eastern tropical Pacific during mid to late July, a cyclone named Cosme briefly reached hurricane status as it headed toward the Hawaiian Islands. Over cooler ocean waters, Cosme weakened to a tropical depression as it skirted 320 km south of the Big Island, but was close enough to bring beneficial rain to drought-stricken areas.
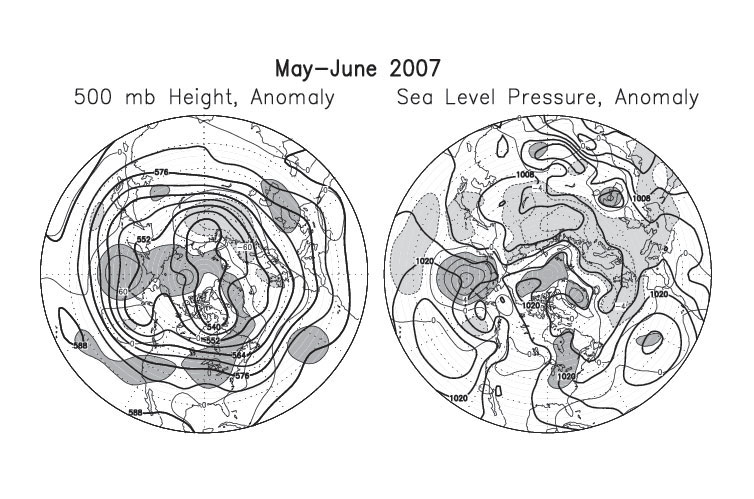
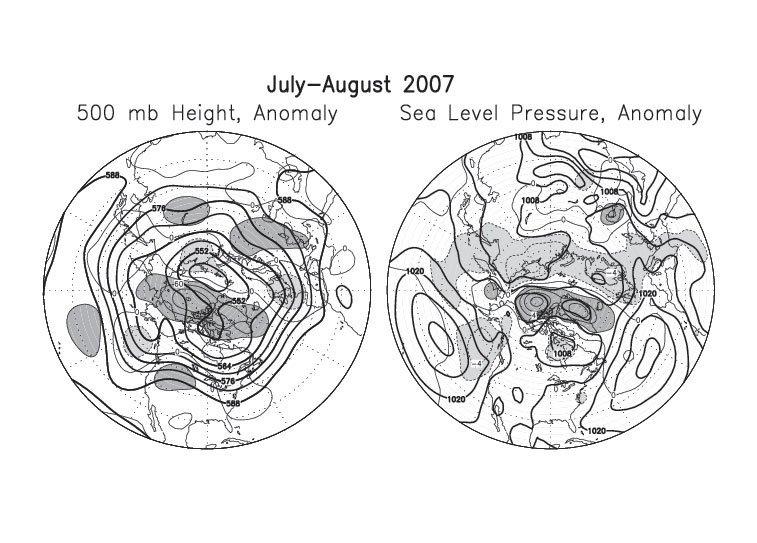
Figure legends and description of units:
The charts above, left side, (Figures 1 and 2) show the seasonal mean 500 hPa height contours at 60 m intervals in heavy solid lines, with alternate contours labeled in decameters (dm). Positive height anomalies are contoured in light solid lines at 30 m intervals, and light dashed lines show negative height anomalies. Areas of mean height anomalies more than 30 m above normal have heavy shading, and areas of mean height anomalies more than 30 m below normal have light shading.
The charts above, right side, (Figures 3 and 4) show the seasonal mean sea level pressure (SLP) at 4 hPa intervals in heavy solid lines, labeled in hPa at selected intervals. Anomalies of SLP are contoured in light lines at 2 hPa intervals, with dark shading and solid lines in areas more than 2 hPa above normal, and light shading with dashed lines in areas greater than 2 hPa below normal.