Estimating the Wind Speed During A Hurricane at Sea
Professor S. A. Hsu, Louisiana State University, email: sahsu@lsu.eduDuring a hurricane the wind speed and its vertical variation are essential to know not only for maritime safety but also for wind loading and wave prediction. According to Hsu (2003a) (for a detailed derivation see Hsu, in press),
and its limit
where U10 (in m/s) is the wind speed at 10 m, P (in mb) is the pressure at a site in question, U10 (in m/s) is the maximum U10 and P0 is the hurricanes minimal sea-level (central) pressure (in max mb).
An example to apply Eq. (1) is provided as follows (for satellite meteorology, see Hsu 2003a): During Hurricane Lili (2002), buoy 42003 located about 280 km to the east of the center recorded P = 1011.1 mb. From Eq. (1a), U10 = 6.3(1013 - 1011.1)0.5 = 8.7 m/s which is in good agreement with the measured value of 9.2 m/s at 42003. Also, since P0 = 956.1 mb, from Eq. (1b) U10 max = 6.3(1013 - 956.1)0.5 = 47.5 m/s, which is in excellent agreement with the measured value of 47.2 m/s at buoy 42001 near the eyewall.
To test this relationship further, new data is employed which recently became available due to Hurricane Wilma in 2005 and its path near National Data Buoy Center buoy 42056 in the northeastern Caribbean Sea (see www.ndbc.noaa.gov and www.nhc.noaa.gov). In addition, data from Hurricane Kate in 1985 near buoy 42003 (Hsu, 2003b) and Lili in 2002 near buoy 42001 (Hsu, 2003a) are incorporated into our analysis. Note that since the standard mean sea-level pressure for 30°N in July and 15°N annual is1013 mb (Atkinson, 1971), we retain all pressure values less than 1013 mb from these three buoys. The only exception occurred during the passage of the eye of Kate over 42003 on November 20 at 18 Z, when U10 was only 16.6 m/s and P was 957.1 mb (Hsu, 2003b).
From our result presented in Figure 1, it can be seen that the relationship between Eq. (1) and U10 as measured by buoys is almost one-on-one, meaning that Eq. (1) is further verified for operational applications.
The vertical variation of the wind speed is also important.
According to Hsu (2003b and 2006) when U10 is greater than 20 m/s (or 39 kts),
where Uz is the wind speed at height z other than 10 m.
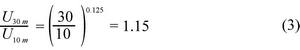
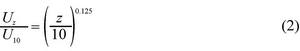
For example, if the wind speed at 30 m (or 100 ft) is needed, then from Eq. (2)
or U30 is approximately 15% higher than U10.
From Eq. (1) and Figure 1 we conclude that
where P is the pressure in mb as before.
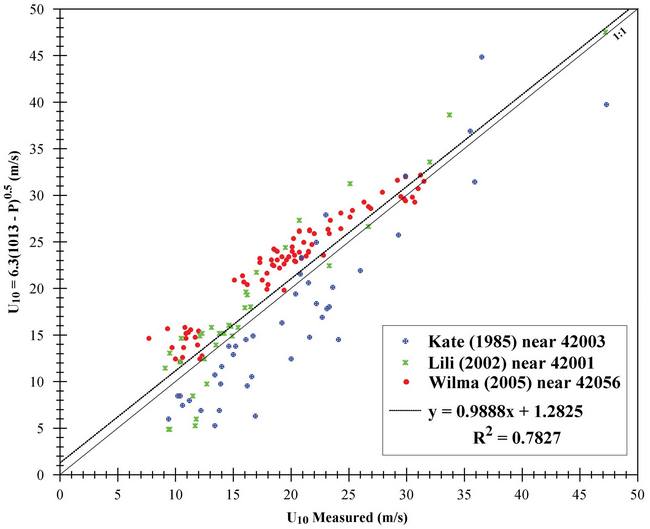
Figure 1. A verification of Eq. (1) against buoy measurements.
References
Atkinson, G. D., Forecaster‘s Guide to Tropical Meteorology, (Tech. Rept. 240, Air Weather Service, U.S. Air Force, 1971).
Hsu, S. A., Nowcasting the wind speed during a hurricane at sea, (Mariner‘s Weather Log, Spring/Summer 2003a, Vol. 1, No. 1, pp. 10-11). http://www.vos.noaa.gov/MWL/spring_03/nowcasting.shtml
Hsu, S. A., Estimating overwater friction velocity and exponent of power-law wind profile from gust factor during storms, (Journal of Waterway, Port, Coastal, and Ocean Engineering, July/August 2003b, Vol. 129, No. 4, pp. 174-177).
Hsu, S. A., Measurements of overwater gust factor from NDBC buoys during hurricanes. (2006-EJ2, 2006, in http://www.nwas.org/ej/2006/2006.html).
Hsu, S. A., Air-Sea Interaction, (in "Encyclopedia of Water" by Wiley, in press).