Tropical Atlantic and Tropical East Pacific Areas May through August 2006
Robbie Berg and Mark Willis, Tropical Analysis and Forecast Branch, Tropical Prediction Center, Miami, FloridaIntroduction
The May through August time period includes the beginning of the 2006 hurricane season. Thus, much of the significant weather during this period was due to tropical cyclones that developed in both the Atlantic and East Pacific Basins. In the Atlantic, five named storms developed during this time frame, including one hurricane (Ernesto). Gale warnings were issued in TPC’s Tropical Analysis and Forecast Branch (TAFB) Atlantic high seas forecasts on two non-tropical events. The first event was associated with a late season cold front while the second was a long-lived event associated with strong Atlantic high pressure. Eleven named storms developed in the East Pacific including seven hurricanes, while only one non-tropical gale warning was issued for a late season Gulf of Tehuantepec event. The details of the 2006 hurricane season will be discussed in a future edition of the Mariner’s Weather Log.
Atlantic
The first non-tropical gale warning during the period was issued at 0600 UTC on 17 May in association with the same late-season frontal system that initiated a gale warning in the Gulf of Tehuantepec (discussed in this article). The warning in the southwest North Atlantic was due to expected prefrontal 30 to 35 kts south to southwest winds. At 0600 UTC 17 May, the cold front extended northeast through the northwest Caribbean Sea and southeast Gulf of Mexico, through Florida, and into the southwest North Atlantic with a pair of 1006 hPa lows centered just north of the western tip of Cuba and over the Atlantic waters just east of the south central Florida coast (Figure 1). At 0600 UTC May 17, the frontal system was interacting with the southwest periphery of a 1023 hPa Bermuda-Azores high pressure area. The available surface, buoy, and ship observations were mostly 10 kts or more below gale force from 0600-1200 UTC May 17. However, between 1200 UTC May 17 and 0000 UTC May 18 the Bermuda-Azores strengthened to 1030 hPa while the low just east of the south central Florida coast also deepened slightly to 1005 hPa by 1800 UTC May 17. The associated increase in pressure gradient led to increased southwesterly winds, with U.S. Navy drifting buoy 41645 and the ship British Merchant (VQIB9) both reporting 30 kts just east of the deepening low at 1800 UTC. Also, a descending QuikSCAT pass at 2218 UTC 17 May (Figure 2) showed increased south to southwesterly winds in the warning area in comparison with the previous ascending pass over the area at 0958 UTC. Both of these QuikSCAT passes revealed a few rain-contaminated 35 kt vectors. However, the surrounding data were not rain-contaminated and were just below gale force, indicating that this was a marginal gale event. Unfortunately QuikSCAT coverage in the tropical North Atlantic on 17 May just northeast of the Bahamas was lacking due to gaps in the satellite’s orbit.
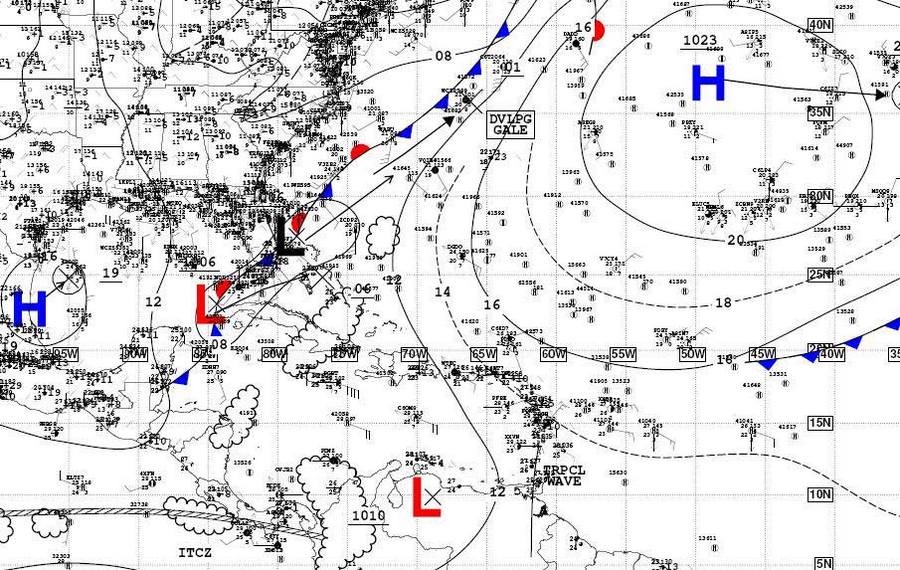
Figure 1. National Weather Service Unified Surface Map from 0600 UTC 17 May.
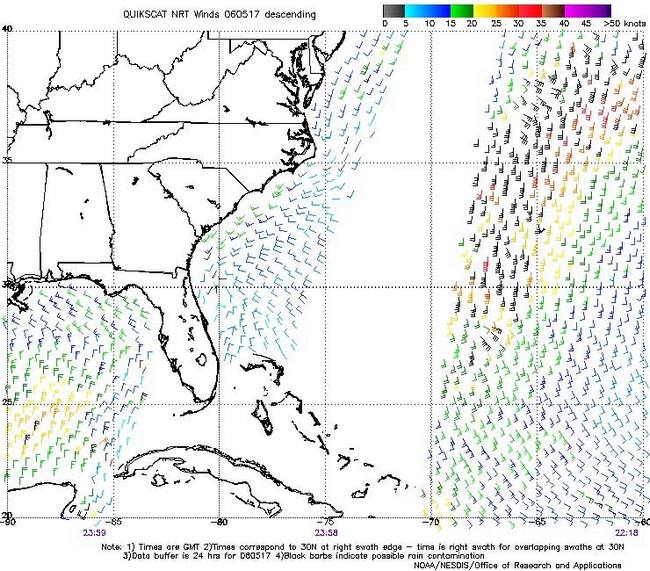
Figure 2. QuikSCAT pass from 2218 UTC May 17, 2006 showing strong prefrontal S/SW winds off the East Coast.
There were numerous gale warnings posted and cancelled from 26 June through 11 July due to strong easterly trade winds in the southwest Caribbean Sea south of 15N between 70W and 80W. This is only described as one event due to the minor fluctuation of the trade winds during the period. The gale warnings were verified by several ship observations during the span of the event. The event was generated by a strong pressure gradient associated with the interaction of a subtropical high in the central Atlantic with lower pressure near Colombia, and occasionally enhanced by tropical waves propagating through the area. The strong subtropical high north of the area was generally analyzed between 1030 to 1040 hPa throughout the event (Figure 3).
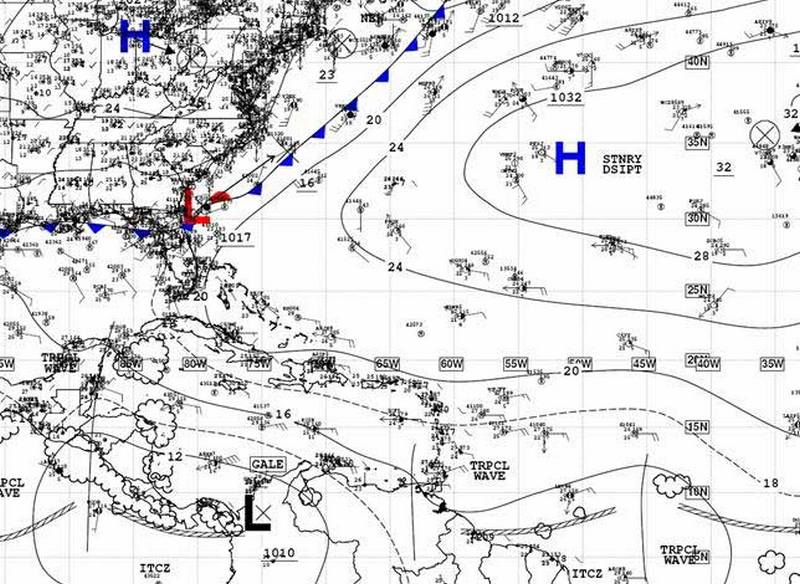
Figure 3. National Weather Service Unified Surface Map from 0600 UTC 7 July
Westward propagating swells associated with these types of events commonly produce dangerous surf conditions at exposed beaches along the Caribbean coast of Central America. Data from NOAA buoys 42057 and 42056 in the western Caribbean portray how the effects of this event spread well outside the strongest wind region. At 2100 UTC 06 July, buoy 42057 had a peak significant wave height of 2.8 m (9.3 ft) and a dominant period of 10 seconds. Even farther away, the Yucatan Basin buoy 42056 recorded 2 to 2.5 m (6 to 8 ft) seas with 8 to 10 second dominant periods from 0800 UTC 7 July through 1300 UTC 8 July. It is interesting to note that the directional wave sensor on this buoy showed the swell coming from the east-southeast during this time. This swell direction was likely due to the angular spreading of the ocean swells propagating outside of the gale warning area.
Eastern Pacific
On average, the latest date for the last Gulf of Tehuantepec gale for the winter season is April 1. This year, one gale event was noted in the Gulf beginning around 0000 UTC May 17, about a month and a half later than normal and just after the beginning date of the East Pacific hurricane season. This event was spurred by a late-season cold front which moved into the Gulf of Mexico around 0000 UTC May 15 and moved southeast across the region, reaching the Isthmus of Tehuantepec nearly 24 hours later (discussed previously in the article). By 1200 UTC May 16, a QuikSCAT pass indicated that the wind surge had begun over the Gulf of Tehuantepec with wind speeds near 30 kts. The next QuikSCAT pass on the evening of May 16 showed that winds had increased to near 40 kts, prompting the issuance of a gale warning by TAFB (Figure 4). The warning was in effect for 18 hours and was verified by a QuikSCAT pass near 0000 UTC May 18 that showed winds just below gale force. The highest wind reported by a ship in the region was 30 kts by the ZIM Israel (9HBG8) at 1200 UTC May 17 near 13.5N 94.3W, or just east of the strongest belt of winds.
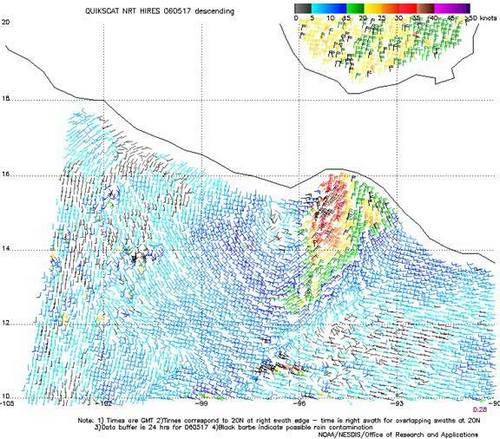
Figure 4. QuikSCAT pass from 0028 UTC May 17, 2006 showing gale force winds over the Gulf of Tehauntepec.
A second gale event was observed later in the month on May 22 over the northern Gulf of California, but the lack of observations and complex topography of this region caused this event to go unforecasted. The event began as two areas of low pressure approached the coast of southern California with a cold front trailing southward west of the Baja peninsula (Figure 5). Low-level southwesterly flow increased ahead of the front by 0000 UTC May 22, but model guidance only indicated maximum winds of 25 kts over the northern Gulf of California. In addition, the models indicated that these winds had peaked and would not strengthen any further during the next 12 to 18 hours. However, a QuikSCAT pass around 1200 UTC May 22 revealed that winds had indeed increased with gale conditions over the far northern part of the Gulf (Figure 6). TAFB did not issue a warning since these winds were expected to decrease below gale force within a few hours. A 999 hPa low was analyzed just south of Las Vegas, Nevada, near the time of the QuikSCAT pass, but model forecasts only had pressures as low as 1004 hPa at that time. This 5 hPa discrepancy likely led to the low wind forecast in the models (Figure 7). Additionally, it is unclear how the complex terrain of northwestern Mexico and the southwestern United States may have affected the models. Ship observations are rarely received from the Gulf of California, but coastal observations provided by the Mexican Navy suggest that gale conditions did occur over the open waters. San Felipe (in the state of Baja California) and Puerto Peńasco (in the state of Sonora) both reported maximum winds of 29 kts and 28 kts, respectively, just below gale force over land. In addition, several stations across the deserts of California and Arizona reported strong, gusty winds, including Phoenix with 33 kts gusting to 36 kts and El Centro, CA, with 34 kts gusting to 41 kts. Based on these observations and QuikSCAT data, this gale event likely lasted for about 12 hours. Due to poor model performance and a sparse network of surface observations, our knowledge of this complex region must be increased in order to correctly predict the occurrence of these rare gale events. Additional ship observations from the Gulf of California would aid in the recognition of gale events and allow forecasters to become familiar with weather patterns in place when these events occur. This would go a long way in improving future forecasts of these rare gales.
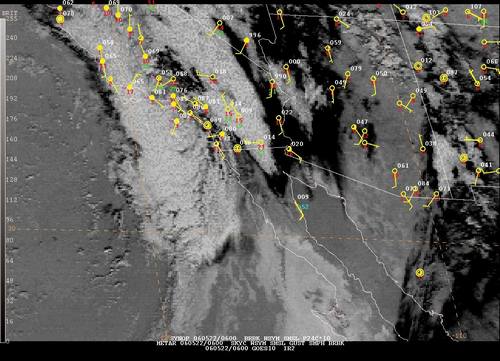
Figure 5. Satellite image and surface observations from 0600 UTC May 22, 2006 showing a cold front approaching the west coast of Baja California.
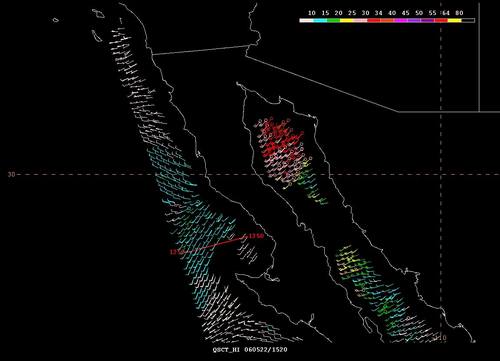
Figure 6. QuikSCAT pass from 1250 UTC May 22, 2006 showing winds stronger than 34 kts (gale force) over the extreme north part of the Gulf of California
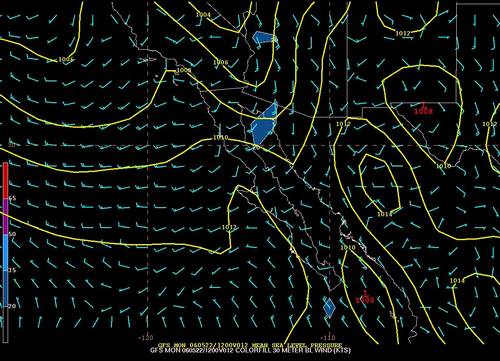
Figure 7. Sea level pressure and 30 m wind field from the Global Forecast System (FGFS) model valid at 1200 UTC May 22, 2006. The model predicted maximum winds near 25 kts whereas the QuikSCAT pass in Figure 6 indicated maximum winds at least 35 kts.
Biography
Robbie Berg has worked as a forecaster in the Tropical Analysis and Forecast Branch of the Tropical Prediction Center/National Hurricane Center since June 2002. He received a B.S. degree in meteorology and a B.S. degree in marine science from North Carolina State University and is currently pursuing a M.S. degree in meteorology from the University of Miami.
Mark Willis has worked as a forecaster in the Tropical Analysis and Forecast Branch of the Tropical Prediction Center/National Hurricane Center since July 2006. His previous work experience includes the National Weather Service forecast office in Eureka, CA, and the private marine forecasting firm Surfline, Inc. He received a B.S. degree in meteorology from Florida State University and a M.S. degree in meteorology from the University of Hawaii at Manoa.