Marine Weather Review—North Atlantic Area
May through August 2006
By George P. Bancroft, NOAA National Center for Environmental Prediction
Introduction
The May to August period is the least active of the four-month periods for non-tropical weather systems. The current period featured developing low-pressure systems moving off the U.S. coast or Canadian Maritime Provinces, with the strengthening of the Bermuda-Azores High favoring a more northern storm track as the summer progressed. Some of these lows developed storm-force winds during May and early June, mainly over the eastern North Atlantic and later in the Greenland-Iceland area and northeast Atlantic, with August being least active.
The tropical cyclones Alberto, Beryl, Debby and Ernesto affected parts of OPC’s southern waters during the period from the middle of June on. None of these became hurricanes in OPC’s waters, but Ernesto came close late in August off the southeast U.S. coast, and Alberto developed hurricane-force winds after becoming extratropical, off the northeast U.S. coast in mid-June.
Tropical Activity
Tropical Depression Alberto: The first tropical cyclone of the Atlantic season, Alberto made landfall as a tropical storm on the Florida panhandle on the afternoon of June 13, weakened to a tropical depression over the Carolinas before becoming extratropical on the 14th. The remains of Alberto then redeveloped explosively as an extratropical hurricane-force storm as depicted in Figure 1, with the central pressure dropping an impressive 32 hPa in the twenty-four period ending at 1800 UTC June 15, a deepening rate more typical of intense winter cyclones.
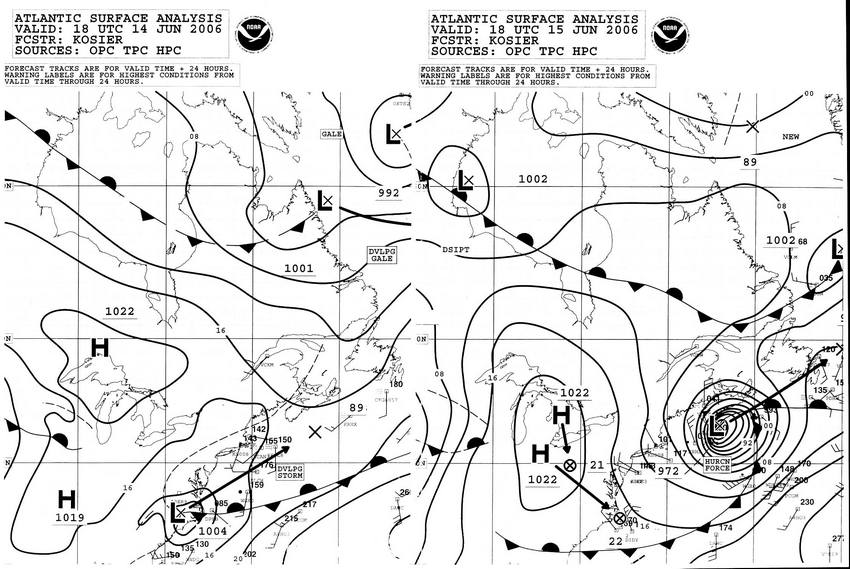
Figure 1. OPC North Atlantic Surface Analysis charts (Part 2 - west) valid 1800 UTC June 14 and 15, 2006, showing rapid intensification of the remains of Tropical Depression Alberto.
The sharp 500 hPa short-wave trough leaving the coast (Figure 2), the tropical origin and the fact that there were no other competing lows in the area likely contributed to this robust redevelopment of the remains of Alberto. For more information on the use of the 500-MB chart and the relationship between features at 500 MB and the surface see Reference 2. The cyclone appears at peak intensity in the second part of Figure 1, as a compact hurricane-force low. While ile Alberto was still inland and before extratropical transition, the Navy platform SPAG1 (31.4N 80.5W) reported a south wind of 37 kts with gusts to 43 kts at 0600 UTC June 14. Folly Island C/MAN station (32.7N 79.8W) reported a southwest wind of 31 kts with peak gusts 42 kts at 1000 UTC June 14. The buoy 41008 (31.4N 80.9W) had south winds of 31 kts with gusts to 39 kts and 2.5 m seas (8 ft) at 0200 UTC on the 14th. Seas reached 3.0 m (10 ft) three hours prior, and a peak gust of 43 kts came one hour later, at that buoy. Other observations taken after Alberto became extratropical are listed in Table 1. Remotely-sensed wind data such as QuikScat was available during the storm but missed the highest winds of the storm, but peak gusts were 66 kts at Buoy 44011 shortly after the storm center passed with buoys tending to underestimate winds. The cyclone began to weaken late on the 15th and moved across the island of Newfoundland as a gale on June 16, eventually crossing the British Isles late on the 18th.
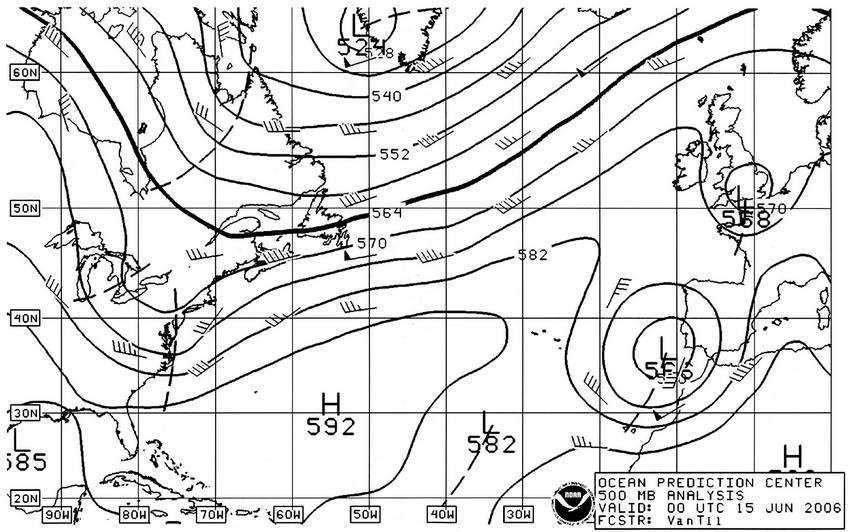
Figure 2. OPC North Atlantic 500-MB Analysis, valid 0000 UTC June 15, 2006. The chart is computer-generated with short-wave troughs (dashed lines) added manually.
| OBSERVATION | POSITION | DATE/TIME(UTC) | WIND | SEAS(m/ft) |
|---|---|---|---|---|
| APL New York (A8GS3) | 35N 73W | 15/0600 | NW 36 | |
| Lykes Discoverer (WGXO) | 38N 66W | 15/0600 | S 45 | |
| Rickmers Singapore (V7EE5) | 43N 65W | 15/1800 | NW 50 | 5.0/16 |
| Buoy 41013 | 33.4N 77.7W | 14/1800 | SW 35 G43 | 4.5/15 |
| 14/1900 | peak gust 51 | |||
| Buoy 41025 | 35.0N 75.4W | 15/0000 | NW 39 G49 | 3.0/10 |
| peak gust 54 | ||||
| 15/0100 | maximum 4.0/13 | |||
| Buoy 41001 | 34.7N 72.7W | 15/0200 | SW 37 G49 | 6.0/20 |
| Buoy 44008 | 40.5N 69.4W | 15/1000 | NW 29 G35 | 2.5/8 |
| peak gust 49 | ||||
| Buoy 44011 | 41.1N 66.6W | 15/1600 | NW 41 G52 | 7.0/23 |
| peak gust 66 | ||||
| 15/1300 | sea level pressure | |||
| 978.0 mb | ||||
| Buoy 44141 | 42.1N 56.2W | 16/0200 | SW 49 G62 | 8.5/28 |
| 16/0300 | maximum 11.0/36 | |||
| Buoy 44137 | 42.3N 62.0W | 15/1900 | S 45 | 8.5/28 |
| 15/2100 | SW 35 | 11.5/37 | ||
| Duck Pier (DUCN7) | 36.2N 75.7W | 14/2300 | NE 31 G35 | |
| peak gust 55 | ||||
| Chesapeake Light (CHLV2) | 36.9N 75.6W | 14/2100 | NE 36 G41 | |
| 14/2200 | peak gust 48 | |||
| Platform VEP717 | 46.7N 48.7W | 16/1500 | S 50 |
Table 1. Ship, buoy and coastal C/MAN station observations taken during redevelopment of Alberto as an intense extratropical low.
Tropical Storm Beryl: Tropical Depression Two formed off the southeast U.S. coast near 32N 73W on the morning of July 18, becoming Tropical Storm Beryl six hours later while moving north, with maximum sustained winds of 35 kts and gusts to 45 kts. Beryl maintained this intensity through the following night before intensifying (Figure 3). Beryl attained peak intensity the next afternoon east of Cape Hatteras with maximum sustained winds 50 kts with gusts to 60 kts. The ship Auguste Oldendorff (A8HK4) (34N 72W) reported south winds of 30 kts at 0600 UTC on the 19th. The buoy 41001 (34.7N 72.7W) reported south winds 29 kts with gusts to 37 kts and 4.0 m seas (13 ft) at 1000 UTC July 19. At 0000 UTC July 20 the DSR Port Said (ELTY2) encountered east winds of 35 kts near 38N 72W. An aproaching cold front (Figure 3) turned Beryl toward the northeast late on the 20th, with the center passing near Nantucket early on the 21st. The buoy 44008 (40.5N 69.4W) reported southwest winds of 35 kts with peak gusts 49 kts and seas reaching 6.0 m (20 ft) at 0700 UTC July 21, the highest conditions reported during this event. Beryl weakened to an extratropical gale in the Gulf of Maine by the afternoon of the 21st, passed northeast of the island of Newfoundland on July 22, and then turned southeast, dissipating near the Azores on the 25th.
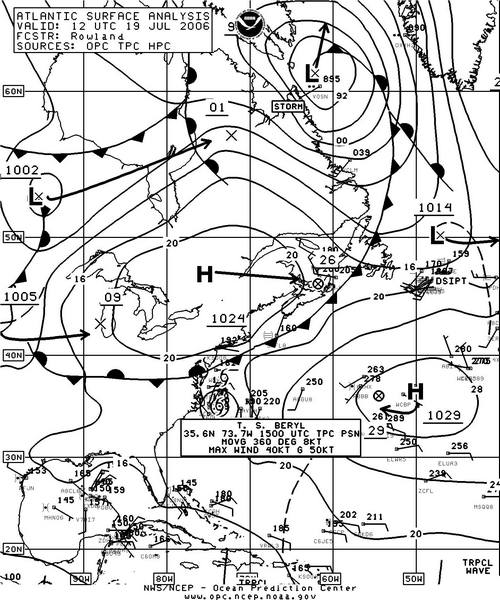
Figure 3. OPC North Atlantic Surface Analysis chart (Part 2) valid 1200 UTC July 19, 2006.
Tropical Depression Debby: Debby moved north into OPC’s high seas waters on the afternoon of August 27 as a weakening tropical depression, appearing in the first part of Figure 8 (see page 28) as the 1012 hPa low near 31N 49W. Maximum sustained winds were 25 kts with gusts to 35 kts. Debby became extratropical that evening and was absorbed by the frontal system to the northwest early on the 28th.
Tropical Storm Ernesto: Ernesto moved north into OPC’s far southwest offshore waters on the morning of August 31 with maximum sustained winds of 50 kts with gusts to 60 kts. The cyclone then approached hurricane strength before moving onshore near Cape Fear on the evening of August 31 (Figure 4). Some selected observations taken during passage of Ernesto on the 31st and on the following night are listed in Table 2.
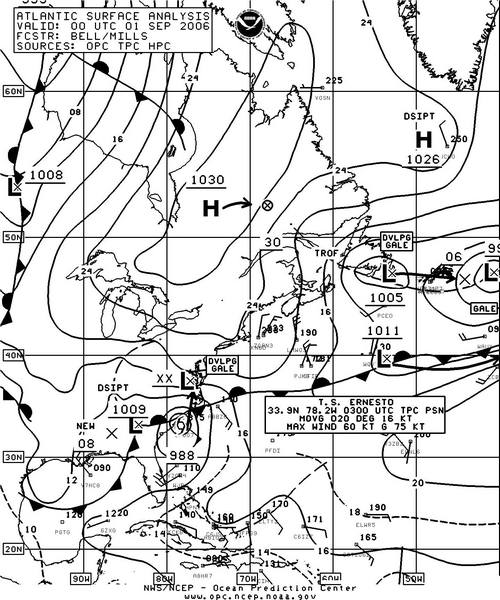
Figure 4. OPC North Atlantic Surface Analysis chart (Part 2) valid 0000 UTC September 1, 2006.
| OBSERVATION | POSITION | DATE/TIME(UTC) | WIND | SEAS(m/ft) |
|---|---|---|---|---|
| Maersk Vermont (WAUW) | 32.5N 76W | 31/2100 | SE 30 | 6.0/20 |
| British Trader (ZIPR7) | 36N 73.5W | 01/1200 | SE 50 | 5.0/17 |
| Buoy 41004 | 32.5N 79.1W | 31/2200 | NW 39 G49 | |
| 31/2300 | peak gust 54 | |||
| 31/1900 | maximum 4.0/13 | |||
| Buoy 41013 | 33.4N 77.7W | 01/0100 | SE 45 G56 | 6.5/21 |
| 01/0200 | peak gust 58 | |||
| Buoy 44014 | 36.6N 74.8W | 01/0200 | NE 29 G35 | 3.0/10 |
| 01/1900 | maximum 5.0/16 | |||
| Cape Lookout (CLKN7) | 34.6N 76.4W | 01/0700 | SE 38 G46 | |
| 01/0300 | peak gust 55 | |||
| Chesapeake Light (CHLV2) | 36.9N 75.6W | 01/0800 | E 42 G51 | |
| 01/1800 | peak gust SE 56 |
Table 2. Ship, buoy and coastal C/MAN station observations taken during passage of Tropical Storm Ernesto
Other Significant Events of the Period
Eastern North Atlantic Storm, May 1-3: The development of this intense low is shown in Figure 5, with much of the intensification occurring in the twenty-four hour period covered in the figure. The central pressure dropped an impressive 36 hPa during this period, the highest of the four-month period for any system in both the North Atlantic and North Pacific. The central pressure bottomed out at 966 hPa twelve hours later, making this cyclone the deepest of the period in both oceans. Winds reached storm force as revealed in the QuikScat image of Figure 6, up to 55 kts south of the center, in the absence of conventional observations. Although this system was deeper than the remains of Alberto, it was not as compact, had a larger circulation, and the winds were not as strong. The storm subsequently turned northwest on May 3 and began to weaken, becoming a gale near 61N 34W early on the 4th, and dissipating southeast of Greenland on the 5th.
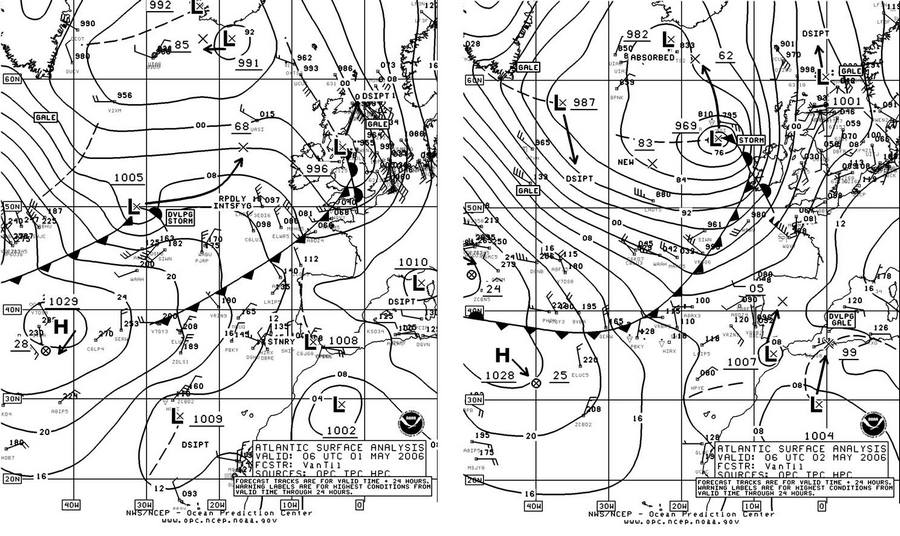
Figure 5. OPC North Atlantic Surface Analysis charts (Part 1 - east) valid 0600 UTC May 1 and 2, 2006.
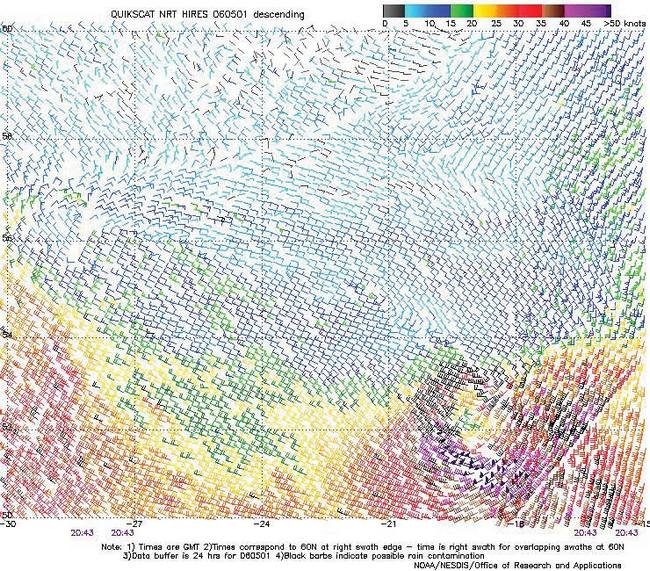
Figure 6. High-resolution QuikScat scatterometer image of satellite-sensed winds around the storm shown in Figure 5. The resolution is 12.5 km, versus 25 km in the coarser version of such imagery. The valid time of the pass is 2043 UTC May 1, 2006, or about nine hours prior to the valid time of the second part of Figure 5. The center of the storm’s circulation appears near 53N 19W in the lower right side of the image.
Image is courtesy of NOAA/NESDIS/Office of Research and Applications.
Eastern North Atlantic Storms, May 19-21: Two cyclones followed in close succession later in the month, with the stronger one being the second storm. The first originated near the Labrador coast early on May 17 and tracked east-southeast across the Atlantic, briefly intensifying to a 983 hPa storm-force low just west of the British Isles at 1200 UTC May 19. The first part of Figure 7 shows this system crossing the British Isles as a weakening gale, while the second system is over the central waters. The second part of Figure 7 shows the second storm at peak intensity west of France, with a ship Cap Nelson (A8EG8) with a northwest wind 55 kts plotted. The cyclone then weakened while crossing Great Britain on the 22nd, and passed inland over Norway early on May 23.
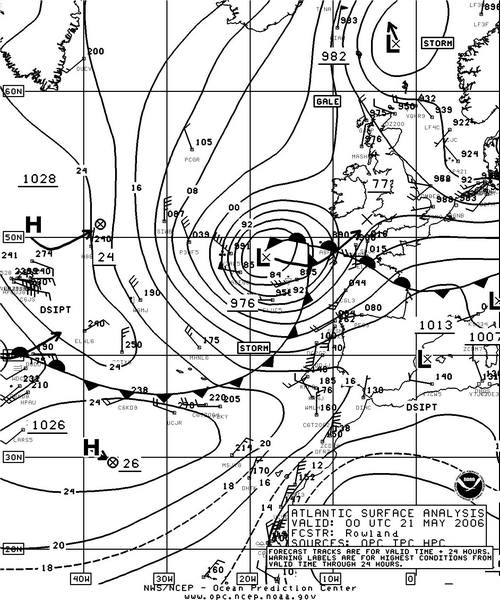
Figure 7. OPC North Atlantic Surface Analysis charts (Part 1) valid 0000 UTC May 20 and 21, 2006.
Eastern North Atlantic Storm, June 10-11: This storm originated as a frontal wave of low pressure southeast of Newfoundland late on June 7 and tracked east-northeast across the Atlantic, before turning more north off the coast of France with a double center on the 10th. The ship Emden (3ERP5) (46N 30W) encountered north winds of 40 kts and 6.5 m seas (22 ft) at 0600 UTC on June 9. The main center passed near 53N 19W with a 985 hPa central pressure at 1800 UTC June 10, when the Atlantic Compass (SKUN) reported a west wind of 60 kts. A high-resolution QuikScat pass two hours later showed winds mainly minimal storm-force on the southeast side of the center. The center deepened to 980 hPa while passing 400 nmi west of Ireland early on June 11, before beginning to weaken. The cyclone passed east of Iceland as a gale on the 13th.
Northeast Atlantic Storm, June 29: This was a cyclone of similar intensity to the one described in the preceding paragraph, originating as a frontal wave of low pressure near 52N 33W early on June 27. The developing cyclone then absorbed two other lows to the north and developed a central pressure down to 983 hPa about 250 nmi southwest of Iceland at 1800 UTC on the 29th. High-resolution scatterometer imagery was available in an area of sparse ship data nine hours prior to this, revealing several 50 kts wind barbs south of the storm center. The cyclone then weakened to a gale, passing across Iceland late on the 30th.
North Atlantic Storm, July 10-12: Subsequent significant low-pressure systems occurring in July affected mainly the far northern waters, with the progression of the season into mid-summer, usually the least active period of the year. The first one moved off the Labrador coast on July 9 and intensified to a storm near Cape Farewell twenty-four hours later. The vessel Bruarfoss (V2PS8) encountered southwest winds of 50 kts near 58N 34W at 0600 UTC on the 11th, while the storm center was passing 250 nmi to the north. High-resolution QuikScat data available near this time showed winds to 55 kts on the south side of the center, similar to Figure 6. The center developed a lowest central pressure of 977 hPa six hours later as it approached Iceland. The ship Vega (UHOM) reported west winds of 45 kts near 60N 29W at 1800 UTC July 11. At 1600 UTC July 12, after the weakening system had passed northeast of Iceland, the buoy 64046 (60.7N 4.7W) reported southwest winds of 25 kts and 7.5 m seas (25 ft).
Northwest Atlantic Storm of July 19-20: This short-lived event affected mainly the Davis Strait area. While Tropical Storm Beryl was off the U.S. coast, low pressure moved from Labrador north into the Davis Strait (Figure 3). Winds reached marginal storm strength off the west coast of Greenland on the 19th as revealed in high-resolution scatterometer data (not shown). The Irena Arctica (OXTS2) reported southeast winds of 40 kts near 61N 49W at 0000 UTC on the 20th. The system weakened while passing through the Davis Strait early on the 20th.
North Atantic Storm of July 26-27: A gale-force low moved northeast from the island of Newfoundland at 0600 UTC July 25 with much of the deepening (20 hPa) occurring in the first twenty-four hours. The cyclone developed a central pressure as low as 975 hPa near 58N 31W at 0600 UTC on the 27th, with the system stalling. The ship Gemma (UCFT) (57N 33W) encountered southwest winds of 50 kts twelve hours prior to this. QuikScat imagery also showed winds to 50 kts. The cyclone then began a southeastward drift and weakened to a gale on the 27th, before passing east across northern Great Britain by August 1.
North Atlantic Storm, August 27-29: This cyclone developed from a complex multi-centered weak low near 40N 52W at 0000 UTC August 27 and moved northeast, initially developing storm-force winds eighteen hours later as shown in the first part of Figure 8. The system then consolidated into a compact storm as shown in the second part of the figure. Table 3 lists reports from ships and oil platforms in the area. Although some of the oil platform reports are elevated and tend to report a bit high, especially in summer, available QuikScat data showed winds as high as 60 kts. The cyclone then continued to move northeast and began to weaken on the 29th, becoming a gale over the central North Atlantic by August 30.
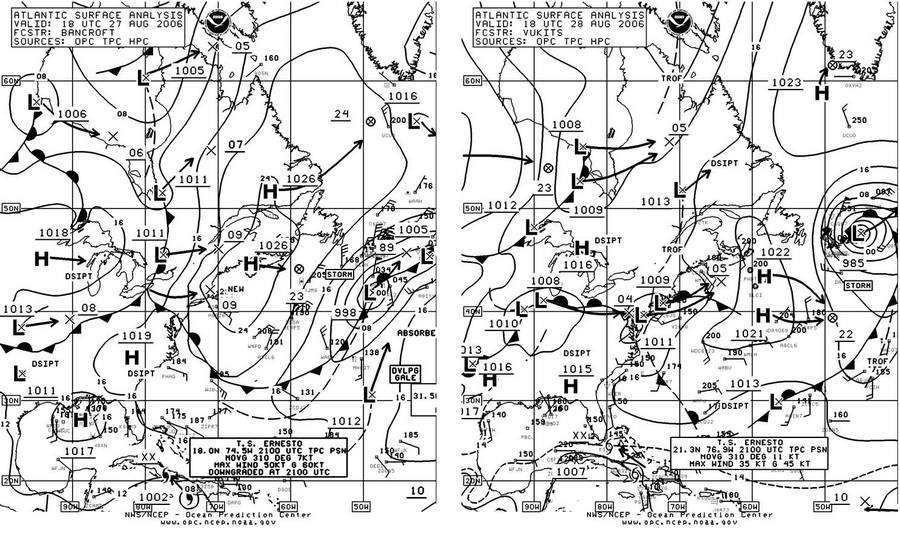
Figure 8. OPC North Atlantic Surface Analysis charts (Part 2) valid 1800 UTC August 27 and 28, 2006.
| OBSERVATION | POSITION | DATE/TIME(UTC) | WIND | SEAS(m/ft) |
|---|---|---|---|---|
| Bonn Express (DGNB) | 44N 48W | 27/2000 | NE 51 | |
| SHIP | 48N 48W | 28/1200 | N 50 | |
| Maersk Damascus (DAWC) | 44N 48W | 28/1800 | W 25 | 10.5/35 |
| Marseille Star (9HCH7) | 51N 44W | 28/1800 | NE 30 | 8.5/28 |
| Rowan Gorilla VI (WCZ6545) | 47N 48W | 28/2100 | NW 55 | |
| Platform (C6QE7)49.4N 48W | 28/1800 | N 60 | ||
| Platform (YJUF7) | 6.7N 48W | 28/1800 | W 62 | |
| 28/2100 | W 66 | |||
| Platform (VEP717) | 6.7N 48.7W | 8/2100 | W 55 | |
| 29/0600 | W 40. | 5/22 | ||
| Hibernia Platform (HP6038) | 6.4N 48.4W | 8/2100 | W 55 | |
| 29/0000 | W 55 |
Table 3. Selected observations from ships and Grand Banks oil platforms taken during the storm of August 27-29.
References
1. From Tropical Prediction Center website, http://www.nhc.noaa.gov/aboutsshs.shtml.
2. Sienkiewicz, J. and Chesneau, L., Mariner’s Guide to the 500-Mb Chart (Mariners Weather Log, Winter 1995).