Marine Weather Review North Pacific Area May to August 2009
By George P. Bancroft
NOAA National Center for Environmental Prediction/Ocean Prediction Center
Introduction
The weather pattern over the North Pacific during the period was predominantly progressive with developing cyclones originating mainly in the western North Pacific near Japan and moving toward the Gulf of Alaska. Few systems actually moved into the Bering Sea but some passed near the Aleutian Islands on their way toward the northeastern Pacific and therefore affected the Bering Sea with storm force or even hurricane force winds. There were some variations from this dominant pattern described in individual events below. During the stormy months of mid-winter to early spring gale and conditions are so prevalent that significant marine events described below mainly include hurricane force cyclones. As for numbers of such cyclones, after a peak of 7 cyclones in December 2009, there were 5 in January, 7 in February and 8 in March before falling to one in April. This is a variation from the findings of a study (Sienkiewicz and VonAhn) which found a peak in such activity in December in the North Pacific.
Tropical cyclones occur in the western North Pacific throughout the year, but the January to April period normally has less activity than in the other four month periods. There were no cyclones appearing on OPCs oceanic radiofacsimile charts during the period, but there was activity farther south.
Significant Events of the Period
North Pacific Storm, January 12-16: The first hurricane force cyclone of the period was also the most intense. After originating south of Japan late on January 11 the low moved northeast and rapidly intensified through 1200 UTC on the 13th. The central pressure dropped 38 hPa in the twenty-four hour period ending at 1200 UTC on the 13th when the cyclone was east of the Kurile Islands with a 956 hPa central pressure. The system then slowly intensified until reaching peak intensity with a 947 hPa. Figure 1 depicts development from an open wave over a thirty-six hour period with the second part of the figure showing the system near peak intensity. Figure 2 is an ASCAT image valid close to the time of the second part of Figure 1 showing a large area of 50 to 55 kts south of the cyclones center. Due to less sensitivity of the ASCAT instrument to higher wind speeds, if QuikSCAT were available it would show hurricane force winds, perhaps as high as 70 kts. Hurricane force winds lasted from late on the 12th until the afternoon of the 14th, almost forty-eight hours. Figure 3 is a Jason-2 radar altimeter pass through the southwest side of the storm when it was near maximum intensity. All the retrieved sea heights are higher than 30 ft (9 m) and the highest is 44 ft (13.5 m). Selected ship reports taken in this event are listed in Table 1. The cyclone then turned east and slowly weakened, passing just south of the Aleutians with top winds lowering to gale force late on the 16th. The slowly weakening system then stalled for three days in the southwest Gulf of Alaska before dissipating early on the 21st.
| Observation | Position | Date/Time (UTC) | Wind | Seas (m/ft) |
|---|---|---|---|---|
| APL Jade (9VVD) | 33N 15E | 12/1800 | S 45 | |
| Pine Arrow (C6NZ3) | 43N 147E | 13/0000 | N 45 | 7.5/25 |
| United Spirit (ELYB2) | 41N 143E | 13/1200 | W 45 | 6.0/20 |
| Star Dieppe (LEQZ3) | 51N 175E | 14/0900 | SE 45 | 8.0/26 |
| Polar Spirit | 53N 180W | 14/0900 | E 65 | |
| Horizon Anchorage (KGTX) SHIP |
53N 177E 53N 166E |
14/1900 15/0000 |
NE 50 N 40 |
8.5/28 |
| Lt Cort |
40N 165E |
15/0200 15/0600 |
NW 45 W 40 |
7.0/23 9.0/30 |
| Sea-Land Lightning | 54N 170E | 15/0600 | NE 40 | 10.0/32 |
| Buoy 46035 | 57.1N 177.8W | 15/0600 | 9.0/29 |
Northeastern Pacific Storm, January 17-19: Figure 4 shows one of three lows moving along 41N to 42N, the middle one, intensifying into a hurricane force low over a twenty-four hour period. The cyclone briefly developed hurricane force winds 1800 UTC January 18 based on appearance of 50 kts winds in 25 km ASCAT imagery (Figure 5), before the system turned abruptly north. Some notable ship and buoy observations taken during passage of the cyclone are listed in Table 2. The cyclones top winds diminished rapidly as it turned north along 130W, lowering to gale force early the next day and then maintaining such winds until dissipation in the eastern Gulf of Alaska early on the 21st.
| Observation | Position | Date/Time (UTC) | Wind | Seas (m/ft) |
|---|---|---|---|---|
| Maersk Dieppe(A8IY2) SHIP |
34N 127W 32N 131W |
18/1800 18/1200 |
S 35 W 45 |
8.5/28 |
| Buoy 46023 |
34.7N 121W |
19/1600 19/1300 |
SE 35 G47 |
7.5/25 max 8.5/28 |
| Buoy 46014 |
39.2N 124W |
19/1200 |
S 37 G45 Peak gust 51 |
8.0/27 |
| Buoy 46022 |
40.7N 124.6W |
19/1100 19/0900 19/1000 |
S 37 G47 Peak gust 51 |
8.5/28 |
| Buoy 46050 |
44.6N 124.5W |
19/0800 19/1000 |
S 39 G49 Peak gust 52 |
5.0/16 max 7.0/23 |
Northwestern Pacific Storm, January 19-20: This event was the only one of its kind to affect this part of the Pacific during the period with its hurricane force winds confined to the Sea of Okhotsk. Low pressure moved from over land northeast into the Sea of Okhotsk early on the 19th and rapidly intensified. The central pressure fell 31 hPa in the twenty-four hour period ending at 1800 UTC on the 20th. Figure 6 shows the final twenty-four hour period of development with the cyclone at maximum intensity in the second part of Figure 6. The ASCAT image in Figure 7 close to the valid time of the second part of Figure 6 reveals northwest winds to 55 kts in a limited area that was not ice covered, strongly indicative of hurricane force conditions. The cyclone subsequently drifted northeast with its top winds weakening to gale force eighteen hours later, and then dissipated near the Kamchatka Peninsula late on the 22nd.
Eastern North Pacific Storm of January 22-25: As the storm over the southern waters near the dateline (second part of Figure 6) moved northeast and occluded it spawned a redevelopment on the front near 37N 165W at 0600 UTC on the 22nd . The new cyclone developed into a 961 hPa hurricane force low forty-eight hours later when the center passed near 43N 144W. The central pressure dropped 24 hPa in the twenty-four hour period ending at 1800 UTC on the 23rd. An ASCAT image at 1915 UTC on the 23rd showed a compact circulation around the low with a 50 kts retrieval southwest of the center even in the lower resolution 50 km image. The cyclone then weakened to a storm force low as it passed just west of the Washington and Oregon offshore waters on the 24th. The buoy 46015 (42.7N 124.8W) reported south winds of 39 kts with gusts to 49 kts and 5.0 m seas (16 ft) at 1800 UTC on the 24th, with seas highest two hours later at 6.0 m (20 ft). To the north the buoy 46207 (50.9N 129.9W) reported at 2000 UTC on the 24th a southeast wind of 45 kts with gusts to 60 kts and 9.0 m seas (30 ft), followed one hour later by a report of maximum seas 10.0 m (33 ft). The cyclone subsequently turned northwest into the Gulf of Alaska on the 25th and 26th where it dissipated late on the 26th.
North Pacific Storm, January 24-26: This low originated near Japan on January 22 and tracked east to the central waters through the 24th before turning northeast while gradually intensifying. The cyclone developed a lowest central pressure of 960 hPa when the center passed near 40N 170W at 0000 UTC on the 26th and also briefly attained hurricane force strength at that time. There were no ships reporting storm force or greater winds. A vessel reporting with the SHIP callsign (28N 174E) encountered west winds of 45 kts and 6.0 m seas 19 ft) at 0300 UTC on the 25th. Gradual weakening followed as the cyclone drifted northeast into the eastern Pacific well west of Vancouver Island with its top winds lowering to gale force late on the 26th and to below gale force on the 28th. Dissipation followed on January 29th.
Western North Pacific Storm, February 1-3: This cyclone originated as a frontal wave of low pressure just south of Japan as February began and moved northeast over the next thirty-six hours, developing hurricane force winds at the same time its central pressure dropped to as low as 968 hPa, when the center passed near 43N 162E at 1200 UTC February 2. The central pressure dropped 29 hPa in the twenty-four hour period ending at 0600 UTC on the 2nd. Hurricane force winds occurred mainly on the 2nd with a 50 km ASCAT pass from 2232 UTC February 2 revealed a compact low pressure circulation with west winds of 50 kts south of the center. The cyclone then gradually weakened as it moved northeast and then southeast late on the 3rd, with dissipation occurring south of the eastern Aleutians February 4.
North Pacific Storm, February 5-9: This cyclone originated from a complex of weak low pressure centers east of Japan on February 5 with a main low center emerging late on the 6th and tracking northeast. The system became a large storm with a central pressure as low as 951 hPa as it stalled near 47N 180W at 0600 UTC on the 8th. The central pressure fell by 23 hPa during the preceding twenty-four hour period. OPC briefly analyzed this system as a hurricane force low at 1800 UTC on the 7th as the occluded front moving north of the low became the main focus for such winds in a pattern similar to that of Figure 11. The cyclone resumed northeastward motion by the 9th and weakened to a gale just south of the eastern Aleutians late on the 9th. It then turned northwestward into the Bering Sea by the 11th and dissipated on the 12th.
| Observation | Position | Date/Time (UTC) | Wind | Seas (m/ft) |
|---|---|---|---|---|
| Maunawili (WGEB) |
44N 141W 43N 138W |
13/0000 13/0600 |
S 50 SW 50 |
|
| Hanjin Brussels (DIGW) |
44N 138W |
13/0000 |
SW 50 |
8.5/28 |
| Chirikana (3EKU3) |
52N 150W |
13/1200 |
N 50 |
|
| Buoy 46004 | 50.9N 136W | 14/0200 | S 35 | 9.0/30 |
| Buoy 46208 |
52.5N 132.8W |
13/1500 14/0500 |
SE 35 maximum |
7.5/24 9.0/30 |
| Buoy 46207 |
50.9N 129.9W |
13/1500 13/1700 |
SE 40 maximum |
7.5/24 8.0/26 |
Eastern North Pacific Storms, February 10-14: Figure 8 shows two hurricane force systems that developed in close succession during this period. The first part of Figure 8 shows the first cyclone at maximum intensity. It originated as a secondary development on a front associated with a parent low moving east from Japan early on the 9th. Hurricane force winds with this low occurred mainly on the 11th with a 50 km ASCAT pass for 1929 UTC February 11 revealing winds to 50 kts on the south side. The system then weakened while turning north toward the Gulf of Alaska on the 12th and dissipated later on that day. The stronger second hurricane force low originated as a multicentered complex near the Kurile Islands on the 10th which later consolidated and rapidly deepened. It is shown with a lowest central pressure of 952 hPa in the second part of Figure 8. The central pressure dropped by an impressive 34 hPa in the preceding twenty-four hour period. ASCAT imagery from two passes on the 12th reveals winds to 55 kts on the south and southwest sides of the low and there is even a 60 kts wind retrieval. The system then turned north into the Gulf of Alaska with a gradual weakening trend, becoming a gale near Kodiak Island late on February 14 and then dissipating in Bristol Bay late on the 15th. Some notable ship and buoy observations taken mainly in the second storm are listed in Table 3.
Northwest pacific and Bering Sea Storm, February 15-18: The development of this intense system is depicted in Figure 10. Originating south of Japan on February 14, the cyclone rapidly intensified after passing east of Japan with the central pressure falling by 29 hPa in the twenty-four hour period ending at 1200 UTC on the 17th. The center developed a lowst central pressure of 954 hPa six hours later. The 25 km ASCAT passes in Figure 11 (mainly the western pass) show strongest winds in the easterly flow ahead of the occluded front and there are some 50 kts barbs on the south side in the westerly flow. The cyclone then drifted into the western Bering Sea and weakened to a gale late on the 18th. The slowly weakening system then drifted northwest over the next four days and dissipated on the 22nd. The MSC Texas (DCSY2) near 45N 158E reported northwest winds of 45 kts and 9.0 m seas (30 ft) at 0000 UTC on the 17th. Also at this time the Horizon Hunter (WDD6038) near 44N 176E encountered south winds of 55 kts and 7.0 m seas (23 ft). The Marie Maersk (OULL2) near 39N 176E reported a south wind of 45 kts and 8.0 m seas (26 ft) at 0000 UTC on the 17th.
North Pacific Storm, February 18-21: The track of this low extended from near southern Japan early on the 17th to south of the central Aleutian Islands near 45N early on the 20th where it developed hurricane force conditions and a lowest central pressure of 972 hPa late on the 19th. The Nikkei Tiger (3FMH7) near 35N 156E reported west winds of 45 kts and 6.5 m seas (22 ft) at 0600 UTC on the 19th. A high-resolution ASCAT pass from 2121 UTC on the 20th at the time of maximum intensity showed northwest winds to 50 kts south and southwest of the low center. The cyclone then tracked east near 45N and weakened to a gale force low late on the 21st and then, upon reaching 150W becoming absorbed by a gale to the north on the 22nd.
North Pacific Storm, February 25-28: This cyclone developed explosively from an elongated complex of gale force lows over the central waters during a twenty-four hour period ending at 1800 UTC February 26 as depicted by Figure 12. Taking the middle low as the main low, its central pressure dropped 41 hPa during this period. The second part of Figure 12 shows the cyclone near maximum intensity, with the lowest pressure of 950 hPa occurring six hours later. The large circulation shows up in ASCAT imagery as a large area of 35 kts or greater winds with 50 kts retrievals south and southwest of the well defined center (Figure 13). Hurricane force winds with this system occurred mainly on the 26th and during the following night. Afterwards the cyclone moved slowly northeast and then north into the Gulf of Alaska with winds dropping to gale force as March began, and dissipated near Kodiak Island March 2. Some notable ship and buoy observations taken in this storm are listed in Table 4.
Figure 1. OPC North Pacific Surface Analysis charts valid 1200 UTC January 12 and 0000 UTC January 14, 2010.
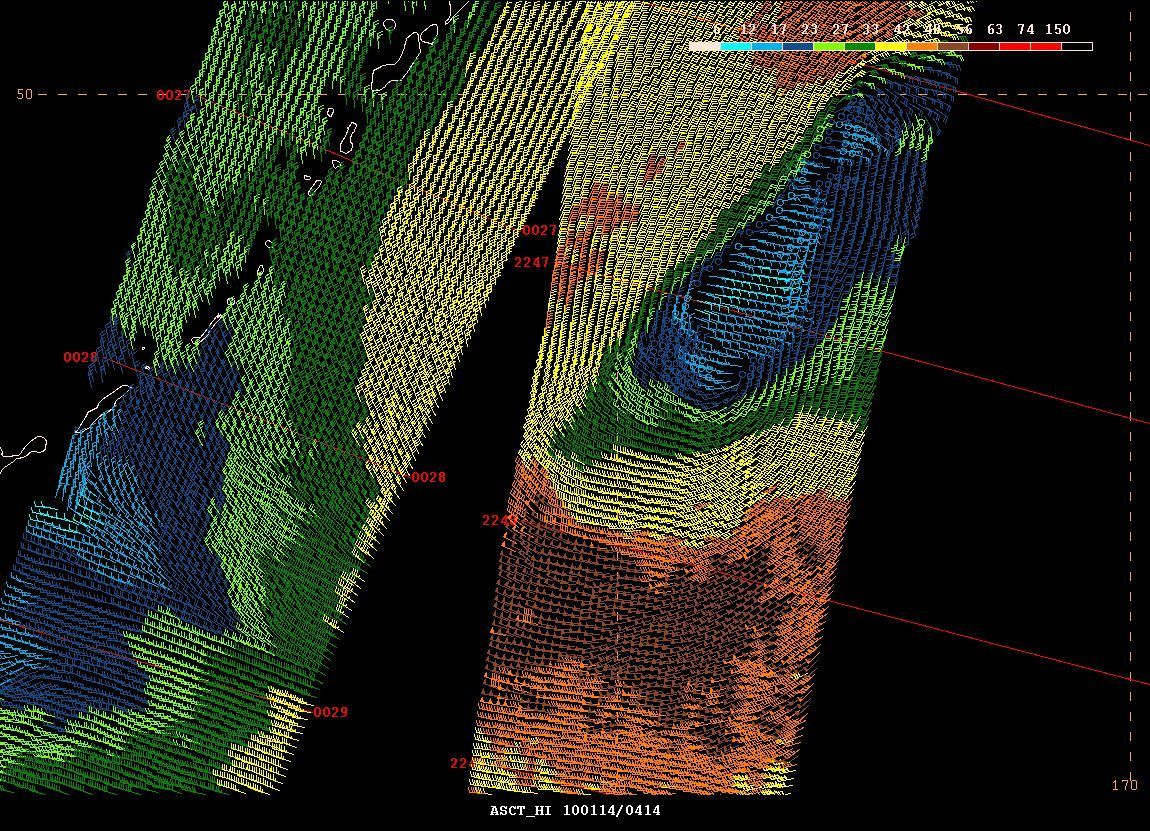
Figure 2. High-resolution ASCAT (Advanced Scatterometer) image of satellite-sensed winds around the south and west sides of the hurricane force low shown in the second part of Figure 1. The resolution is 25 km, versus 50 km in the coarser-resolution version of ASCAT imagery. The valid time of the eastern pass is 2248 UTC January 13 and for the western pass 0028 UTC January 14, 2010. The center of the storm was near 46N 161E at that time, near the center of the image. The Kurile Islands appear on the left side of the image.
| Observation | Position | Date/Time (UTC) | Wind | Seas (m/ft) |
|---|---|---|---|---|
| SHIP | 48N 172W | 26/0600 | NE 55 | 5.5/18 |
| SHIP | 46N 175W | 27/0600 | 14.0/46 | |
| Zim Savannah(A8ER9) | 54N 165W | 27/1900 | N 75 | |
| Marguerite Ace(ZGAD3) | 54N 160W | 28/0600 | NW 50 | |
| Oscar Dyson (AWS) (NWS0001) |
55N 161W |
28/0700 |
NW 55 |
|
| APL Sweden(A8JX8) | 55N 155W | 28/1800 | NW 45 | 8.5/28 |
| Buoy 46075 |
53.9N 160.8W |
27/1300 28/0100 |
NE 40 maximum |
4.0/12 6.5/21 |
| Buoy 46147 | 51.8N 131.2W | 01/1000 | SE 35 G47 | 9.0/30 |
| Buoy 46207 | 50.9N 129.9W | 01/0600 | S 37 G49 | 7.0/23 |
| Buoy 46183 | 53.6N 131.1W | 01/1100 | SE 39 G52 | 6.5/21 |
| Buoy 46185 |
52.4N 129.8W |
01/0700 01/1200 |
SE 37 G47 maximum |
6.5/21 7.0/23 |
North Pacific and Bering Sea Storm, March 1-3: A weak low pressure wave passed south of Japan early on February 27 and moved northeast, not beginning rapid intensification until late on February 28. The central pressure dropped 29 hPa in the twenty-four hour period ending at 0000 UTC March 2 with hurricane force winds developing. Six hours later the cyclone developed a lowest central pressure of 956 hPa near 53N 179W (in the southern Bering Sea). A 25 km ASCAT pass from 2311 UTC March 1 showed the strongest winds as westerlies to 55 kts south of the center, and about ten hours later another pass showed 50 kts easterlies in the Bering Sea north of the occluded front. The cyclone then turned eastward and crossed over into the North Pacific and passed near Kodiak Island early on the 3rd with winds diminishing to gale force. The low dissipated over the Kenai Peninsula on the 4th. A list of observations from ships and buoys taken during the event is in Table 5..
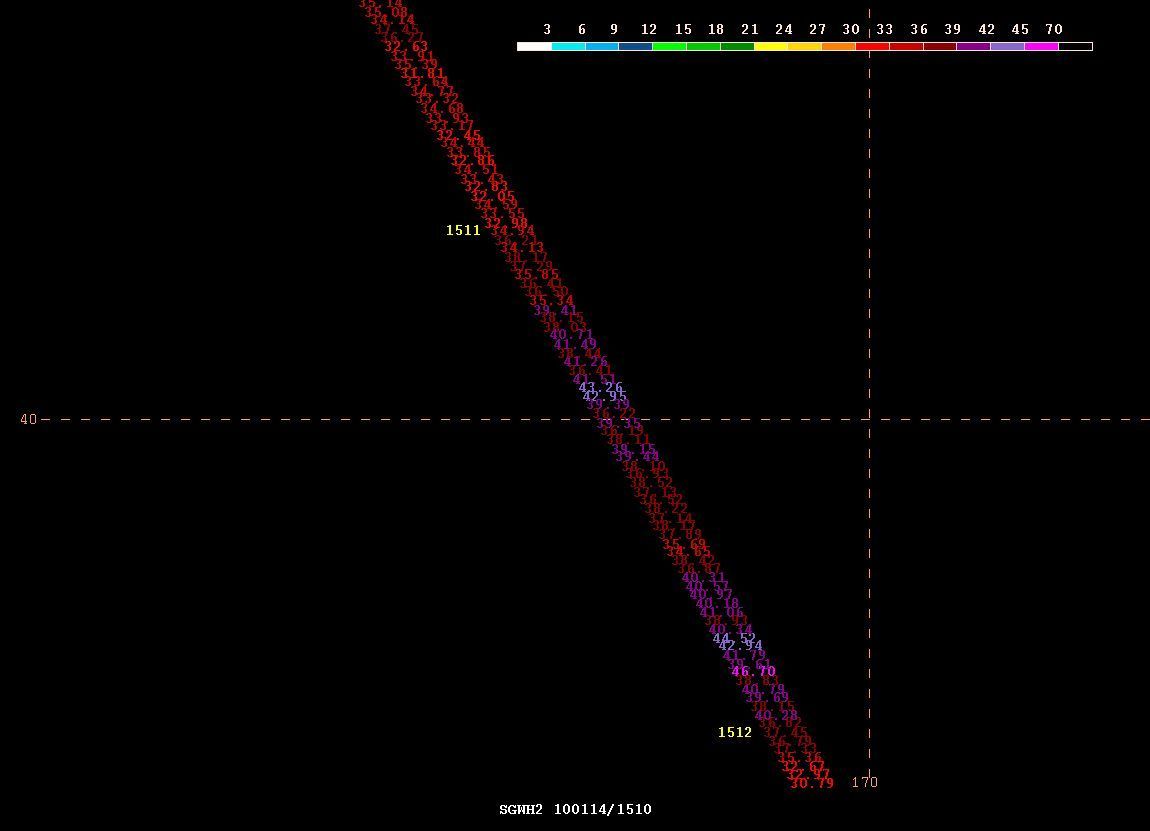
Figure 3. Jason-2 satellite altimeter pass from approximately 1511 UTC January 14, 2010. The satellite track cuts through the storm in a northwest to southeast direction about fifteen hours later than the valid time of Figure 1. The image shows a swath of observed wave heights (feet) along the track of the satellite. The four-digit numbers to the left of the track are times (UTC) that the satellite passes over.
Figure 4. OPC North Pacific Surface Analysis charts valid 1800 UTC January 17 and 18, 2010.
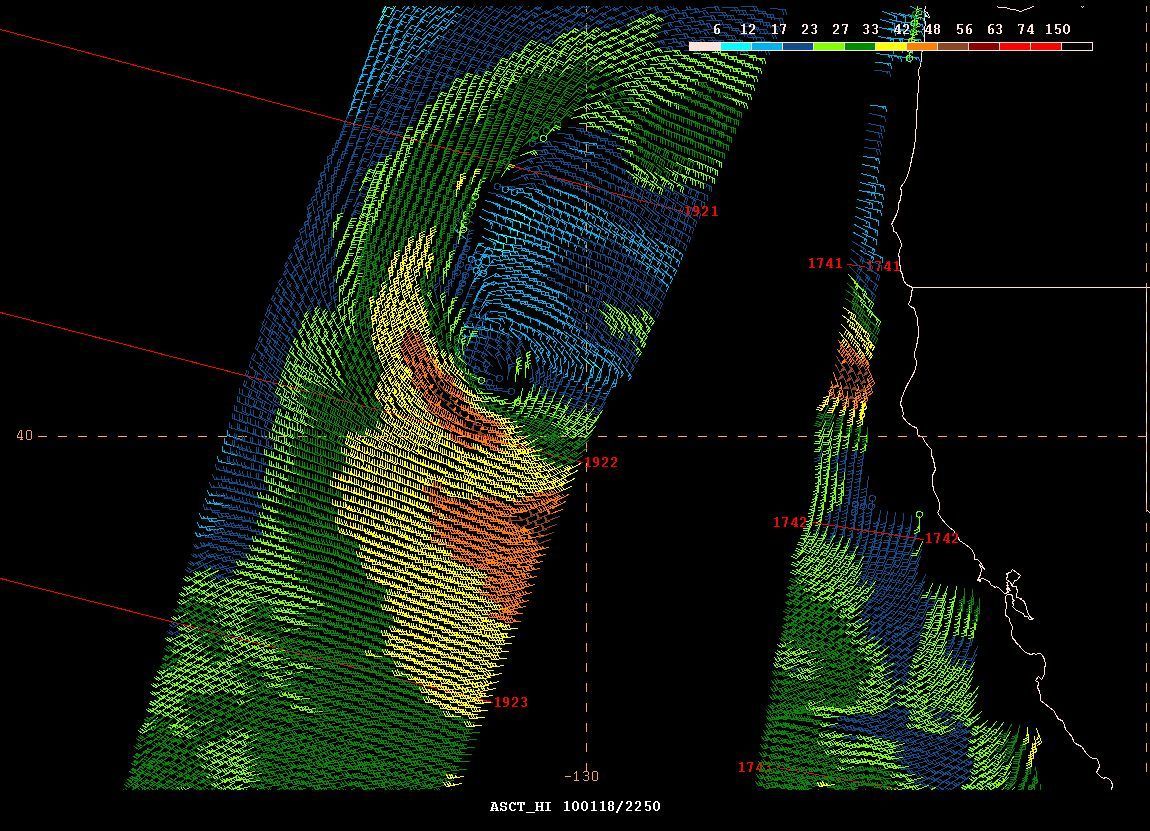
Figure 5. High resolution ASCAT scatterometer image of satellite sensed winds around the hurricane force low shown in the second part of Figure 4. The valid time of the eastern pass is 1742 UTC and for the western pass 1922 UTC January 18, 2010. The cyclone appears with a well defined circulation center near the center of the image. This version of the imagery is adapted for OPC operational use and includes cross-track time lines of the satellite with times in UTC.
| Observation | Position | Date/Time (UTC) | Wind | Seas (m/ft) |
|---|---|---|---|---|
| Mb Leer (DPBJ) | 34N 140E | 28/0300 | N 45 | |
| Sea-Land Comet(WDB9950) | 38N 158E | 28/0600 | SW 45 | 8.0/27 |
| SHIP | 53N 176E | 01/2000 | NE 45 | 8.5/28 |
| SHIP | 56N 168W | 03/0000 | N 50 | 4.5/15 |
| APL Korea(WCX8883) | 55N 158W | 03/0300 | SW 45 | 8.5/28 |
| Buoy 46073 |
55N 172W |
02/0700 02/0800 |
E 45 maximum |
5.5/18 6.0/19 |
| Buoy 46035 | 57.1N 177.8W | 02/1500 | maximum | 7.5/25 |
| Buoy 46075 |
53.9N 160.8W |
03/1000 03/0800 |
NW 41 G54 maximum |
13.0/43 14.0/46 |
| Buoy 46066 | 52.7N 154.9W | 03/1600 | maximum | 11.5/37 |
North Pacific Storm, March 6-9: The origin of this cyclone is again a frontal wave of low pressure passing just south of Japan early on March 1. It at first slowly developed and did not begin rapid intensification until March 3 when the central pressure fell 39 hPa in the twenty-four hour period ending at 1800 UTC March 4, when the center passed near 50N 174W with a 958 hPa central pressure. Six hours later the central pressure reached as low as 956 hPa. OPC classified the cyclone as a hurricane force low from early on the 4th until the morning of the 5th. A high resolution ASCAT pass for 0957 UTC March 4 revealed partial coverage of west winds to 50 kts on the south side of the cyclone. The cyclone center stayed south of the Bering Sea and moved along the south coast of Alaska, and after passing Kodiak Island it weakened well inland on the 6th. The APL Korea (WCX8883) near 55N 173W at 0800 UTC on the 5th reported northwest winds of 45 kts. The buoy 46073 (55N 172W) reported north winds of 40 kts and 5.0 m seas (17 ft) at 0400 UTC on the 5th. The buoy 46075 (53.9N 160.8W) reported southeast winds of 45 kts and 4.5 m seas (14 ft) at 0000 UTC March 5 followed sixteen hours later by a report of northwest winds of 35 kts and 9.5 m seas (31 ft). The buoy 46001(56.3N 148W) reported at 2100 UTC on the 5th with a southwest wind 35 kts and 6.5 m seas (22 ft) and five hours later with seas of 10.0 m (32 ft). The C/MAN station Augustine Island (AUGA2, 59.4N 153.3W) reported northeast winds of 50 kts at 1500 UTC March 5.
North Pacific Storm, March 6-9: This event, except for its farther north origin east of northern Japan on March 5, followed a track similar to that of its predecessor. Figure 14 depicts development over a thirty-six hour period starting with the 992 hPa cyclone near 50N 175W. It underwent slower development, not peaking in intensity until reaching Prince William Sound, AK with a 961 hPa central pressure at 0600 UTC March 9. The main focus for hurricane force winds in this event was the occluded front approaching the south coast of mainland Alaska mainly on the morning of the 8th. The most notable ship, buoy and coastal C/MAN observations taken in this event are listed in Table 6. The cyclone then moved well inland and weakened late on the 9th.
Figure 6. OPC North Pacific Surface Analysis charts valid 0000 UTC January 20 and 21, 2010.
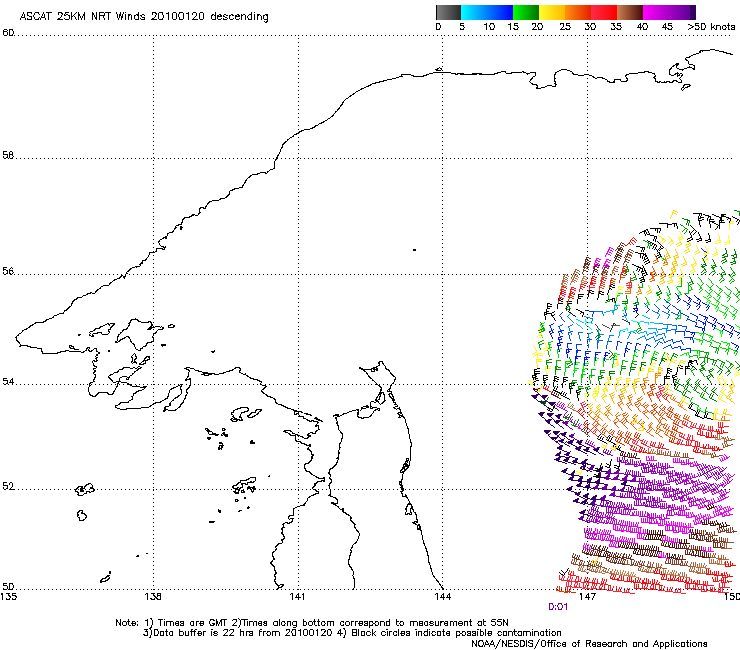
Figure 7. High resolution ASCAT scatterometer image of satellite sensed winds around the west side of the hurricane force low depicted in the second part of Figure 6. The valid time of the pass is 0001 UTC January 21, 2010. The storm center is near the eastern edge of the image. Image is courtesy of NOAA/NESDIS/ Center for Satellite Application and Research.
| Observation | Position | Date/Time (UTC) | Wind | Seas (m/ft) |
|---|---|---|---|---|
| Leo Forest (3FPH8) | 34N 140E | 28/0300 | N 45 | 8.5/28 |
| Maersk Dallas (A8EH5) | 43N 152W | 08/1200 | SW 45 | 7.5/25 |
| Sea Prince (WYT8569) | 59.5N 149.5W | 08/1500 | NE 55 | |
| Attentive (WCZ7337) | 60N 146W | 08/1800 | E 65 | |
| Buoy 46082 |
59.7N 143.4W |
08/1800 08/1900 08/2100 |
E 49 G58 Peak gust 62 maximum |
9.0/30 |
| Buoy 46085 |
55.9N 142.6W |
08/1200 08/2100 |
S 35 G43 maximum |
4.5/15 7.0/23 |
| Buoy 46061 |
60.2N 146.8W |
08/1700 08/2000 |
E 47 G64 |
5.0/16 6.0/20 |
| Buoy 46085 |
54.2N 134.3W |
09/0600 09/0900 |
SE 41 G54 maximum |
8.5/28 10.0/33 |
| Buoy 46208 |
52.5N 132.7W |
09/1000 09/1100 |
SE 41 G51 maximum |
9.0/305 10.0/33 |
| Buoy 46185 |
52.4N 129.8W |
09/1600 09/1800 |
SE 41 G52 maximum |
8.0/27 8.5/28 |
| Augustine Island(AUGA2) | 59.4N 153.3W | 08/1400 | NE 57 G65 |
Northeastern Pacific Storm, March 9-11: The development of this cyclone is shown in Figure 15 as the new storm was gathering strength while the preceding event was winding down over southern Alaska. It had origins as a weak frontal wave of low pressure out near 37N 163E early on March 8. The central pressure dropped 33 hPa in the twenty-four hour period ending at 1200 UTC on the 10th. The second part of Figure 15 shows the cyclone at maximum intensity. Hurricane force conditions are indicated from looking at the list of reports of high winds and seas in Table 7. The system subsequently began weakening rapidly late on the 11th while moving north and then passing well inland over northwest Canada by the 12th.
Figure 8. OPC North Pacific Surface Analysis charts valid 0000 UTC February 12 and 13, 2010.
| Observation | Position | Date/Time (UTC) | Wind | Seas (m/ft) |
|---|---|---|---|---|
| Sea-Land Intrepid (WDB9949) | 50N 151W | 10/0900 | N 55 | |
| Alaskan Navigator(WDC6644) | 49N 135W | 10/2300 | SW 60 | 7.5/25 |
| Seabulk Arctic(WCY7054) | 53N 139W | 11/1200 | NW 66 | 12.5/41 |
| Sea-Land Lightning(WDB9986) | 45N 154W | 11/1200 | NW 45 | 8.0/26 |
| Midnight Sun (WAHG) | 54N 143W | 11/0300 | N 60 | 4.5/15 |
| S/R American Progress(KAWM) | 50N 132W | 11/0400 | SW 50 | 13.0/42 |
| Buoy 46208 |
52.5N 132.7W |
10/2200 11/1000 |
SE 45 G58 maximum |
7.5/25 12.5/41 |
| Buoy 46147 |
51.8N 131.2W |
10/2300 11/1400 |
SE 45 G56 maximum |
8.0/27 12.5/41 |
| Buoy 46004 |
50.9N 136.1W |
11/0800 11/0900 |
W 47 G60 maximum |
9.0/30 11.0/36 |
| Buoy 46207 |
50.9N 129.9W |
11/0000 11/1000 |
S 47 G58 maximum |
8.0/27 11.0/36 |
| Buoy 46183 |
53.6N 131.1W |
11/0300 11/0400 |
SE 51 G66 |
8.5/28 |
| Buoy 46036 |
48.4N 133.9W |
11/0100 11/0600 |
SW 41 G52 maximum |
8.5/28 11.5/38 |
| Buoy 46029 |
46.1N 124.5W |
11/1400 11/2300 |
S 35 G45 maximum |
6.5/21 7.5/25 |
North Pacific Storm, March 9-14: This event consists of two parts: the parent cyclone crossing the North Pacific from Japan and the secondary low and front in the Gulf of Alaska. Figure 16 depicts the strong cyclone in the western Pacific which originated just south of Japan early on the 9th and the second part of Figure 16 shows the same cyclone which increased in size and formed a secondary low and front to the northeast. Figure 17 is a 25 km ASCAT pass from 2329 UTC March 10 revealing a few 50 kts wind barbs on the south side of the cyclones center indicating that winds for a time approached hurricane force with this system. The highest wind reported by a ship with passage of the main low was a west wind of 45 kts from the LNG Leo (V7BX2) near 31N 134E at 0300 UTC on the 10th. The Horizon Kodiak (KGTZ) encountered 9.0 m seas (30 ft) along with northwest winds of 40 kts near 53N 155W at 1800 UTC on the 14th. With the secondary cyclone in the Gulf of Alaska the front became the focus for hurricane force winds until the front moved onshore late on the 14th. The buoy 46185 (52.4N 129.8W) reported southeast winds of 43 kts with gusts to 58 kts and seas 9.0 m (30 ft) at 1000 UTC on the 14th and maximum seas 10.5 m (34 ft) seven hours later. A 25 km ASCAT pass from 0449 UTC on the 14th showed enhanced southeast flow with a few 50 kts winds between the Queen Charlotte Islands and Vancouver Island. The secondary cyclone associated with the front remained nearly stationary and dissipated three days later while the parent low to the south was absorbed.
North Pacific Storms, March 25-27: Two hurricane force events of similar intensity occurred almost simultaneously in late March. The eastern cyclone in Figure 18 originated in the Sea of Japan on March 22 and followed an east-northeastward track. The central pressure dropped 32 hPa in the twenty-four hour period ending at 1200 UTC on the 25th. The ship A8OI5 (52N 144W) reported southwest winds of 45 kts at 1200 UTC on the 26th. Although the central pressure continued to drop slowly the winds weakened to gale force as the cyclone drifted toward Kodiak Island and was down to 962 hPa just before becoming absorbed by another system to the south on the 28th. The western system in Figure 18 originated just south of Japan early on March 24 and developed hurricane force winds six hours later along with a central pressure of 968 hPa. The 25 km ASCAT image for 1042 UTC March 26 in Figure 19 reveals winds to 55 kts south of the low center. The Overseas Joyce (V7NV4) near 34N 146E reported northeast winds of 50 kts and 8.5 m seas (28 ft) at 1200 UTC on the 25th. The western system subsequently tracked east along 50N to south of the Alaska Peninsula late on March 27 and maintained central pressures in the upper 960s before becoming absorbed by a new cyclone to the east early on the 28th.
North Pacific and Bering Sea Storm, March 29 to April 2: A frontal wave of low pressure down near 19N 133E well south of Japan lingered in that area on March 26 and 27 and may have ingested the remains of Tropical Depression Omais coming from east of the Philippines. The cyclone accelerated northeast beginning on the 28th and moved to the eastern Aleutians by months end where it briefly developed hurricane force conditions. The ship VRCI9 (46N 175W) encountered southwest winds of 60 kts and 6.5 m seas (21 ft) at 0000 UTC on the 31st while the cyclone center was to the northwest near 49N 179W with a 963 hPa center, near maximum intensity. An ASCAT pass from 0921 UTC March 30 revealed west to southwest winds to 50 kts on the south side of a rather compact circulation. The system then began a weakening trend while continuing to move northeast, until it slowed down in the Gulf of Alaska early in April with its winds weakening to gale force April 2 and to below gale force by the 4th. The cyclone dissipated near the Kenai Peninsula on the 6th as a new hurricane force system was developing in the western North Pacific, described below.
North Pacific Storm, April 5-8: The initial development of this cyclone is shown in Figure 20. The high resolution ASCAT pass from 1011 UTC April 6 (Figure 21) reveals a compact system with winds 50 to 55 kts around the south and west sides, strongly indicative of hurricane force conditions. The cyclone intensified further in the next eighteen hours, with the pressure dropping to as low as 972 hPa. The central pressure dropped 27 hPa in the twenty-four hour period ending at 1800 UTC April 6. The CCNI Vancouver (V7CG7) near 36N 158E encountered southwest winds of 40 kts and 10.0 m seas (32 ft) at 1500 UTC on the 6th. Hurricane force winds with this system lasted from early on the 6th until early on the 7th, about twenty-four hours. The cyclone subsequently weakened while turning eastward along 49N and its top winds lowered to gale force south of the Gulf of Alaska early on the 8th. The low then turned south along 140W on the 10th and dissipated as a new gale formed to the south off California.
Western North Pacific and Bering Sea Storm, April 8-10: This cyclone formed from the merger of two low pressure systems as depicted in Figure 22 and became within a forty-eight hour period the most intense cyclone (in terms of central pressure) of April. The second part of Figure 22 shows the cyclone near maximum intensity in the Bering Sea. The Gerd Maersk (OYGM2) near 36N 174E reported south winds of 55 kts at 0000 UTC on the 9th. Six hours later the Star Hidra (LAVN4) encountered east winds of 40 kts and 9.0 m seas (30 ft) near 57N 179E. Buoy 46035 (57.1N 177.8W) reported east winds of 40 kts and 5.5 m seas (18 ft) at 1000 UTC on the 9th, and maximum seas 7.5 m (25 ft) twenty-four hours later. The cyclone began weakening early on the 10th while moving north-northeast, and dissipated in the northern Bering Sea by the 12th.
North Pacific Storm, April 17-19: This cyclone followed a track similar to that of the April 5-8 storm except when passing into the eastern North Pacific it continued on a northeastward track until passing inland over western Alaska on the 21st. It originated as a frontal wave of low pressure just south of Japan early on April 16 and intensified into a storm late on the 17th. A 25 km ASCAT pass from 1106 UTC April 18 revealed several 50 kts north wind barbs on the edge of the pass. This could indicate the system had winds near hurricane force at a time that its compact appearance on surface analyses was similar to that of the April 5-8 event. At 2000 UTC April 18 the Senang Spirit (C6ME8) reported northwest winds of 50 kts and 11.5 m seas (37 ft). The cyclone developed a lowest central pressure of 974 hPa the next day at 1800 UTC near 49N 178E. Weakening occurred thereafter and the top winds diminished to gale force as the center passed near the eastern Aleutian Islands early on the 20th.
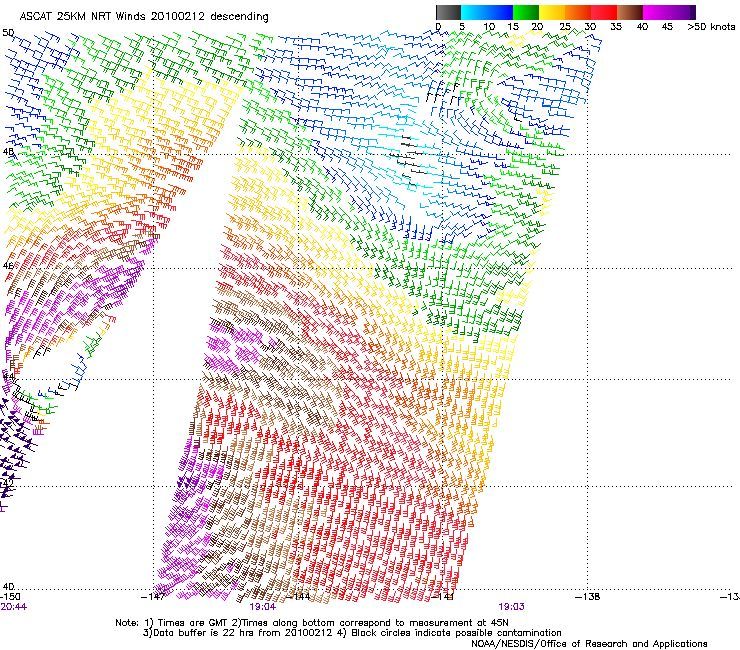
Figure 9. High resolution ASCAT scatterometer image of satellite sensed winds around the hurricane force low shown in the second part of Figure 8. The valid time of the eastern pass is 1904 UTC and that of the western pass is 2044 UTC February 12, 2010 (measured at 45N). The center of the cyclone appears near 44N 149W near the left edge of the image. Image is courtesy of NOAA/NESDIS/ Center for Satellite Application and Research.
Figure 10. OPC North Pacific Surface Analysis charts valid 1200 UTC February 15 and 17, 2010.
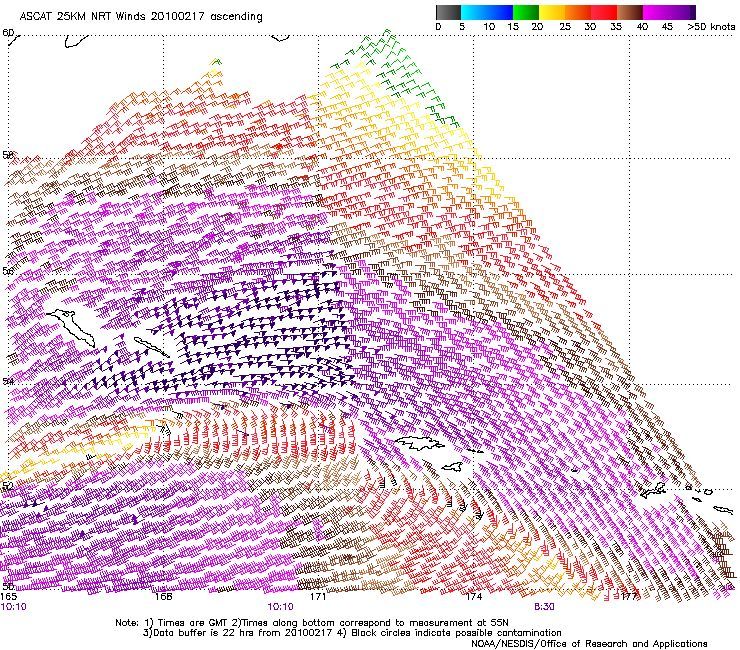
Figure 11. High resolution ASCAT scatterometer image of satellite sensed winds around the east semicircle of the hurricane force low shown in the second part of Figure 10. Portions of two passes appear, with valid times 0830 UTC for the eastern pass and 1010 UTC February 17 for the western pass (measured at 55N). The western Aleutian Islands appear in the lower-right portion of the image. Image is courtesy of NOAA/NESDIS/ Center for Satellite Application and Research.
Figure 12. OPC North Pacific Surface Analysis charts valid 1800 UTC February 25 and 26, 2010.
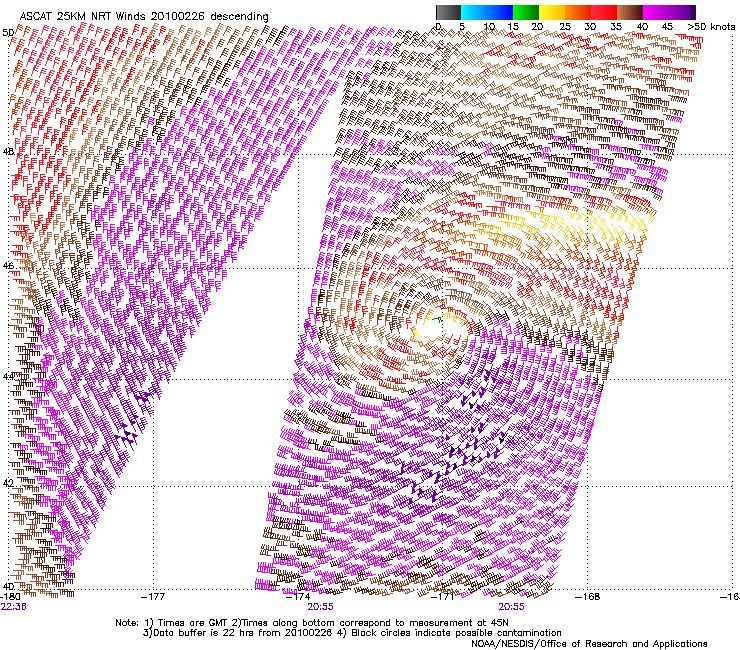
Figure 13. High resolution (25 km) ASCAT scatterometer image of satellite sensed winds around the hurricane force low shown in the second part of Figure 12. The valid time of the eastern pass is 2055 UTC and that of the western pass 2236 UTC February 26, 2010. The center of the storm is near 45N 171W. Image is courtesy of NOAA/NESDIS/ Center for Satellite Application and Research.
Figure 14. OPC North Pacific Surface Analysis charts valid 0600 UTC March 7 and 1800 UTC March 8, 2010.
Figure 15. OPC North Pacific Surface Analysis charts valid 1800 UTC March 9 and 0600 UTC March 11, 2010.
Figure 16. OPC North Pacific Surface Analysis charts valid 0600 UTC March 11 and 0600 UTC March 14, 2010.
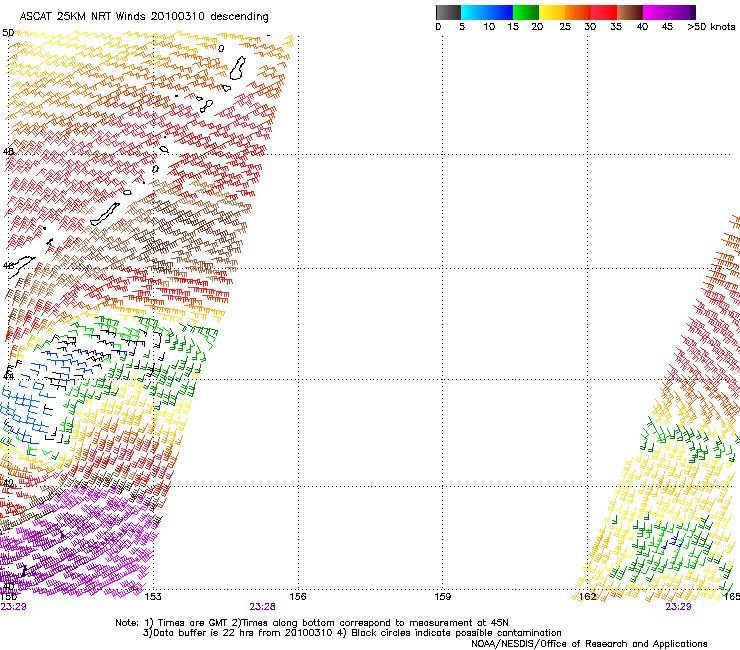
Figure 17. High resolution ASCAT scatterometer image of satellite sensed winds around the storm shown in the first part of Figure 16. The valid time of the pass is 2329 UTC March 10, 2010 (measured at 45N). The center of the cyclone appears near 44N 150E with the Kurile Islands appearing to the north. Image is courtesy of NOAA/NESDIS/ Center for Satellite Application and Research.
Figure 18. OPC North Pacific Surface Analysis charts valid 0600 UTC March 26, 2010. The two parts overlap between 165W and 175W.
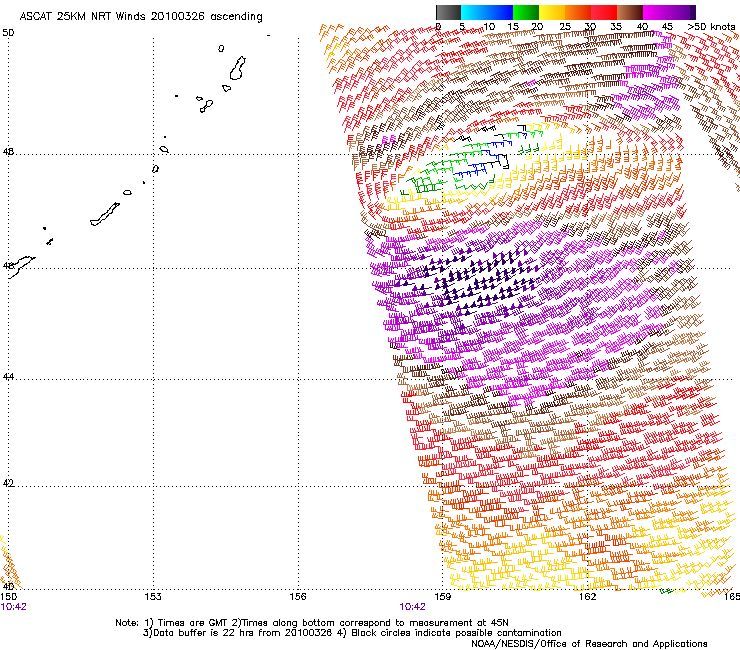
Figure 19. High resolution (25 km) ASCAT scatterometer image of satellite-sensed winds around the western cyclone shown in Figure 18. The valid time of the pass is 1042 UTC March 26, 2010. The center of the storm appears near 47N 159E east of the Kurile Islands which appear in the upper-left side of the image. Image is courtesy of NOAA/ NESDIS/ Center for Satellite Application and Research.
Figure 20. OPC North Pacific Surface Analysis charts valid 1200 UTC April 5 and 6, 2010.
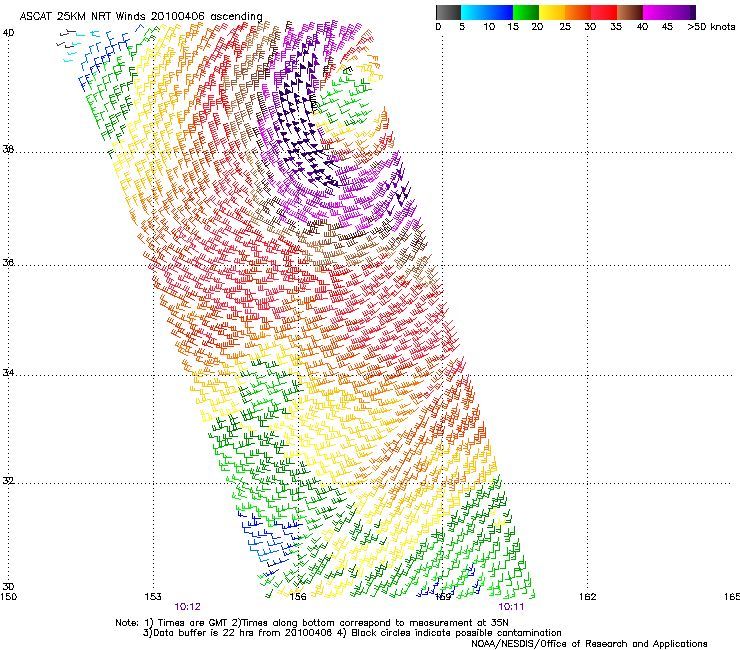
Figure 21. High resolution (25 km) ASCAT scatterometer image of satellite sensed winds around the hurricane force low shown in the second part of Figure 20. The valid time of the pass is 1011 UTC April 6, 2010 (measured at 35N). The center of the cyclone appears near 39N 157E. Image is courtesy of NOAA/NESDIS/ Center for Satellite Application and Research.
Figure 22. OPC North Pacific Surface Analysis charts valid 0000 UTC April 8 and 10, 2010.