Marine Weather Review North Atlantic Area January to April 2010
By George P. Bancroft
Ocean Prediction Center, Camp Springs, MD
NOAA National Center for Environmental Prediction
Introduction
The period of January to April 2010 featured an active storm track off the U.S. East Coast during January and February with the cyclones encountering varying amounts of high latitude blocking high pressure as they moved out over the North Atlantic. The blocking then forced the cyclones to turn north before reaching Europe, west toward the Atlantic provinces of Canada or even stall out or turn east or southeast toward France. During this most active period fourteen cyclones developed into hurricane force lows with seven occurring in the first half of February. Two cyclones developed central pressures below 950 hPa early in February. Increased blocking in March and April resulted in slow moving, weaker cyclones with OPC analyzing only one hurricane force low, early in March. The author does describe two other cyclones during this period producing winds near hurricane force winds as sensed by the European scatterometer (ASCAT) (Reference 1).
There was no tropical activity in OPCs marine area north of 31N during this period, as is normally the case. The official start of the Atlantic hurricane season is June 1.
Significant Events of the Period
North Atlantic Storm, January 8-12: A developing wave of low pressure passed just south of New England early on January 8 with Figure 1 showing the subsequent development into an intense cyclone over a thirty-six hour period. The central pressure fell 32 hPa in the twenty-four hour period ending at 1800 UTC on the 9th enroute to a lowest central pressure of 957 hPa at 1800 UTC on the 10th, six hours later than the valid time of the second part of Figure 1. The high resolution ASCAT data in Figure 2 reveals southwest winds to 50 kts on the southeast side of the cyclone near the time of maximum intensity. ASCAT data is smoother than QuikSCAT data and of lower resolution, and there is more averaging leading to lower wind speeds, especially at higher wind speeds. OPC gave the cyclone the hurricane force label briefly on January 10 before a weakening trend began, with the cyclone making a tight cyclonic loop northeast of the island of Newfoundland over the next two days while winds weakened to gale force. The system then moved east over the North Atlantic and dissipated on the 13th. Some ship, buoy and platform observations taken during the storm are listed in Table 1.
Northeastern Atlantic Storms, January 11/14:As the occluded front and cold front associated with the aforementioned intense low moved into the eastern North Atlantic on the 11th, a secondary cyclone formed on the front west of France near 19W at 1800 UTC on the 11th and moved northeast while developing a lowest central pressure of 962 hPa eighteen hours later 250 nmi west of Ireland. OPC briefly analyzed this cyclone as a hurricane force low while it passed west of Ireland on the 12th. The system then turned northwest over the next two days and maintained storm force winds before dissipating near the east Greenland coast late on the 14th. Available ship data showed mainly marginal gales and there was limited scatterometer coverage.
| Observation | Position | Date/Time (UTC) | Wind | Seas (m/ft) |
|---|---|---|---|---|
| Saar N (A8CI8) | 48N 42W | 10/1800 | SW 50 | 14.5/47 |
| Hibernia (VEP717) | 46.7N 48.7W | 10/1200 | NW 60 | |
| Sea Rose (VOXS) | 46.7N 48W | 10/0300 | W 48 | |
| Henry Goodrich (HP6038) | 46.7N 48.4W | 10/1800 10/1200 |
W 57 | 7.3/24 7.5/25 |
| Terra Nova (VCXF) | 46.4N 48.4W | 10/0300 10/1200 |
W 54 | 7.3/24 |
| Buoy 44140 | 42.9N 51.5W | 09/2000 09/1900 |
W 35 G43 Peak Gust 47 |
5.0/16 |
| Buoy 44138 | 44.3N 53.6W | 09/1600 09/1800 |
W 45 G58 Maximum |
4.5/15 5.5/18 |
| Buoy 44251 | 46.4N 53.4W | 09/1600 10/2200 |
NE 33 G43 Maximum |
2.5/8 4.0/13 |
Figure 1. OPC North Atlantic Surface Analysis charts valid 0000 UTC January 9 and 1200 UTC January 10, 2010.
Northeastern Atlantic Storm, January 15-17: This cyclone originated as a frontal wave of low pressure south of Nova Scotia near 40N late on the 12th and tracked east northeast over the next two days before turning northeast toward Iceland. Intensification was most rapid over the central Atlantic waters when the central pressure fell from 979 hPa to 966 hPa in the twelve hour period ending at 1200 UTC on the 15th, and storm force winds developed by that time. Intensification was more gradual thereafter, until the cyclone developed a lowest central pressure of 958 hPa as it briefly stalled 150 nmi south of Iceland at 1200 UTC on the 16th. The cyclone briefly developed hurricane force winds south of the center on the afternoon of the 16th with winds similar to those in Figure 2. The system then weakened while accelerating northward, passing northeast of Iceland on the 17th.
North Atlantic Storm, January 17-21: This cyclone originated east of Newfoundland 46W as a frontal wave of low pressure which moved northeast while intensifying, made a tight loop near 56N40W on the 18th and developed hurricane force winds northwest of the center near the southern tip of Greenland late that day. The cyclone developed a lowest central pressure of 956 hPa near 56N 39W at 0600 UTC on the 19th. An ASCAT pass near this time showed north winds to 50 kts near the southern tip of Greenland, similar to Figure 8 for the event at the beginning of February. Figure 3 shows the cyclone subsequently turning northwest toward Greenland and weakening.
North Atlantic Storm, January 19-22: The next significant event originated near the New Jersey coast early on January 18 and tracked east before turning northeast after passing south of Newfoundland on the 19th. Figure 3 depicts the final development over a thirty-six hour period into a 958 hPa hurricane force low turning west after passing near Iceland. Figure 4 shows 50 kts winds in enhanced easterly flow ahead of the front approaching the south coast of Iceland. Rapid weakening followed on the 22nd as the cyclone approached Greenland.
Southwestern North Atlantic Storm, January 22-23: Figure 5 shows this event as the rapid development of a coastal secondary low as a primary low south of the Great Lakes dissipates. Within twenty-four hours the cyclone developed a compact circulation as revealed by the 25 km ASCAT data in Figure 6. The 55 kts wind retrievals are strongly indicative of hurricane force winds just west and northwest of the low center due to the low bias of ASCAT winds especially at high wind speeds. The hurricane force winds weakened to storm force by the 23rd as a large cyclone over the North Atlantic to the northeast forced this cyclone to turn southeast and then follow a track across the southern waters on the 23rd and 24th while continuing to weaken. Later on January 24th the cyclone dissipated or became absorbed by the large North Atlantic system to the north.
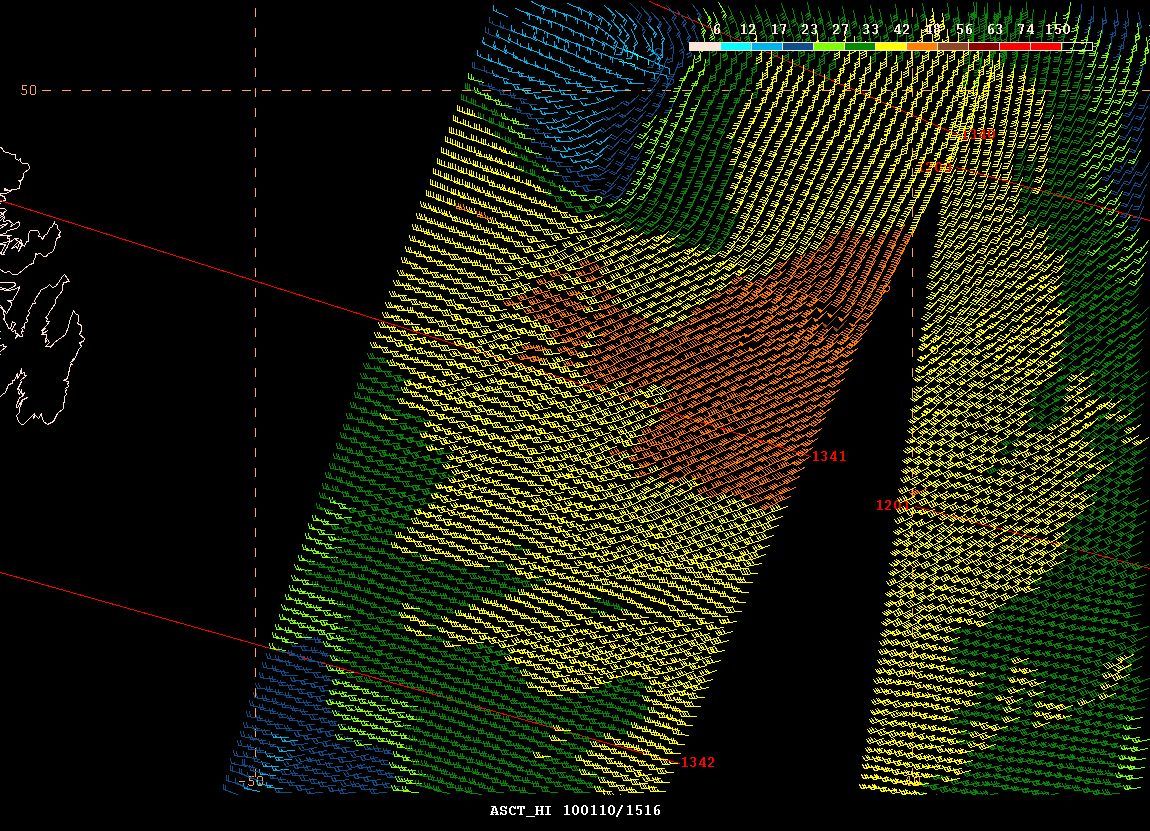
Figure 2. ASCAT (Advanced Scatterometer) image of satellite-sensed winds around the south side of the hurricane force low shown in the second part of Figure 1. The resolution is 25 km versus 50 km in the coarser-resolution version of the imagery. The western portion of the 1201 UTC pass and the eastern portion of the 1341 UTC pass, for January 10, 2010, are shown. These times are less than two hours later than the valid time of the second part of Figure 1. The eastern portion of the island of Newfoundland appears near the left edge of the image. Image contains data adapted for operational use by OPC and include cross-track time lines with four digit times in UTC.
Figure 3. OPC North Atlantic Surface Analysis charts valid 0600 UTC January 20 and 1800 UTC January 21, 2010.
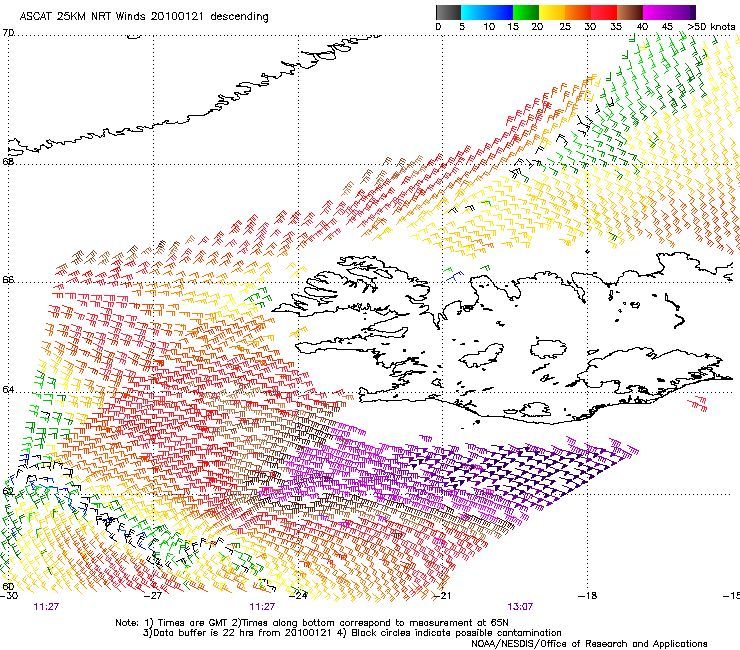
Figure 4. ASCAT scatterometer image of satellite-sensed winds around the north side of the hurricane force low in the second part of Figure 3 with the center near the lower left edge of the image. The valid time of the pass containing the strongest winds near Iceland is 1128 UTC January 21, 2010 measured at 70N, or about six hours prior to the valid time of the second part of Figure 3. The resolution of the image is 50 km versus 25 km in the high resolution version of the imagery. Image is courtesy of NOAA/NESDIS Center for Satellite Application and Research.
North Atlantic Storm, January 31 to February 3:The development of the first of two sub 950 hPa cyclones is shown in Figure 7. It originated as a low pressure wave near the southeast U.S. coast on January 30 and developed storm force winds six hours after moving offshore from Cape Hatteras. Figure 7 shows the period of most rapid intensification over a twenty-four hour period, when the central pressure dropped 32 hPa. The second part of Figure 7 shows the cyclone with a lowest central pressure of 948 hPa (27.99 inches), making it the second most intense of the period. The 50 km ASCAT data in Figure 8 reveal winds of 50 kts or higher both north and south of the cyclone center. The fact there are two different passes in the image results in a mismatch of wind fields in the upper portion of the image. The cyclone subsequently turned west into the Labrador Sea with its top winds weakening to storm force by February 2 and to gale force on the 3rd. Dissipation followed on the 4th, over northern Labrador.
North Atlantic Storm, February 3-7: The development of the most intense cyclone of the period is depicted in Figure 9. The intense low southeast of Newfoundland originated near northern Florida early on the 2nd and developed storm force winds when passing well south of Nova Scotia late on the 3rd and hurricane force winds six hours later while rapidly intensifying. The central pressure dropped 39 hPa in the twenty-four hour period ending at 1200 UTC February 4. The cyclone developed a lowest central pressure of 942 hPa near 44N 45W at 1800 UTC on the 5th, which was the lowest central pressure of any cyclone in both the North Atlantic and North Pacific during the four month period. Figure 11 is an infrared satellite image of the storm near maximum intensity, revealing broad frontal features and cloud bands with great vertical extent (cold tops on infrared) including those wrapping around a well defined center. A 25 km ASCAT pass in Figure 12 reveals a swath of widespread 50 to 55 kts winds and some 60 kts to the south and west of the center and is close to the valid time of Figure 9. On February 4 a NOAA P-3 aircraft sampled the rapidly deepening cyclone and detected hurricane force winds with both remote sensing and dropsondes (Reference 2). One dropsonde reported 80 kts winds near the surface. Some notable ship and buoy observations taken during this event are listed in Table 2. After reaching peak intensity the cyclone drifted northeast and weakened with its top winds diminishing to storm force on the 6th and to gale force late on the 7th. The system then turned toward the west into the Labrador Sea on February 8 and dissipated.
Northeastern Atlantic Storm, February 3-5: This event occurred about at the same time as the February 3-7 storm was spinning up. A frontal wave of low pressure formed near 47N 32W in the central waters at 1200 UTC February 3 and moved northeast over the next eighteen hours before making a tight cyclonic low west of Ireland near 27W and reaching a peak intensity of 962 hPa 1200 UTC on the 4th as a hurricane force low. The central pressure fell 23 hPa during the preceding twenty-four hours. Again referring to Figure 9 this cyclone appears west of Ireland near peak intensity as it begins moving toward Europe. A high resolution ASCAT pass from near 1200 UTC on the 4th showed northwest winds of 50 kts on the southwest side of the center, an area where Figure 9 indicates the tightest pressure gradient or packing of isobars. As suggested by the twenty four hour forecast track of the cyclone in Figure 9, the system later moved into northern France as a weakening gale late on the 5th.
| Observation | Position | Date/Time (UTC) | Wind | Seas (m/ft) |
|---|---|---|---|---|
| Oleander(PJJU) | 38N 70W | 03/1900 | N 50 | 9.5/31 |
| Maersk Iowa (KABL) |
35N 58W 34N 48W |
04/0000 04/2300 |
W 45 N 50 |
6.0/20 7.5/24 |
| Washington Express (WDD3826) |
49N 12W 38N 55W |
04/1800 05/1800 |
NW 35 NW 50 |
10.5/35 13.0/42 |
| Federal Matane(V2CF1) | 32N 58W | 05/0100 | NW 55 | 8.0/27 |
| Sea-Land Mercury(WKAW) | 38N 49W | 05/1800 | W 40 | 12.0/39 |
| Hibernia(VEP717) | 46.7N 48.7W | 05/0600 | NE 65 | |
| Sea Rose(VOXS) | 46.7N 48W | 05/0600 | NE 50 | 6.0/19 |
| Terra Nova(VCXF) | 46.4N 48.4W | 05/0600 | NE 50 | 5.5/18 |
| Buoy 44636 |
41.6N 50.1W |
04/1800 05/2100 |
NE 55 NW 50 |
|
| Buoy 44140 | 43N 51.4W | 05/0900 | NW 45 | 9.0/30 |
| Buoy 41001 | 32.7N 52.2W | 05/2200 | NW 35 | 8.0/27 |
Northwest Atlantic Storm, February 6-8: Figure 10 shows this event as a secondary hurricane force low that formed northwest of the main storm center which earlier was the intense 942 hPa cyclone described above. In this event the main focus for strongest northeast winds was near the southern tip of Greenland where, in a pattern similar to that of the ASCAT image of Figure 8. An ASCAT pass from 2229 UTC February 6 showed a swath of northeast winds 50 to 60 kts within 180 nmi south of the southern tip of Greenland, strongly indicative of hurricane force winds. This event was short-lived as the cyclone moved southwest to the island of Newfoundland by the 8th, where it dissipated.
North Atlantic Storm, February 6-9: This cyclone followed a track similar to that of the February 3-7 storm but otherwise evolved differently. Most of the initial intensification and strongest winds occurred near the mid-Atlantic coast of the U.S. Originating in the Gulf of Mexico on February, the developing cyclone moved through Georgia and the Carolinas on the 5th and early on the 6th before emerging off the Virginia capes as a hurricane force low late on the 6th (Figure 10). The central pressure dropped 22 hPa in the twenty-four hour period ending at 1800 UTC on the 6th. It also produced the first of two blizzards in the mid-Atlantic states early in February. Table 3 lists several buoy observations taken as the low moved off the coast. The winds in this event peaked early, with OPC surface analysis charts indicating a hurricane force on the afternoon and evening of the 6th. The cyclone then tracked northeast, passing east of the island of Newfoundland early on the 8th as a gale force low before re-intensifying into a storm in the southern Labrador Sea early on the 9th with pressures as low as 966 hPa. The cyclone then made a loop back to the southwest toward the island of Newfoundland, where it dissipated on February 11.
| Observation | Position | Date/Time (UTC) | Wind | Seas (m/ft) |
|---|---|---|---|---|
| Buoy 41025 |
35N 75.4W |
06/0500 06/0700 |
SE 39 G47 Peak gust 52 peak gust 54 |
5.5/18 6.0/20 |
| Buoy 44014 |
36.6N 74.8W |
07/0000 |
NW 43 G54 Peak gust 60 |
6.0/20 |
| Buoy 44066 |
39.6N 72.6W |
06/2100 |
NE 39 G47 Peak gust 49 |
7.5/25 |
| Buoy 44009 |
38.5N 74.7W |
06/1600 06/1100 06/2000 |
NE 35 G47 Peak gust 52 Maximum |
7.0/23 7.5/25 |
Southwestern North Atlantic Storm, February 10-13: The second of two coastal storms affecting the U.S. East Coast and adjacent waters initially followed a tracked similar to that of its predecessor, moving out of the northeast Gulf of Mexico on February 9 and then along the coast to the Delmarva Peninsula early on the 10th as a gale. It then rapidly intensified offshore, developing a 974 hPa central pressure and hurricane force winds 120 nmi east of Cape May 0000 UTC on the 11th. The central pressure dropped an impressive 31 hPa in the preceding twenty-four hour period. The cyclone also produced the second of two early February blizzards in the mid-Atlantic states. High resolution (25 km) ASCAT imagery late on the 10th and early on the 11th showed west winds to 50 kts off the U.S. mid-Atlantic coast south of the low center. Table 4 lists some notable ship, buoy and coastal CMAN reports taken during this event. The system then tracked east through the 11th while maintaining hurricane force winds until late on the 11th, and then turned north the next day with central pressures as low as 965 hPa. The cyclone then turned west across the island of Newfoundland (Figure 13) and weakened on the 13th, and dissipated in the northwest Gulf of St. Lawrence late on the 15th.
| Observation | Position | Date/Time (UTC) | Wind | Seas (m/ft) |
|---|---|---|---|---|
| Charleston Express (WDD6126) |
38N 68W 38N 63W |
11/0000 11/1200 |
SW 50 W 20 |
8.0/26 9.0/30 |
| Buoy 41013 |
33.4N 77.7W |
10/1300 10/1400 |
NW 37 G45 Maximum |
3.5/11 4.0/13 |
| Buoy 41025 |
35N 75.4W |
11/0300 |
NW 39 G49 Peak gust 51 |
4.0/13 |
| Buoy 44014 |
36.6N 74.8W |
11/0300 11/0600 |
NW 41 G49 Peak gust 52 Maximum |
4.5/15 5.0/16 |
| Buoy 44009 | 38.5N 74.7W | 10/2300 | NW 33 G43 | 3.5/11 |
| Buoy 44066 |
39.6N 72.6W |
11/0300 11/0400 |
NW 37 G47 Maximum |
5.5/18 6.5/21 |
| Buoy 44025 |
40.3N 73.2W |
10/1800 10/1900 16/2100 |
NE 35 G43 Peak gust 47 Maximum |
4.0/13 4.5/15 |
| Buoy 44017 |
40.7N 72W |
10/2100 11/0400 |
NE 33 G45 Maximum |
3.5/11 4.5/15 |
| Buoy 44018 |
41.3N 69.3W |
11/0700 11/0900 |
NE 39 G51 Maximum |
6.0/20 6.5/21 |
| Chesapeake Light (CHLV2) |
36.9N 75.6W |
10/2100 11/0200 |
W 43 G47 Peak 51 Peak gust 54 |
Southwestern North Atlantic Storm, February 13-16: Similar to the previous two events, this cyclone originated in the Gulf of Mexico late on February 11 where it quickly intensified to a gale on the 12th before emerging over the southwestern Atlantic waters by the 13th . Figure 13 depicts the subsequent track with the cyclone at maximum intensity in the second part of Figure 13. The central pressure fell 20 hPa in the twenty-four hour period ending at 1800 UTC on the 14th. A 25 km ASCAT pass about six hours later showed winds on the south side of the system as strong as in the February 3-7 event in this same area, up to 60 kts (Figure 12), except the larger and more intense earlier storm had a larger area of 50 to 60 kts winds in ASCAT imagery. Hurricane force winds lasted from the 14th to early on the 15th, before the cyclone stalled and weakened over the southern Grand Banks from late on the 15th until the 17th. The cyclone then dissipated or became absorbed by an approaching gale force low to the west late on February 17.
Eastern North Atlantic Storm, February 20-24: This event began as a secondary gale force low forming in the central Atlantic on the front associated with a main low center over the island of Newfoundland, at 1800 UTC February 19. It gradually intensified while tracking slowly east-northeast toward northwestern Europe and became hurricane force low three days later (Figure 14). The second part of Figure 14 shows the cyclone near maximum intensity. An ASCAT image (Figure 15) taken about two hours prior reveals an area of west to northwest winds 50 to 55 kts south and west of the center. The cyclone subsequently weakened to a gale while passing through the English Channel on the 24th, and then dissipated in the North Sea the next day. Selected ship and buoy reports taken during this storm are listed in Table 5.
| Observation | Position | Date/Time (UTC) | Wind | Seas (m/ft) |
|---|---|---|---|---|
| President Jackson (WRYC) |
40N 30W |
21/1800 |
W 40 |
9.0/29 |
| Atlantic Conveyou (SCKM) |
51N 25W |
21/1800 |
NE 50 |
6.5/21 |
| Manon(SIWN) | 42N 22W | 22/1200 | W 60 | 7.5/24 |
| Eva N (A8QJ7) |
49N 22W 48N 26W |
22/1800 23/0600 |
NE 45 N 45 |
8.5/28 10.5/35 |
| Berge Stahl (LATO2) |
49N 22W |
22/1800 |
SW 40 |
10/32 |
| Yorktown Express (WDD6127) |
45N 23W |
23/1200 |
W 35 |
10/33 |
| Chiquita Scandinavia (C6KD4) VREI3 |
46N 17W 43N 10W |
24/0600 |
NW 35 |
10.5/35 14/46 |
| Buoy 62001 | 45.2N 5W | 24/1200 | SW 35 | 9.5/31 |
Eastern North Atlantic Storm, February 26-28: This cyclone was already a rapidly intensifying gale as it moved northeast into the waters south of the Azores near 31N 25W at 1800 UTC February 26 with a 992 hPa central pressure, unusually strong at that low latitude. The central pressure fell by 22 hPa as the cyclone moved northeast into the Bay of Biscay during the next twenty-four hours. The cyclone then moved across northern France and the low countries while maintaining pressures in the 970s before passing east of Denmark late on the 28th. While ships and buoys in the area reported gale to storm force winds, the storm was most noteworthy as a major high wind event over northwestern Europe especially France. Some ship and buoy reports from this event are listed in Table 6.
| Observation | Position | Date/Time (UTC) | Wind | Seas (m/ft) |
|---|---|---|---|---|
| 3FPR6 | 38N 10W | 27/0200 | S 45 | 7.0/23 |
| CSCL Los Angeles (A8AX8) |
32N 17W |
27/0600 |
SW 45 |
8.5/28 |
| Berge Pacific (LAIK5) |
37N 13W 38N 12W |
27/1200 27/1800 |
NW 50 W 40 |
6.5/22 8.0/27 |
| Maersk Salalah(PHPG) Paradise N(DBRE) |
43N 10W 44N 9W |
27/1800 27/1800 |
N 45 N 45 |
|
| Buoy 62001 | 45.2N 5W | 28/0000 | NW 45 | 4.0/13 |
Northwest Atlantic Storm, March 7-8: As a gale force low approached Greenland from the south, the northeast flow near the southern tip of Greenland became enhanced. Hurricane force winds developed on March 7 and lasted about twelve to eighteen hours as the low pressure area headed northwest into the Labrador Sea. The cyclone then re-formed to the north and moved through the Davis Strait as a sub-gale force low on the 11th. A high resolution ASCAT pass for 1239 UTC March 7 showed an area of northeast winds 40 to 50 kts within 120 nmi south of the southern tip of Greenland. Hence, this was mostly a Greenland event.

Figure 5. OPC North Atlantic Surface Analysis charts valid 0000 UTC January 22 and 23, 2010.
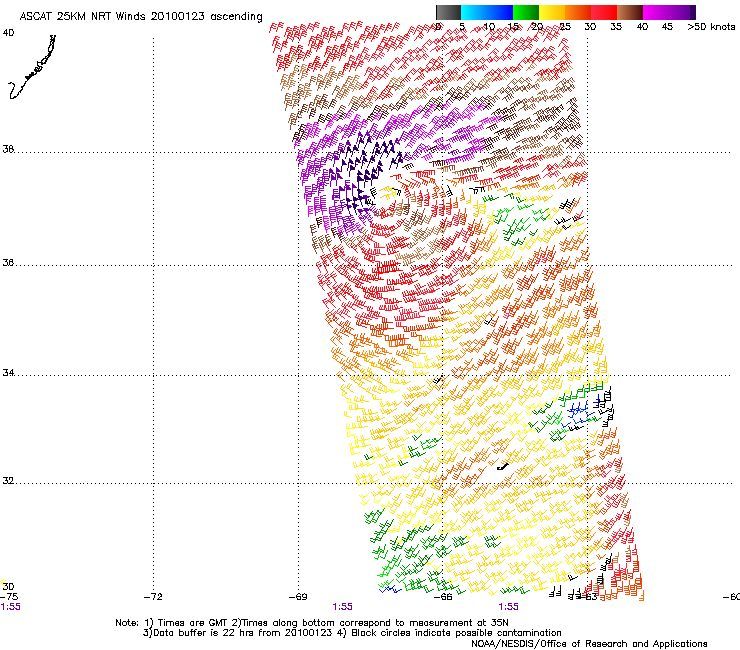
Figure 6. High resolution (25 km) ASCAT scatterometer image of satellite-sensed winds around the hurricane force low shown in the second part of Figure 5 with the center near 37N 67W. The valid time of the pass is 0155 UTC January 23, 2010 (measured at 35N), or about two hours later than the valid time of the second part of Figure 5. Part of southern New Jersey appears in the upper left corner of the image. Image is courtesy of NOAA/NESDIS Center for Satellite Application and Research.
North Atlantic Storm, March 13-15: The development of this cyclone over a twenty-four hour period is shown in Figure 16. The main focus is on the western developing storm which intensified to 996 hPa. Although this pressure is not remarkably deep, building high pressure to the west over the Newfoundland area resulted in a tight pressure gradient west of the low. The ASCAT image in Figure 17 including parts of two passes has an area of northwest winds to 50 kts in the lower left part of the image. The Philadelphia Express (WDC6736) reported west winds of 45 kts and 6.5 m seas (22 ft) near 37N 39W at 2100 UTC on the 14th. The OOCL California (VRWC8) near 42N 46W encountered northwest winds of 35 kts and 8.5 m seas (28 ft) at 1800 UTC on the 14th, the highest reported seas among ships in the area. The cyclone subsequently moved east and weakened to a gale on the 15th before turning northeast and dissipating as a low pressure trough west of Ireland on the 16th.
Southwestern North Atlantic Storm, April 23-26: Originating near the North Carolina coast late on April 21, this late season cyclone is shown in Figure 18 intensifying into a storm over a thirty-six hour period. The center initially moves southeast over warm water and developed a lowest central pressure of 977 hPa six hours later before slowly weakening. The infrared satellite image in Figure 19 near the time of the second part of Figure 18 is remarkable in showing some tropical features such as convective clouds forming around a relatively cloud free center. The heavy convection or thunderstorms along the front to the east make it quite prominent. An ASCAT pass at 1454 UTC on the 23rd providing partial coverage of the western portion of the cyclone revealed a couple of 50 kts wind retrieval, indicating winds with this system approached hurricane force. The cyclone subsequently weakened to a gale over the south central waters on the 25th as it turned toward the northeast, with dissipation occurring west of Ireland late on April 27. Selected ship observations taken in this event are listed in Table 7.
| Observation | Position | Date/Time (UTC) | Wind | Seas (m/ft) |
|---|---|---|---|---|
| Charleston Express (WDD6126) |
37N 64W 38N 59W 41N 45W |
23/0600 23/1800 25/0900 |
W 50 SW 50 N 45 |
1105/38 10.5/35 8.5/28 |
| Ocean Titan (WDC7175) |
34N 60W |
24/1200 |
NW 50 |
15.0/49 |
| S.A. Oranje (ZSDN) | 33N 59W | 24/1200 | W 50 | 6.5/22 |
| Celebrity Equinox (9HXD9) |
35N 42W 38N 25W |
24/0500 26/1000 |
S 45 S 45 |
|
| Overseas Philadelphia (WGDB) |
37N 35W |
26/0600 |
SW 45 |
4.0/12 |
References
ASCAT Users Manual , http://www.knmi.nl/scatterometer/publications/pdf/ASCAT_Product_Manual.pdf
E-mail communication, Sienkiewicz, Joseph (Ocean Prediction Center/ Ocean Applications Branch), P-3 Flights in Winter Storms, February 9, 2010.
Von Ahn, Joan. and Sienkiewicz, Joe, Hurricane Force Extratropical Cyclones Observed Using QuikSCAT Near Real Time Winds, Mariners Weather Log, Vol. 49, No. 1, April 2005.

Figure 7. OPC North Atlantic Surface Analysis charts valid 0000 UTC February 1 and 0000 UTC February 2, 2010.
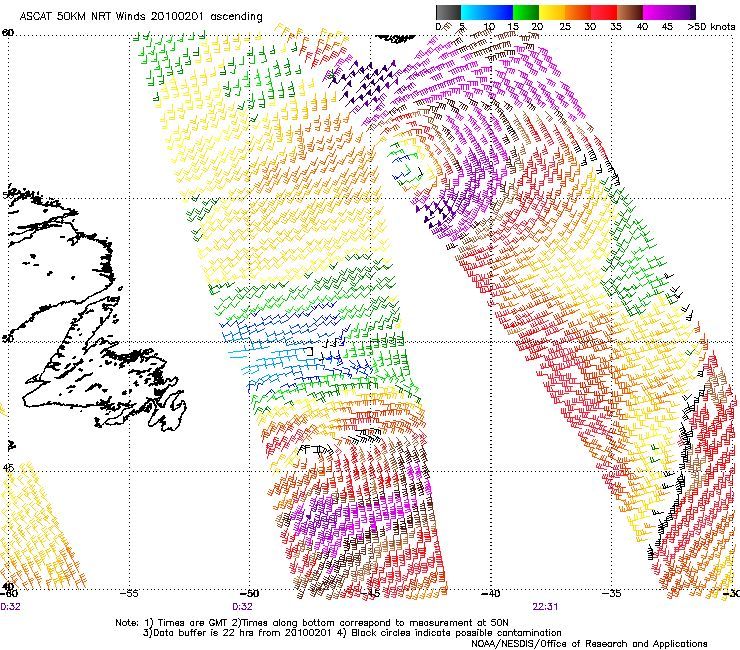
Figure 8. 50 km ASCAT scatterometer image of satellite-sensed winds around the hurricane force low shown in the second part of Figure 7. The valid times of portions of adjacent passes is 2231 UTC February 1 for the eastern swath and 0032 UTC February 2, 2010 for the western swath (measured at 50N) or within one and one half hours of the valid time of the second part of Figure 7. The center of the storm appears near 56N 44W in the eastern swath. Image is courtesy of NOAA/NESDIS Center for Satellite Application and Research.

Figure 9. OPC North Atlantic Surface Analysis charts valid 0000 UTC February 5, 2010.

Figure 10. OPC North Atlantic Surface Analysis charts valid 0000 UTC February 7, 2010.
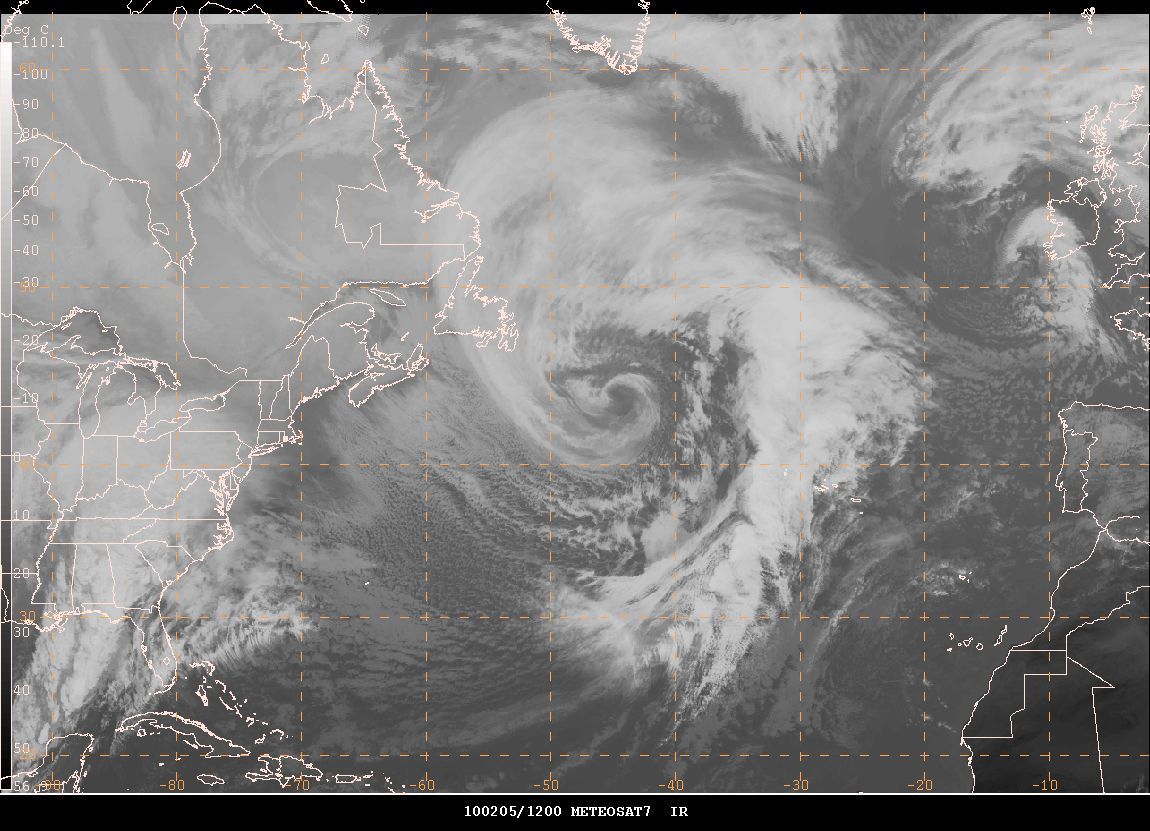
Figure 11. Mosaic of GOES East and METEOSAT7 infrared satellite imagery valid 1200 UTC February 5, 2010. The valid time of the image is twelve hours later than that of Figure 9. Satellite senses temperature on a scale from black (warm) to white (cold) in this type of imagery.

Figure 12. High resolution ASCAT scatterometer image of satellite-sensed winds around the hurricane force low southeast of the island of Newfoundland shown in Figure 9. The valid time of the pass is 0048 UTC February 5, 2010 (measured at 45N), or less than one hour later than the valid time of Figure 9. The center of the storm appears near 42N 48W. Image is courtesy of NOAA/NESDIS Center for Satellite Application and Research.

Figure 13. OPC North Atlantic Surface Analysis charts valid 0600 UTC February 13 and 1800 UTC February 14, 2010.
Figure 14. OPC North Atlantic Surface Analysis charts valid 1200 UTC February 20 and 0000 UTC February 23, 2010.
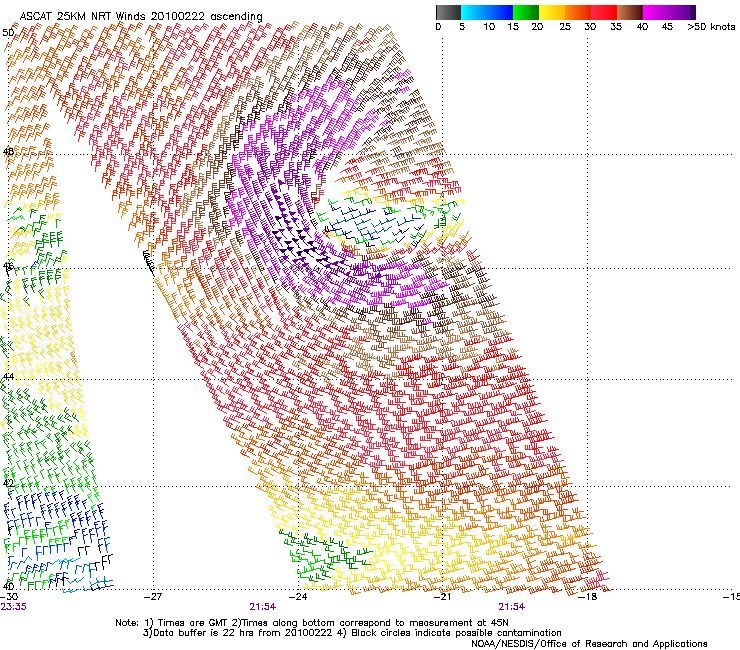
Figure 15. High resolution ASCAT scatterometer image of satellite-sensed winds around the hurricane force low shown in the second part of Figure 14. The valid time of the pass is 2154 UTC February 22, 2010, or about two hours prior to the valid time of the second part of Figure 14. Image is courtesy of NOAA/NESDIS Center for Satellite Application and Research.
Figure 16. OPC North Atlantic Surface Analysis charts valid 1200 UTC March 13 and 14, 2010.
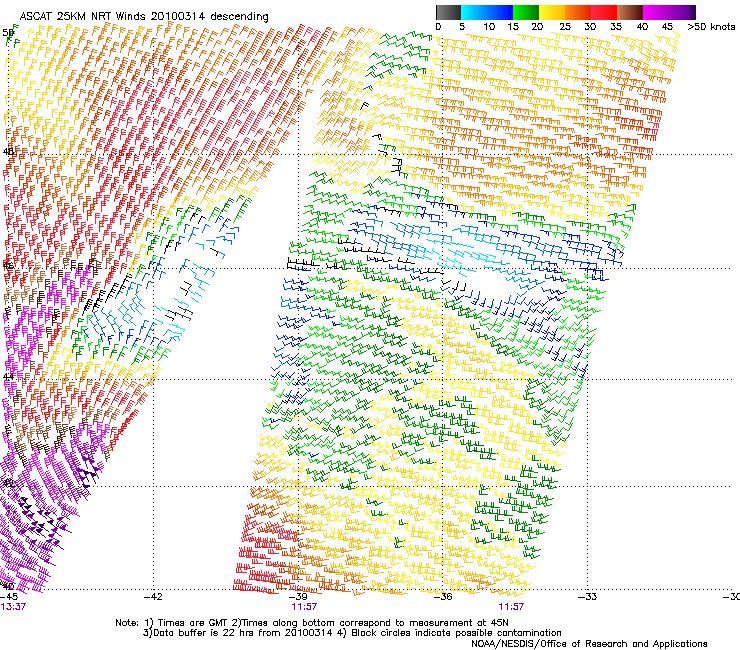
Figure 17. High resolution ASCAT scatterometer image of satellite-sensed winds around the storm shown in the second part of Figure 16. The valid time of the eastern pass is 1157 UTC and for the western pass 1337 UTC March 14, 2010 (measured at 45N) , or about one and one half hours later than the valid time of the second part of Figure 16. Image is courtesy of NOAA/NESDIS Center for Satellite Application and Research.

Figure 18. OPC North Atlantic Surface Analysis charts valid 1200 UTC April 22 and 0000 UTC April 24, 2010.
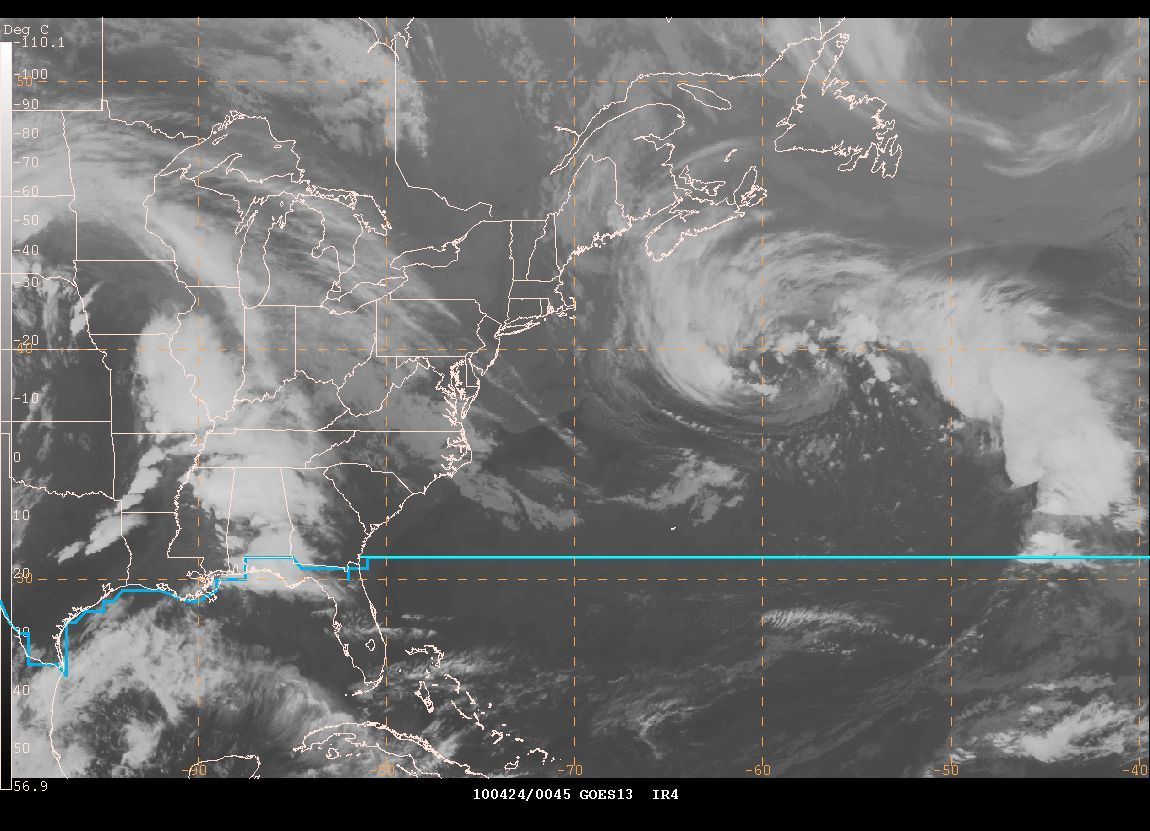
Figure 19. GOES13 infrared satellite imagery valid 0045 UTC April 24, 2010. The valid time of the image is approximately an hour later than that of the second part of Figure 18. Satellite senses temperature on a scale from black (warm) to white (cold) in this type of imagery.
Back to top