Tropical Atlantic and Tropical East Pacific Areas January through April 2009
Ariel Cohen, Jessica Schauer Clark and John Cangialosi, Tropical Analysis and Forecast Branch, National Hurricane Center, Miami, Florida
Atlantic, Caribbean, and Gulf of Mexico
The winter of 2009 proved to be active across the Tropical Analysis and Forecast Branch (TAFB) Atlantic Area of Responsibility (AOR) (from 7N to 31N west of 35W). In total, 27 marine warnings were issued from January through April 2009. Ten gale events occurred over the Gulf of Mexico, the strongest of which reached 45 kts. All of these events were associated with cold fronts. Thirteen events occurred across the Western Atlantic. The forcing for these Atlantic events consisted of a combination of cold fronts and complex frontal low pressure systems. However, one of these events peaked at storm force associated with a low pressure system that obtained some subtropical characteristics. Six marginal gale events occurred over the Caribbean Sea, associated with cold fronts over northwestern areas, as well as tight pressure gradients interacting with local topography near the coast of Colombia. Table 1 provides a few characteristics of all of the events. Rather than providing a brief summary of each event, we have decided to discuss in detail a few of the more significant events. Readers are encouraged to access the archive of the TAFB high seas forecasts directly at ftp://ftp. nhc.noaa.gov/pub/products/marine/ high_sea/ if the event of interest is not discussed.
Gulf of Mexico
One of the strongest and most prolonged gale events over the Gulf of Mexico occurred in late March. The weather pattern consisted of a slow moving high pressure system centered just west of Bermuda and a low pressure complex over the Southern Plains of the U.S. The pressure gradient between these systems caused a brief, 12 hour period of southeasterly gale force winds over the southeastern Gulf of Mexico beginning at 12 UTC 27 March. A high resolution QuikSCAT pass at 12 UTC 27 March showed the cores of the gale force winds (near 35 kts) in the Straits of Florida and the Yucatan Channel. These winds oppose the Florida current over the Straits which can often create very hazardous marine conditions in that area. Unfortunately, TAFB forecasters did not provide much lead time for the marginal gales ahead of the front, likely because many of the numerical models failed to resolve these narrow passages. However, TAFB forecasters provided 54 hrs of lead time for the northerly gale conditions west of the front. The front moved off the Texas coast around 03 UTC 28 March with northwest to north winds quickly increasing to gale force behind it. The front continued southeastward over the next couple of days crossing the entire Gulf. The gale conditions ended at 00 UTC 29 March and were mainly confined to the western Gulf of Mexico. Not surprisingly, the strongest observed flow occurred over the western Bay of Campeche where the higher terrain over Mexico provides an enhancement. A high resolution QuikSCAT pass around 1230 UTC 28 March verified the anticipated 45 kts winds near the coast of Mexico (Figure 1).
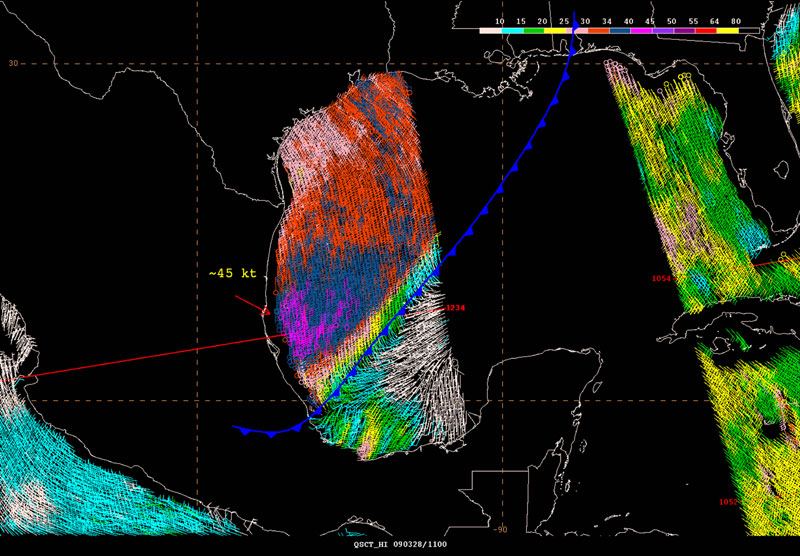
Figure 1. High resolution QuikSCAT pass across the Gulf of Mexico from around 1230 UTC on 28 March 2009 with red, blue, and purple wind barbs indicating gale force winds.
Central Atlantic Mid-March Storm
A deep low pressure system originating over the northwest Atlantic brought strong gale to minimal storm force winds to portions of the subtropical North Atlantic during the middle of March 2009. This low pressure system deepened considerably over the central Atlantic in the Ocean Prediction Centers AOR prior to 10 March 2009, before moving southeastward into the TAFB AOR.
During the night of 10 March 2009, gales began moving into TAFBs AOR over the western semicircle of the low, where the surface pressure gradient was steepened by a strong surface ridge over the western Atlantic. At this point, this extratropical low was beginning to acquire subtropical characteristics. In particular, this low had occluded during previous days with ocean modified, warmer air to the west of the occluded front and relatively cooler air to the east of the occluded front. By early morning on 11 March, the low was retrograding into the warmer air. At the same time, the colder air continued wrapping cyclonically around the low, secluding the low in a relatively warm and unstable air mass a process known as seclusion. In response to these unstable conditions, bands of convection were increasing early in the morning as the low was approaching TAFBs AOR (Figure 2). Latent heating aloft associated with the upswing in convection resulted in greater lift thus intensifying the surface low during the morning (see Figure 3), with a 994 hPa surface low near 33N 53W at 0600 UTC 11 March 2009.
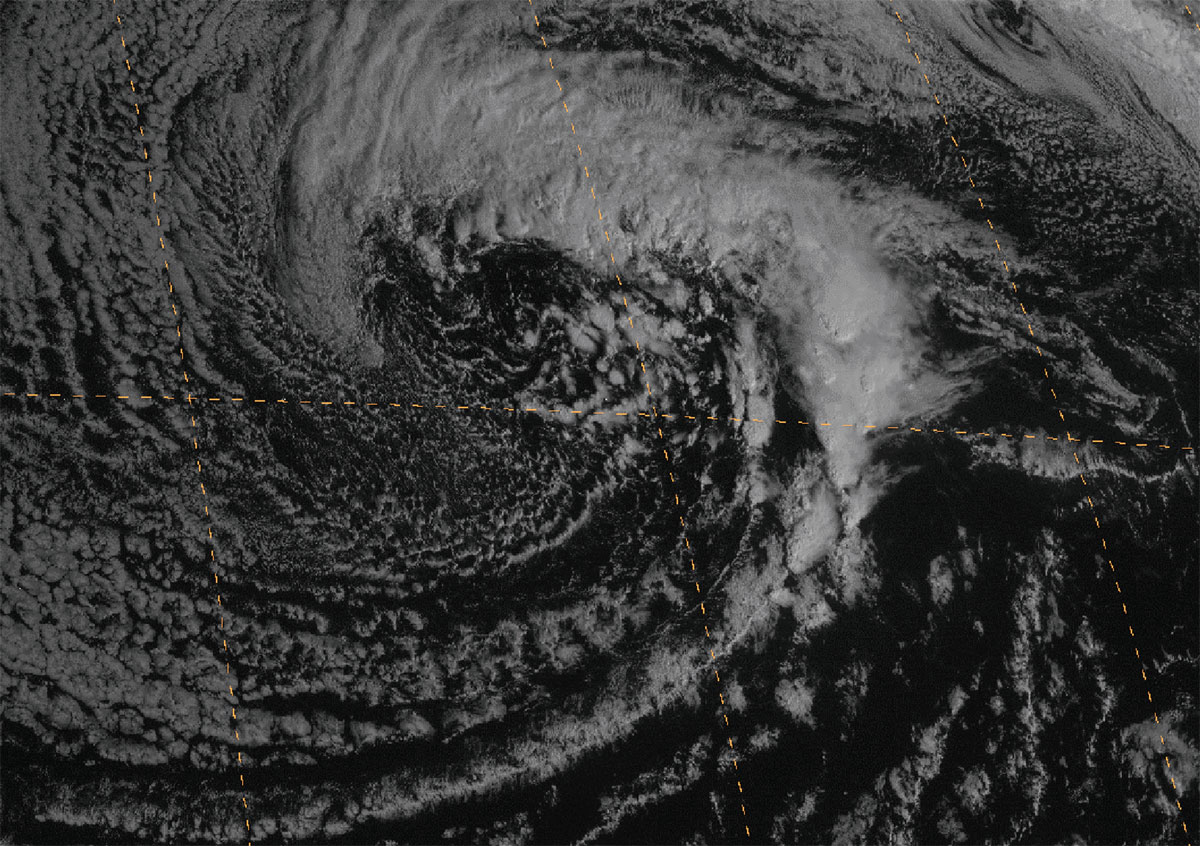
Figure 2. GOES-12 visible satellite image at 1215 UTC 11 March 2009
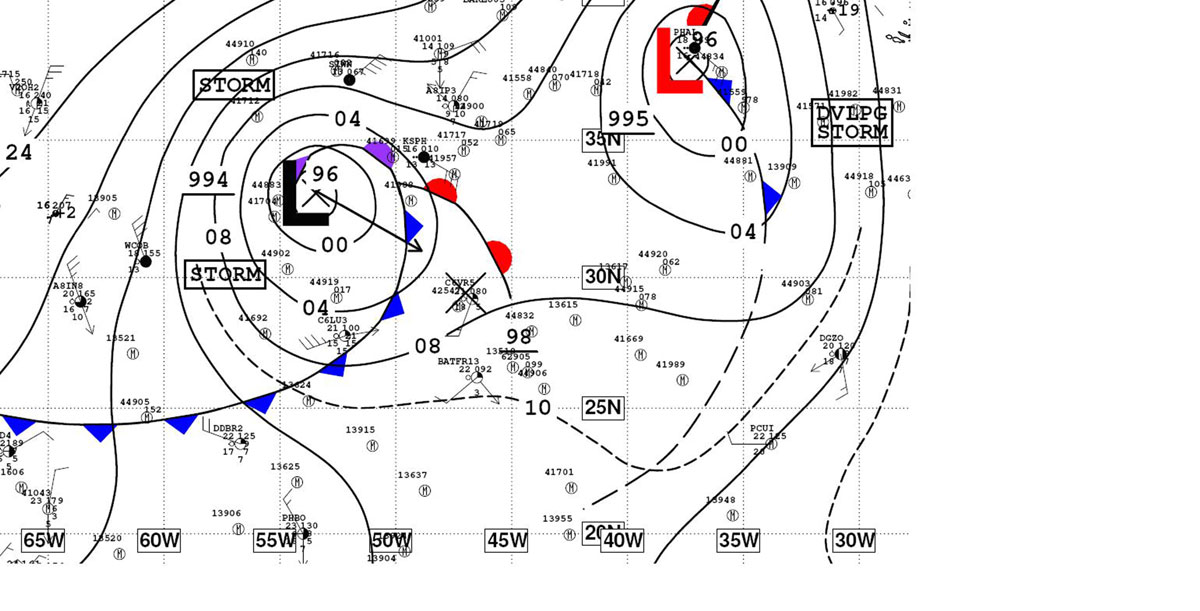
Figure 3. Surface analysis at 0600 UTC 11 March 2009. (Click to enlarge)
The end result was the development of a swath of 45-55 kts winds out 90 to 180 nm northwest of the low as revealed by the high resolution QuikSCAT pass around 2245 UTC 10 March 2009 (see Figure 4). This scatterometer data also indicated isolated 50 kt wind barbs as far south as 33N. Computer models captured this wind swath rather well and pivoted minimal storm force winds into the TAFB AOR after 0600 UTC on 11 March 2009, when a storm warning was issued N of 30N between 56W and 59W. Available guidance indicated the likelihood that winds as high as 1 km were being mixed to the surface.
| Onset Date | Area | Duration | Magnitude | Forcing |
|---|---|---|---|---|
| 7 Jan | West Atlantic | 36 h | Gale | Cold Front |
| 11 Jan | Gulf of Mexico | 30 h | Gale | Cold Front |
| 13 Jan | Gulf of Mexico | 6 h | Gale | Cold Front |
| 19 Jan | West Atlantic | 48 h | Gale | Cold Front |
| 27 Jan | Caribbean | 36 h | Gale | Pressure Gradient |
| 30 Jan | Gulf of Mexico | 18 h | Gale | Cold Front |
| 31 Jan | West Atlantic | 24 h | Gale | Cold Front |
| 2 Feb | Gulf of Mexico | 18 h | Gale | Cold Front |
| 3 Feb | West Atlantic | 60 h | Gale | Cold Front |
| 4 Feb | Caribbean | 42 h | Gale | Pressure Gradient |
| 7 Feb | Caribbean | 18 h | Gale | Pressure Gradient |
| 16 Feb | West Atlantic | 60 h | Gale | Cold Front |
| 19 Feb | West Atlantic | 18 h | Gale | Cold Front |
| 20 Feb | Caribbean | 66 h | Gale | Pressure Gradient |
| 22 Feb | Gulf of Mexico | 18 h | Gale | Cold Front |
| 1 Mar | Gulf of Mexico | 27 h | Gale | Cold Front |
| 3 Mar | West Atlantic | 18 h | Gale | Low/Trough |
| 6 Mar | West Atlantic | 102 h | Gale | Low |
| 7 Mar | Caribbean | 78 h | Gale | Pressure Gradient |
| 11 Mar | Central Atlantic | 72 h | Storm | Low |
| 18 Mar | West Atlantic | 6 h | Gale | Cold Front |
| 25 Mar | Gulf of Mexico | 12 h | Gale | Cold Front |
| 27 Mar | Gulf of Mexico | 12 h | Gale | Cold Front gales ahead of front |
| 27 Mar | Caribbean | 12 h | Gale | Cold Front gales ahead of front |
| 28 Mar | Gulf of Mexico | 18 h | Gale | Cold Front gales behind front |
| 06 Apr | Gulf of Mexico | 24 h | Gale | Cold Front gales behind front |
| 07 Apr | West Atlantic | 12 h | Gale | Cold Front gales ahead of front |
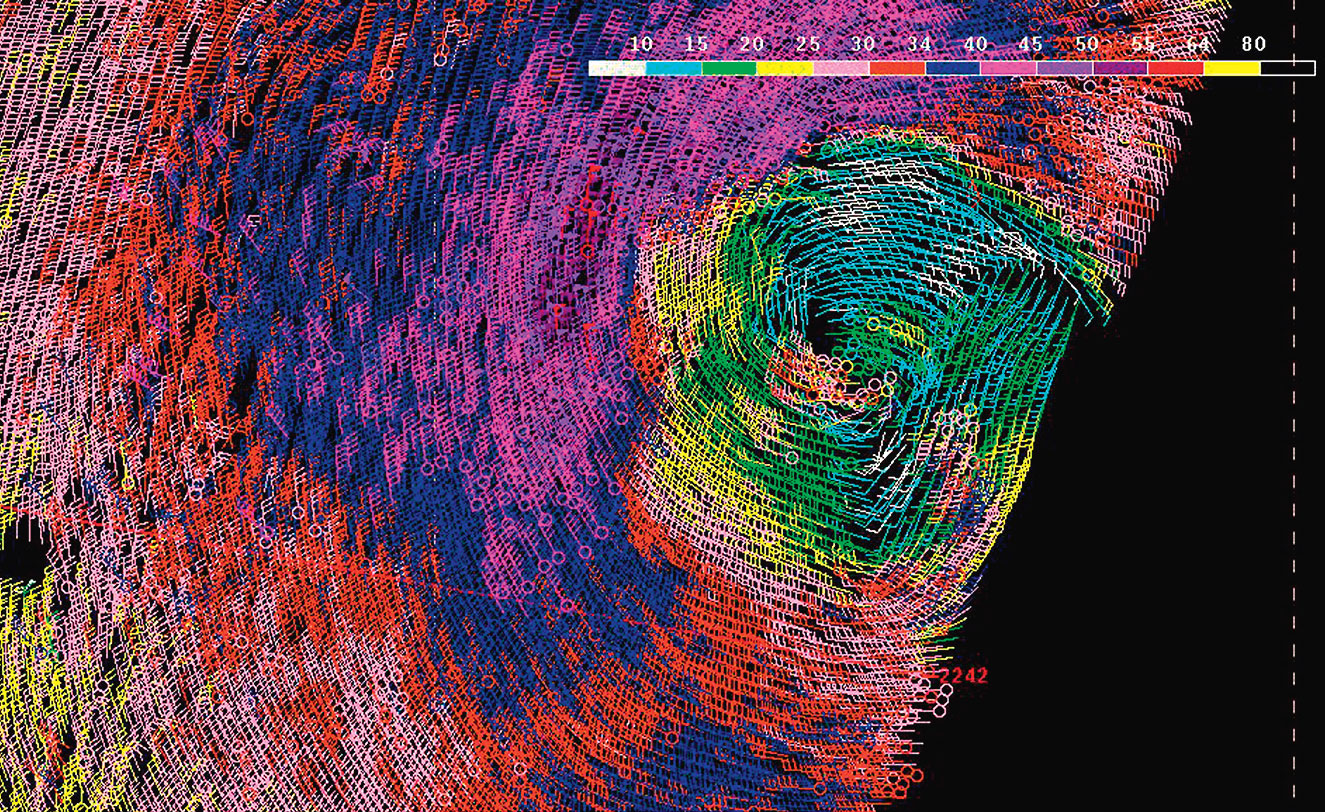
Figure 4. High resolution QuikSCAT pass across the central North Atlantic from around 2245 UTC on 10 March 2009 with red, blue, and light purple wind barbs indicating gale force winds and dark purple and embedded light red wind barbs indicating storm force winds.(Click to enlarge)
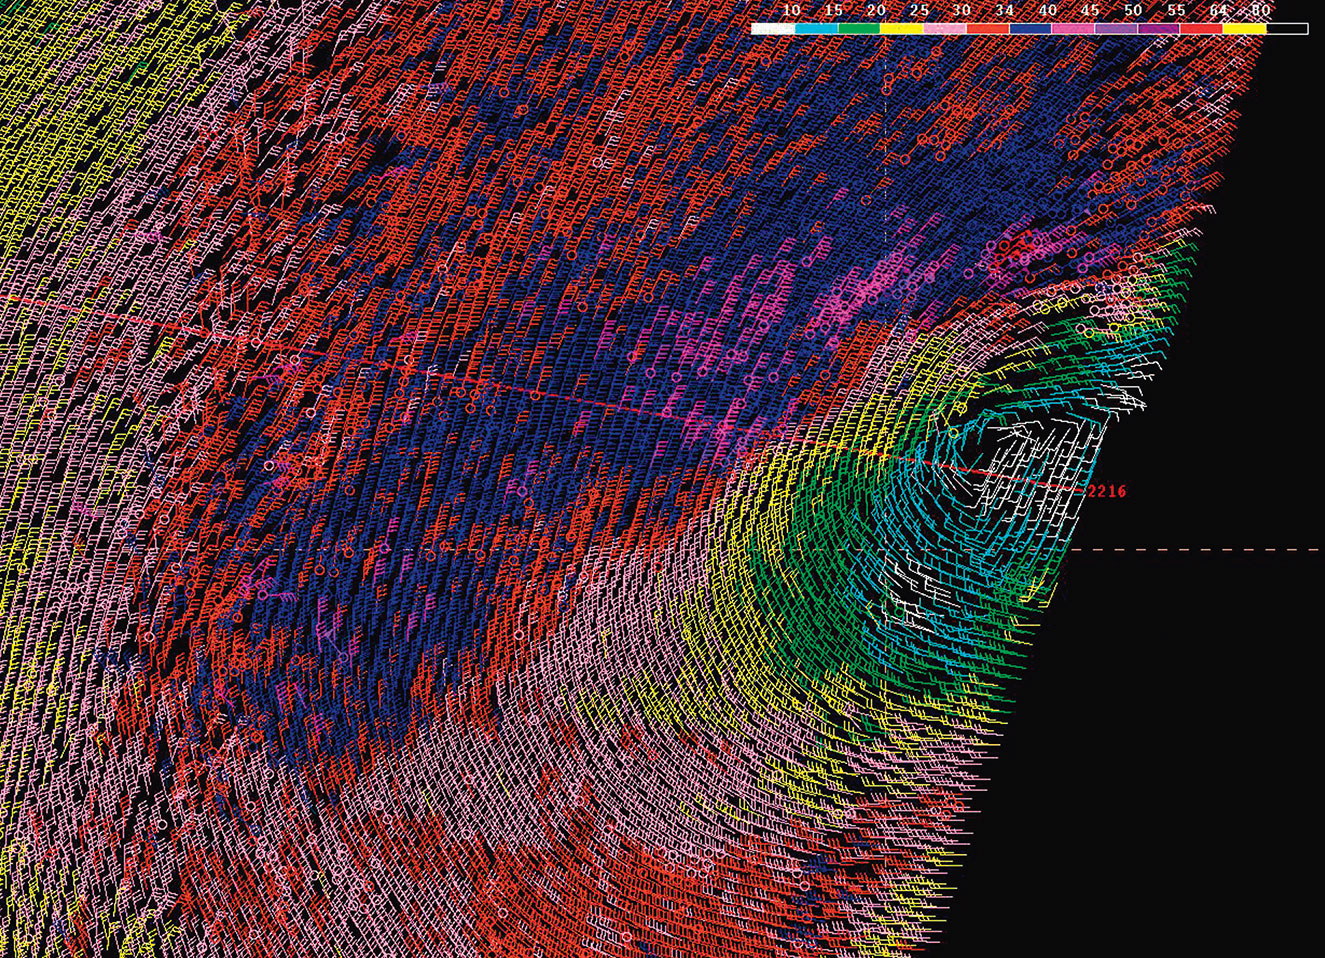
Figure 5. High resolution QuikSCAT pass across the central North Atlantic from around 2230 UTC on 11 March 2009 with red, blue, and light purple wind barbs indicating gale force winds.(Click to enlarge)
The high resolution QuikSCAT pass around 2230 UTC on 11 March 2009 (Figure 5) indicated strong gale force winds in the northwestern quadrant of the low entering TAFBs AOR north of 30N, suggesting the likelihood that storm force winds impacted this region earlier in the day. Also, with the direction of the winds around the low paralleling the direction of the lows motion in the southwest semicircle of the low (the dynamic fetch region), and with the strongest winds around the low in the western semicircle, seas in the overlapping southwest quadrant had the greatest opportunity to increase to particularly extreme values. NOAA WaveWatch III guidance indicated that maximum seas heights were up to 26 ft.
A number of ships reported strong winds and high seas during this event across the central North Atlantic. In particular, on 11 March 2009, the Liberty Sun reported 30 kts winds and seas of 6.7 m (22 ft) at 1200 UTC near 30.4N 59.4W. The Albemarle Island reported 35 kts winds with 8.5 m (28 ft) seas at 1200 UTC near 26.2N 53.5W with 35 kts winds and 7 m (23 ft) seas at 24.5N 54.5W at 1800 UTC the same day.
| Onset Date | Region | Magnitude | Duration |
|---|---|---|---|
| 12 Jan | Tehuantepec | Storm | 150 h |
| 21 Jan | Tehuantepec | Gale | 30 h |
| 31 Jan | Tehuantepec | Gale | 36 h |
| 3 Feb | Tehuantepec | Hurricane | 96 h |
| 4 Feb | Papagayo | Gale | 78 h |
| 22 Feb | Tehuantepec | Storm | 60 h |
| 1 Mar | Tehuantepec | Hurricane | 54 h |
| 17 Mar | Tehuantepec | Gale | 18 h |
| 21 Mar | Tehuantepec | Gale | 36 h |
| 7 Apr | Tehuantepec | Storm | 42 h |
| 21 Apr | Tehuantepec | Gale | 48 h |
Gale Force Winds along the coasts of Colombia and Nicaragua
In early February 2009, a highly-amplified deep trough over the eastern U.S. extended into the Gulf of Mexico with an associated cold front making its way into the western Caribbean (Figure 6).
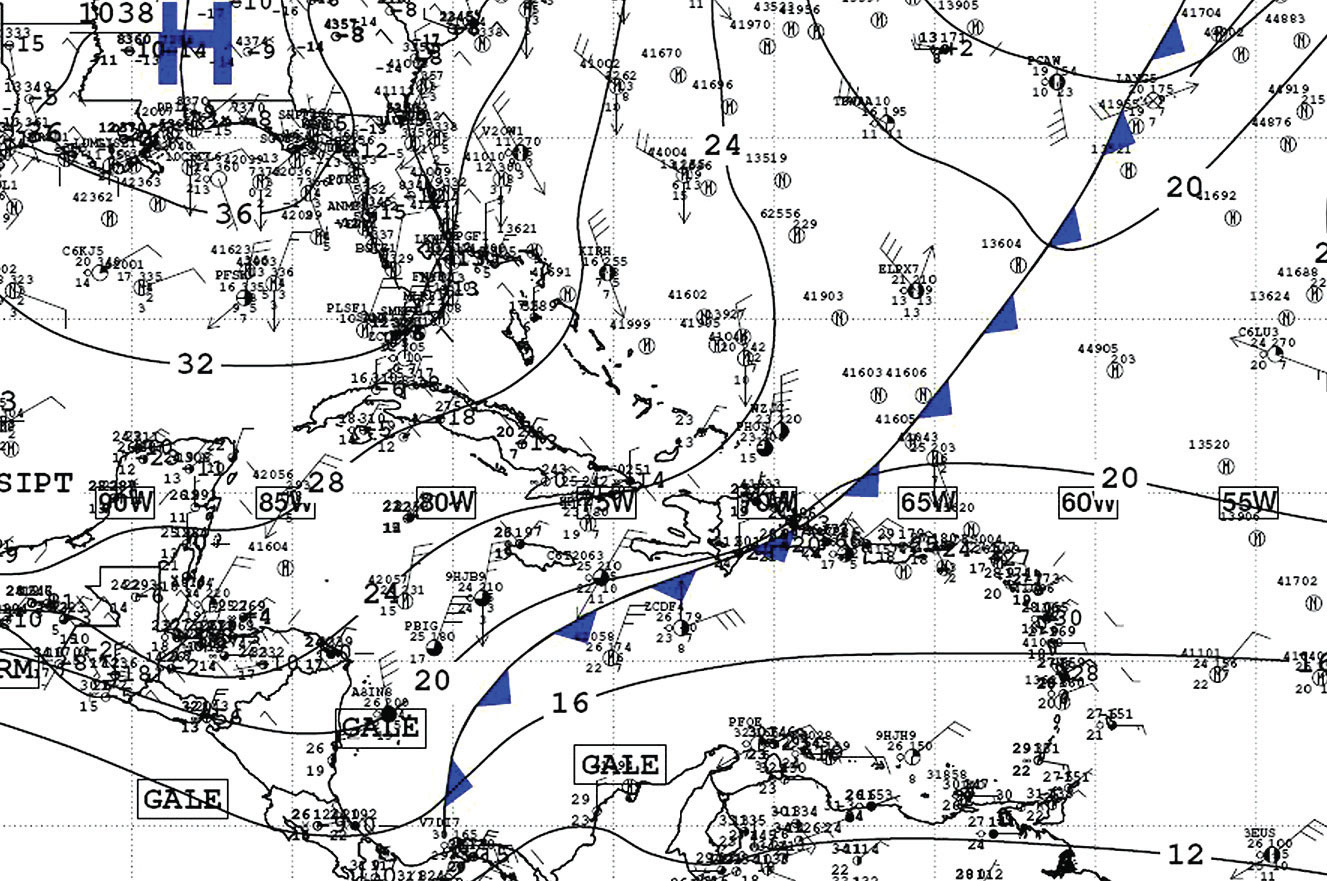
Figure 6. Surface analysis at 1800 UTC on 5 February 2009.(Click to enlarge)
The strong pressure gradient north of the front interacted with nearby terrain variations near the coasts of Nicaragua and Colombia to result in gale force winds in these locations from 1200 UTC on 4 February 2009 until 0600 UTC 6 February 2009. These gales were likely aided by strong turbulence associated with instability generated by cold air being advected over the relatively warmer Caribbean waters. The high resolution QuikSCAT pass from around 0000 UTC on 6 February 2009 depicted gale force winds along the coast of Nicaragua, with near gale force winds near the coast of Colombia (Figure 7).
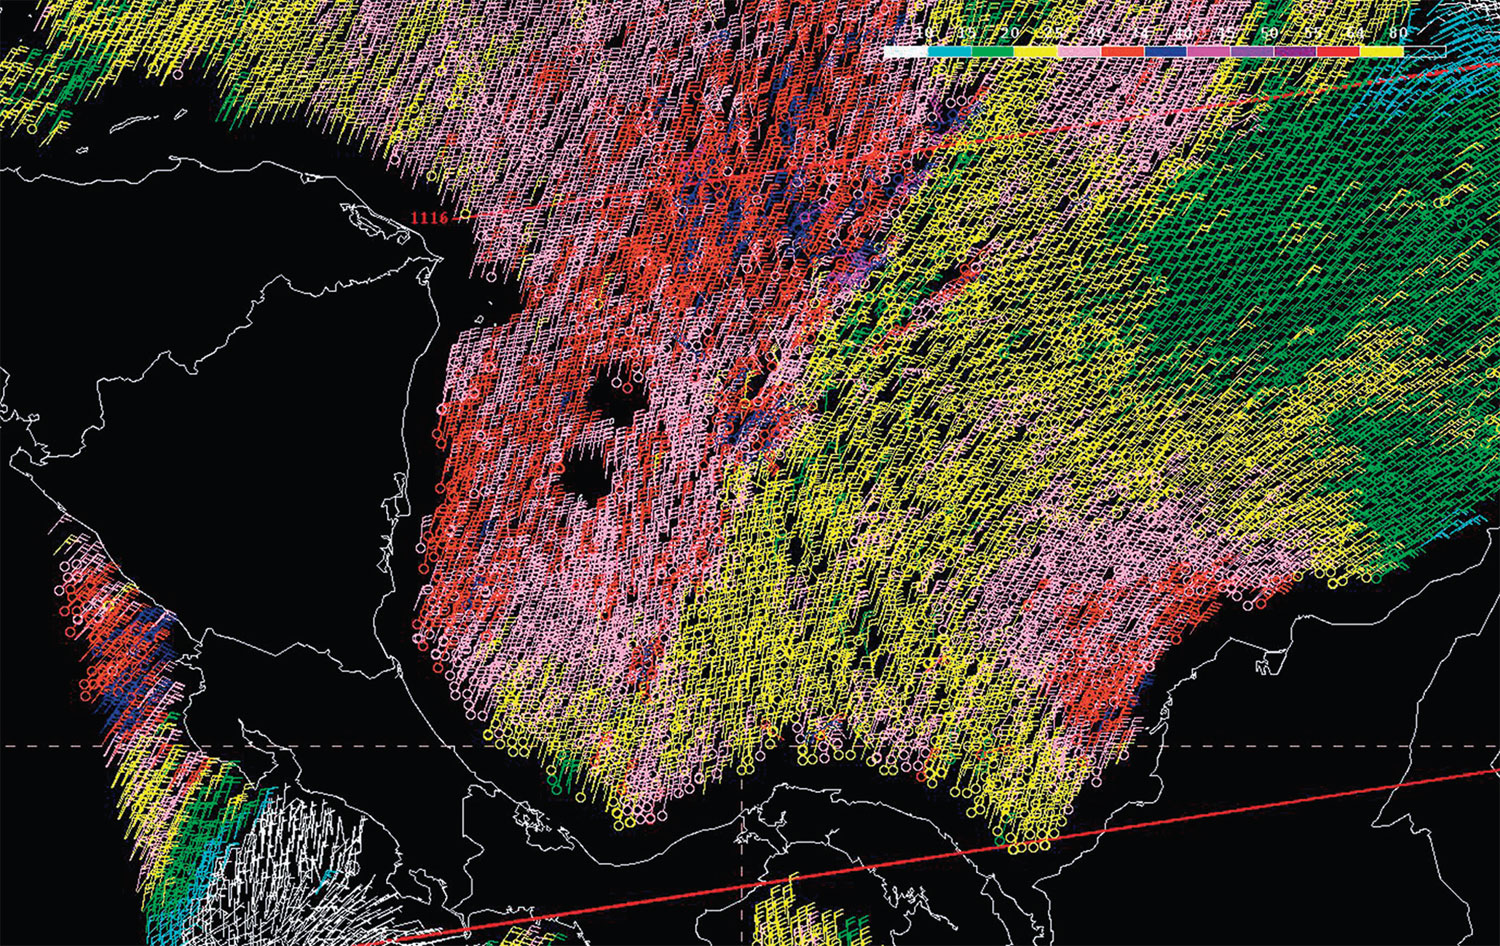
Figure 7. High resolution QuikSCAT pass across the central North Atlantic from around 1100 UTC on 05 February 2009 with red and blue wind barbs indicating gale force winds near the coasts of Nicaragua and Colombia.
A number of ships reported strong winds and high seas during this event across the western Caribbean. In particular, the Esmeralda reported seas to 4.3 m (14 ft) off the Nicaraguan coast near 13.4N 82W at 1800 UTC on 5 February 2009. The Zuiderdam reported 3 m (10 ft) seas also off the Nicaraguan coast near 11.9N 81.7W at 0600 UTC on 5 February 2009. As for strong winds, Celebrity Constellation reported 38 kts winds near 14.5N 77.5W at 1000 UTC on 6 February 2009.
Eastern Pacific Ocean
Gulfs of Tehuantepec and Papagayo Gale, Storm, and Hurricane Force events
Eleven non-tropical warnings were issued by TAFB between January and April 2009 for gale, storm, and hurricane force gap winds in the eastern North Pacific Ocean. Table 2 lists these events. Of these, five occurrences peaked at gale force in the Gulf of Tehuantepec. Each of these events was associated with a cold frontal passage through the Isthmus of Tehuantepec. None of these incidents resulted in gale force winds lasting longer than two days. The Tehuantepec gap winds beginning on 31 January and 21 April were the strongest of these gale events, with winds to 45 kts observed using high resolution (12.5 km) QuikSCAT wind retrievals.
The first storm force wind event of 2009 began as a gale at 0600 UTC on 12 January and lasted 150 hours, making it the second longest period of winds of gale force or higher in the Gulf of Tehuantepec this season. The storm force event beginning 27 October 2008 lasted 18 hours longer (Cangialosi and Cobb, 2008). A broad trough over the Gulf of Mexico directed a series of Arctic air masses southward through the Isthmus of Tehuantepec during this period. Winds remained at minimal gale force through 0000 UTC 14 January when a northerly surge of Arctic air passed into the Gulf of Tehuantepec. The cruise liner Rotterdam (PDGS) reported 55 kts winds near 15.1N 94.5W at 1100 UTC on 14 January and 66 kts winds with a significant wave height of 3 m (10 ft) an hour later at 15.2N 94.9W. Winds quickly diminished, with the 1228 UTC QuikSCAT pass on 14 January indicating maximum winds to 50 kts and the subsequent pass at 0058 UTC 15 January showing a considerable reduction in the size of the wind field and maximum winds to 40 kts. Once again, winds in the Gulf of Tehuantepec hovered at minimal gale force from 0600 UTC 15 January until the morning hours of 16 January. The first report of the next increase in winds came at 1100 UTC that day when the cruise liner Coral Princess (ZCDF4) observed 63 kts winds near 15.5N 94W. The cruise liner continued to report hourly as it passed northwestward through the Gulf of Tehuantepec to 15.7N 95.4W by 1500 UTC, with wind reports ranging from 50 kts to 57 kts during that time. The final observation of winds to storm force came from the 0010 UTC 17 January QuikSCAT pass. Winds diminished below gale force by 1200 UTC 18 January.
| Onset Date | Area | Duration | Magnitude | Forcing |
|---|---|---|---|---|
| 10 Jan | Gulf of California | 48 h | Gale | Gap Winds |
| 26 Jan | Eastern North Pacific | 36 h | Gale | Low/Trough |
| 28 Jan | Gulf of California | 6 h | Gale | Gap Winds |
| 11 Apr | Gulf of California | 12 h | Gale | Downslope Winds |
A hurricane force wind event in the Gulf of Tehuantepec began as a gale at 1200 UTC on 3 February. This event overlapped with gale-force winds in the Gulf of Papagayo that began 24 hours later as a highlyamplified deep-layered trough reached the southwestern Caribbean and allowed the low-level cold air to surge farther south through Central America. QuikSCAT data showed the onset of storm force winds in the Gulf of Tehuantepec by 0038 UTC 4 February. Subsequent QuikSCAT passes revealed winds to 55 kts through 0000 UTC 7 February, but several of these passes did not fully sample the Gulf waters. The highest winds observed in the Gulf of Tehuantepec were reported by the container ship Dresden Express (DHDE). This ship observed winds to hurricane force and a significant wave height of 10 m (33 ft) near 13.8N 94.9W at 0700 UTC on 06 February. Five hours later, the same ship reported winds to 66 kts and a significant wave height of 4 m (13 ft) near 13.8N 94.9W. Other ship reports during this event included 50 kts near 15.7N 95.8W at 0000 UTC 6 February, 47 kts near 15.3N 94.8W three hours later from the cruise ship Celebrity Mercury (9HJG9), and 48 kts near 14.1N 95.7W at 0600 UTC on 6 February from the APL Egypt (A8BZ6).
Meanwhile, winds in the Gulf of Papagayo remained in the 35 to 45 kts range from 0000 UTC 4 February until 0600 UTC 7 February as indicated by QuikSCAT and several ship reports. Nine reports in this range were received by Seakeepers (KS078), a Seakeepers Automatic Mobile Station, as it traveled from 11.4N 87.1W at 0300 UTC 4 February to 10.8N 86.1W 10 hours later. On 6 February, the CMA CGM Galaxy (DDFD2) saw 35 kts winds and a significant wave height of 6 m (20 ft) near 8.4N 90.4W at 0800 UTC. The Celebrity Mercury (9HJG9) reported 41kt winds and a significant wave height of 3 m (10 ft) at 1700 UTC near 13.0N 91.0W north of the Gulf of Papagayo near the border of El Salvador and Guatemala. These gap winds were also confirmed by QuikSCAT. Three more ship reports in the 35 to 45 kts range were noted on 7 February from 0500 UTC to 1300 UTC by the Seakeepers (KS078) and the Celebrity Mercury (9HJG9) in the vicinity of 10N 85-86W before winds diminished below gale force. The Celebrity Mercury (9HJG9) also reported a significant wave height of 3 m (10 ft) at 0500 UTC 7 February near 10.9N 87.8W.
The next storm force event in the Gulf of Tehuantepec occurred from 1200 UTC 22 February to 0000 UTC 25 February. The QuikSCAT pass from 0044 UTC on 23 February revealed winds in the 50-55 kts range, the strongest observed winds of the event. At 2200 UTC that day, the ship Rickmers Shanghai (V7EE3) reported 41 kts winds and a significant wave height of 3 m (10 ft) near 14.6N 96.3W.
The only event above gale force in March occurred when north winds quickly increased from 20 kts at 0600 UTC 1 March to storm force by 1200 UTC that day, but only lasted 54 hours. There were three QuikSCAT passes (1232 UTC 1 March and 0102 and 1208 UTC 2 March) associated with this storm event that showed winds in the 50-60 kts range. Fifteen reports were recorded from the cruise liner Statendam (PHSG) as it traveled northwestward on 1 March from 14.6N 94.2W at 0900 UTC to 15.3N 95.3W at 1400 UTC. The ship reported winds to hurricane force six times between 1100 and 1300 UTC as it traversed the Gulf of Tehuantepec.
The final storm force Tehuantepec event of the season was also short lived. While winds likely reached hurricane force at some point during this event, there are no observations to confirm this assumption. Winds quickly rose above storm force before 0000 UTC 7 April, and the QuikSCAT pass from 0026 UTC on 7 April noted maximum winds to 63 kts on the northwestern edge of the wind field. The cruise ship Celebrity Infinity (9HJD9) traveled northwest though this area several hours later, reporting winds to 60 kts and a significant wave height of 3 m (10 ft) at 1100 UTC near 14.9N 94.7W. Two hours later the same ship reported winds to 60 kts with a significant wave height of 6 m (20 ft) near 15.1N 95.0W. The ship Chaconia (ONCA) traveling southeast near 14.3N 96.1W at 1300 UTC, approximately 80 nm south of the Celebrity Infinity (9HJD), reported 37 kts winds and a significant wave height of 4.5 m (15 ft), with a second report at 1700 UTC near 13.8N 95.6W of 47 kts winds and a significant wave height of 8 m (26 ft). Figure 8 shows the positions and reports of these two ships relative to the Gulf of Tehuantepec at 1300 UTC 7 April. These ships were also reporting sea surface temperature (light blue). Note the sea surface temperature observed by the Celebrity Infinity (9HJD), which lied in a region of strong upwelling due to the strong offshore flow, was 10°F cooler than the Chaconia (ONCA).
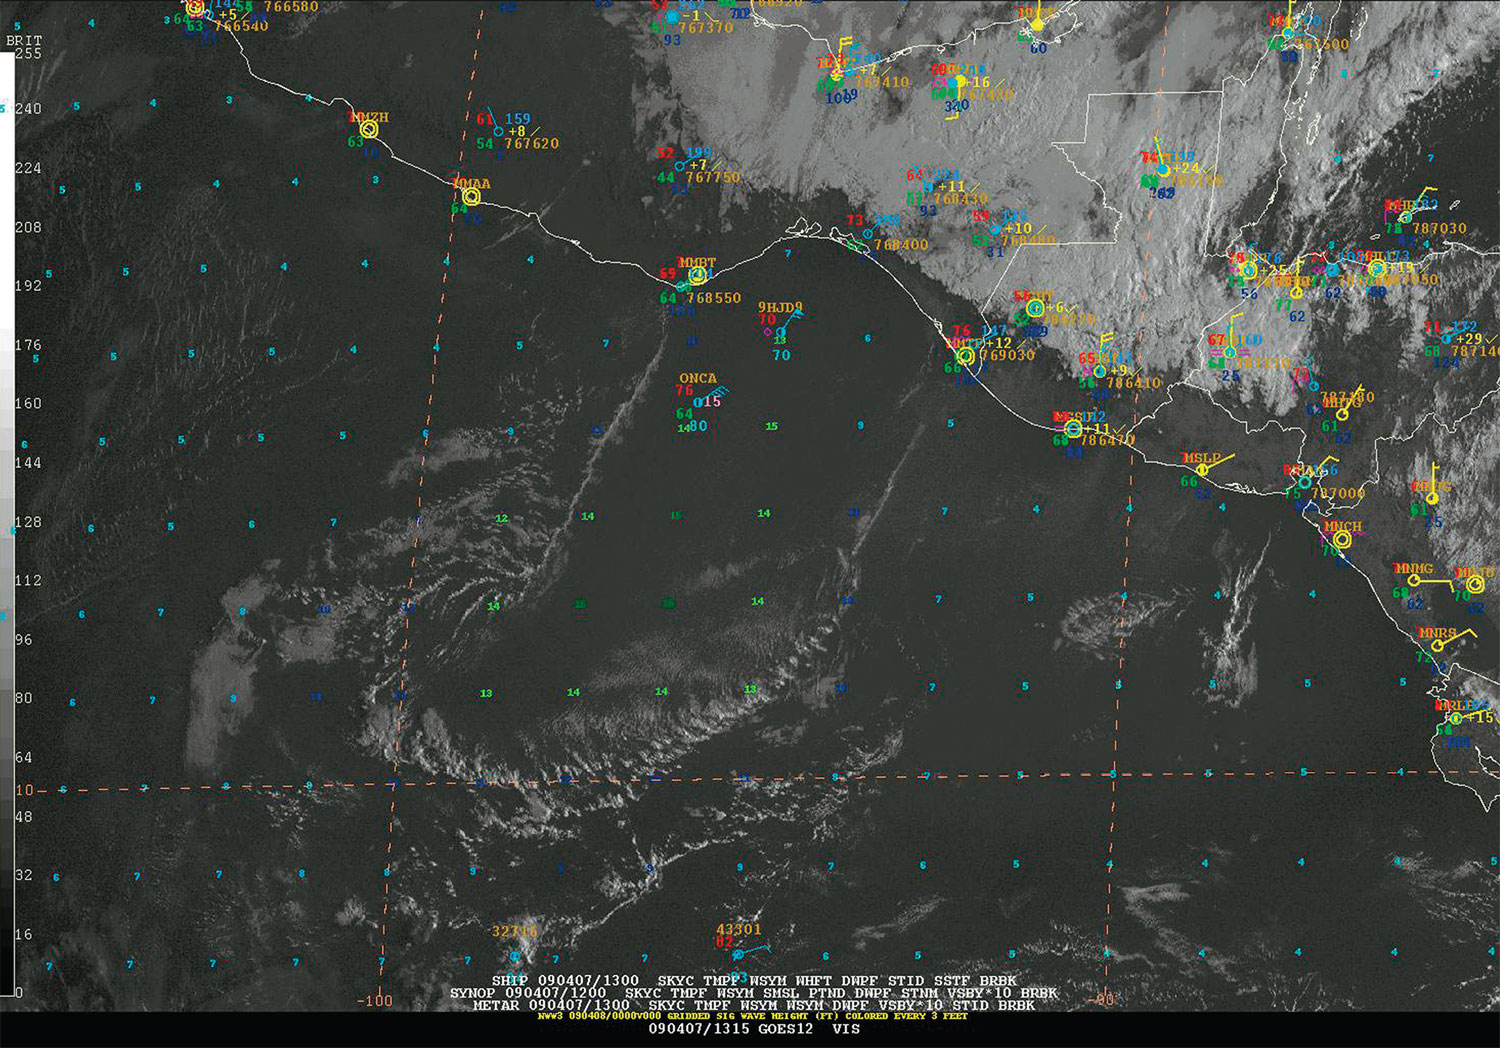
Figure 8. A 1 km visible image from GOES-E at 1315 UTC 7 April, land and ship based observations from 1300 UTC 7 April. The significant wave height observation is in pink and sea surface temperature observations are in light blue from the Celebrity Infinity (9HJD9) and the Chaconia (ONCA).
La Cumbre Volcano Eruption
The La Cumbre volcano on Isla Fernandina in the Galapagos Islands erupted in mid April, triggering ashfall advisories in both the eastern North and South Pacific High Seas Forecasts produced by TAFB. Winds were generally 10 kts out of the southeast during the time of the eruption. Figure 9 below highlights the expansive plume of ash northwest of the Galapagos Islands on 14 April as observed by the Moderate Resolution Imaging Spectroradiometer (MODIS) on NASAs Terra Satellite. Ashfall advisories were initiated at 0000 UTC 14 April. By 1200 UTC 17 April, the government of Ecuador reported that the volcanic plume contained vapor and gases with no significant ash.
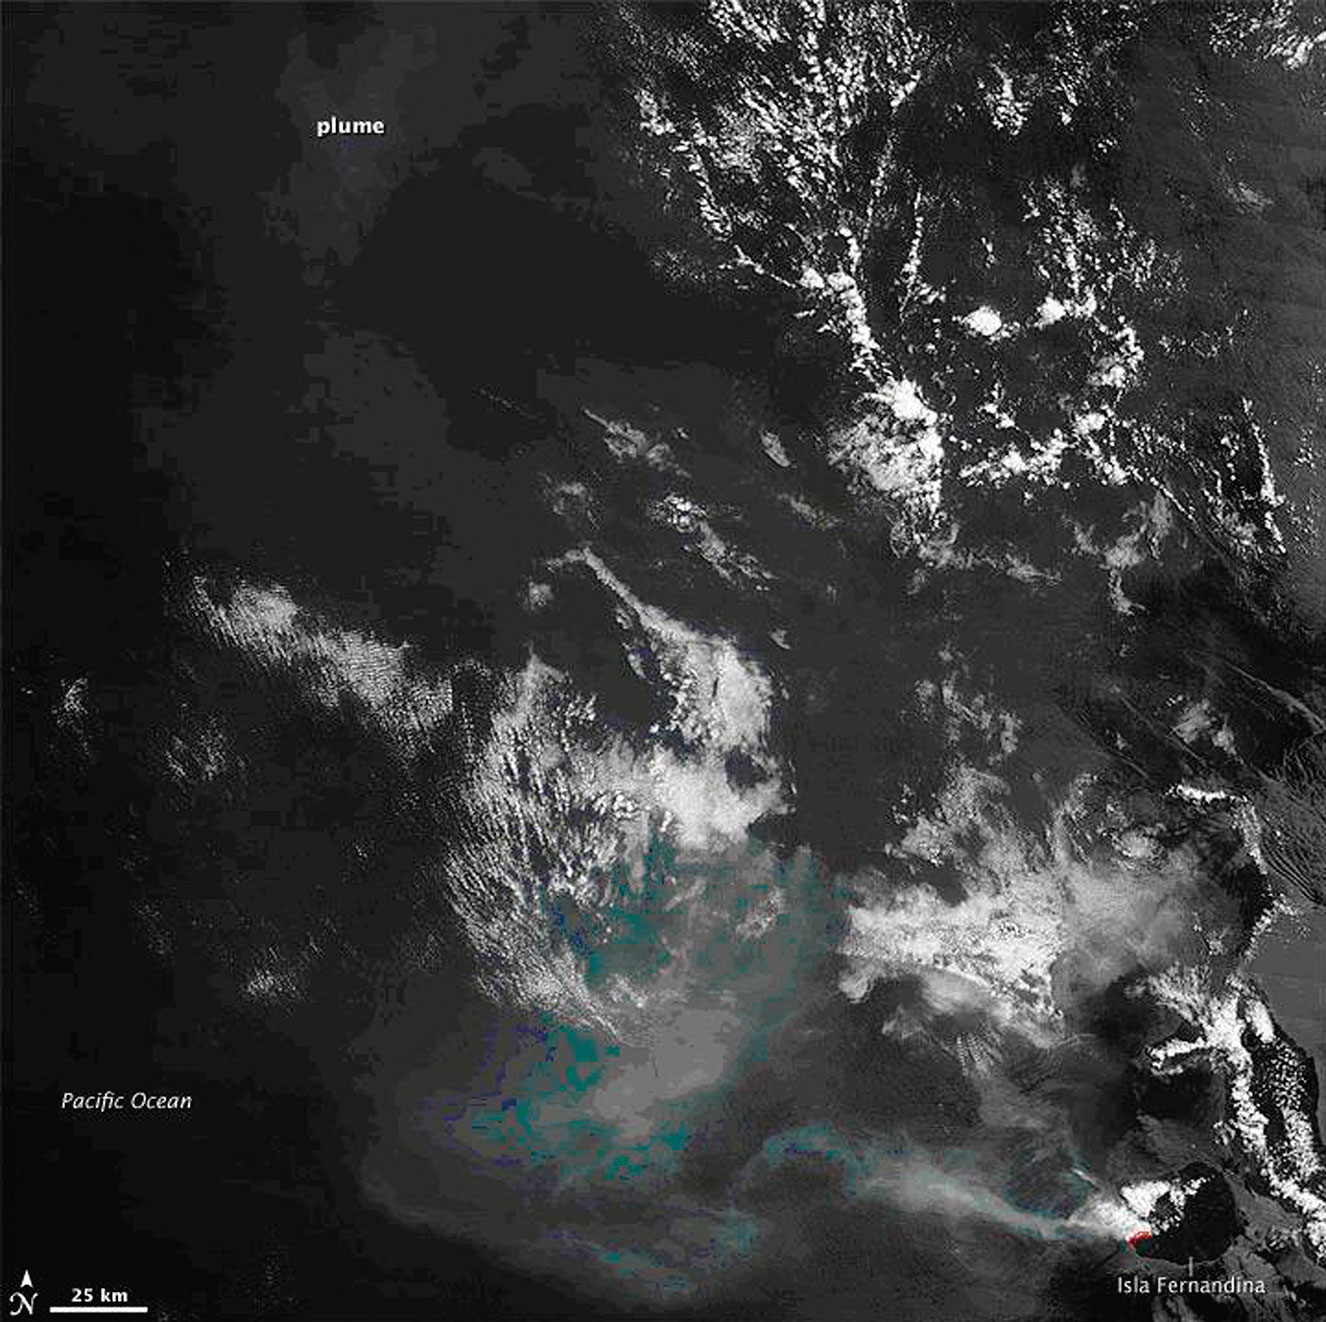
Figure 9. A NASA Terra satellite image of the Galapagos Islands taken on 14 April 2009 showing the active La Cubre volcano (red) on Isla Fernandina and the plume of volcanic ash and gases extending northwest of the Galapagos Islands.
A Unique Gale Event in the Gulf of California
A rare meteorological set up resulted in gale force winds in the northern Gulf of California during the early morning of 11 April 2009. This event featured a deep trough over the southwestern U.S. associated with a dominant surface low over the southern Rockies and a much weaker surface low west of Baja California. The latter low was weakening while migrating eastward toward the Mountains (Figure 10).
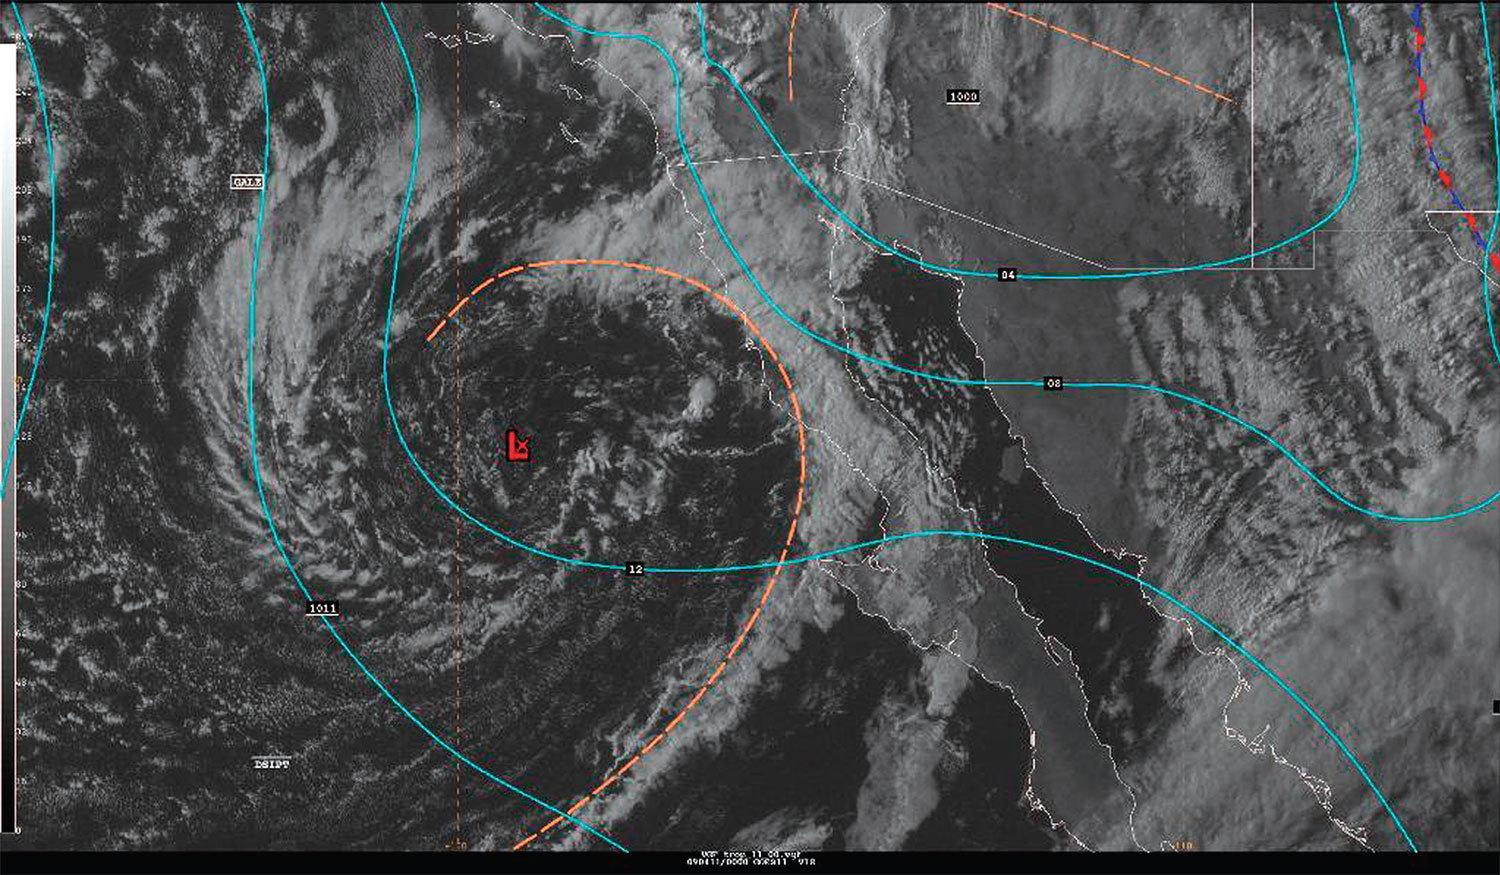
Figure 10. Surface analysis and visible satellite imagery from 00Z 11 April 2009. (Click to enlarge)
While this low was weakening as its upper support was lifting northeast into the southwest United States, forecasters noticed a substantial amount of deep layer dry air wrapping around the base of the associated middle- and upper-level trough from water vapor imagery (Figure 11).
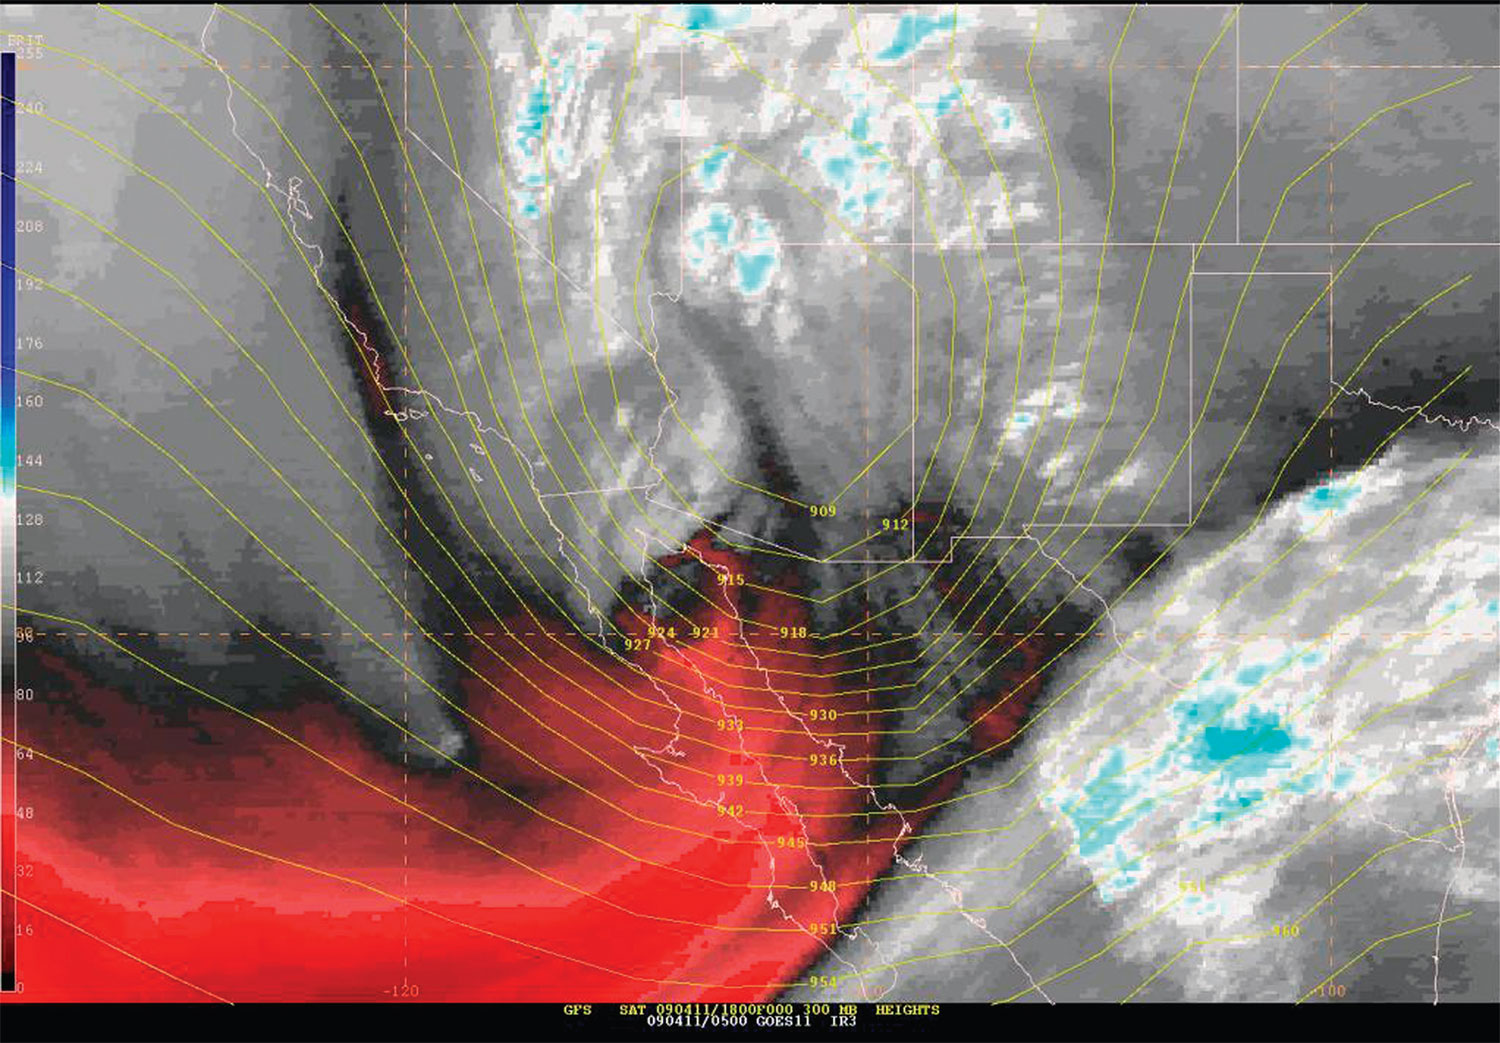
Figure 11. Water vapor imagery and 500 hPa heights at 05Z 10 April 2009. (Click to enlarge)
The pocket of dry air, as seen as red in Figure 12, was punching into the central Baja California mountains. This dry air proved to be critical in the development of a gale wind event, as the denser and drier air accelerated down the eastward (leeward) slopes of the Baja California mountains. The preexisting spin in the atmosphere within the broad, weak low west of the mountains interacted with this downsloping flow to give birth to a much smaller scale, yet more intense low, in the northern Gulf of California, known as a meso-low. This meso-low became readily apparent in the northern Gulf of California by 06Z 11 April 2009 from shortwave infrared satellite imagery as seen in Figure 13.
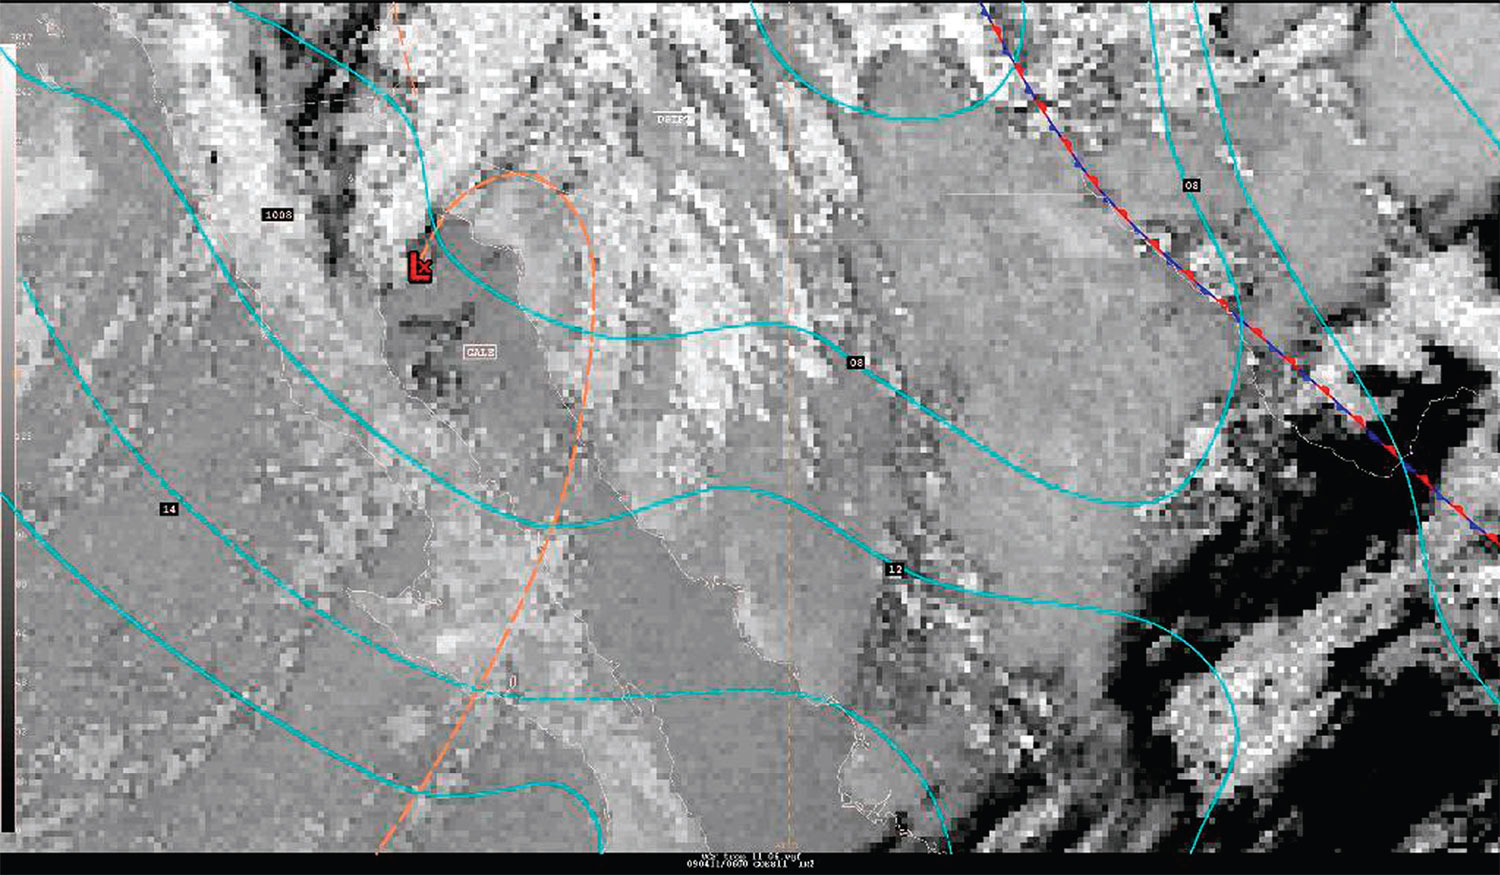
Figure 12. Surface analysis and shortwave infrared satellite imagery from 06Z 11 April 2009.(Click to enlarge)
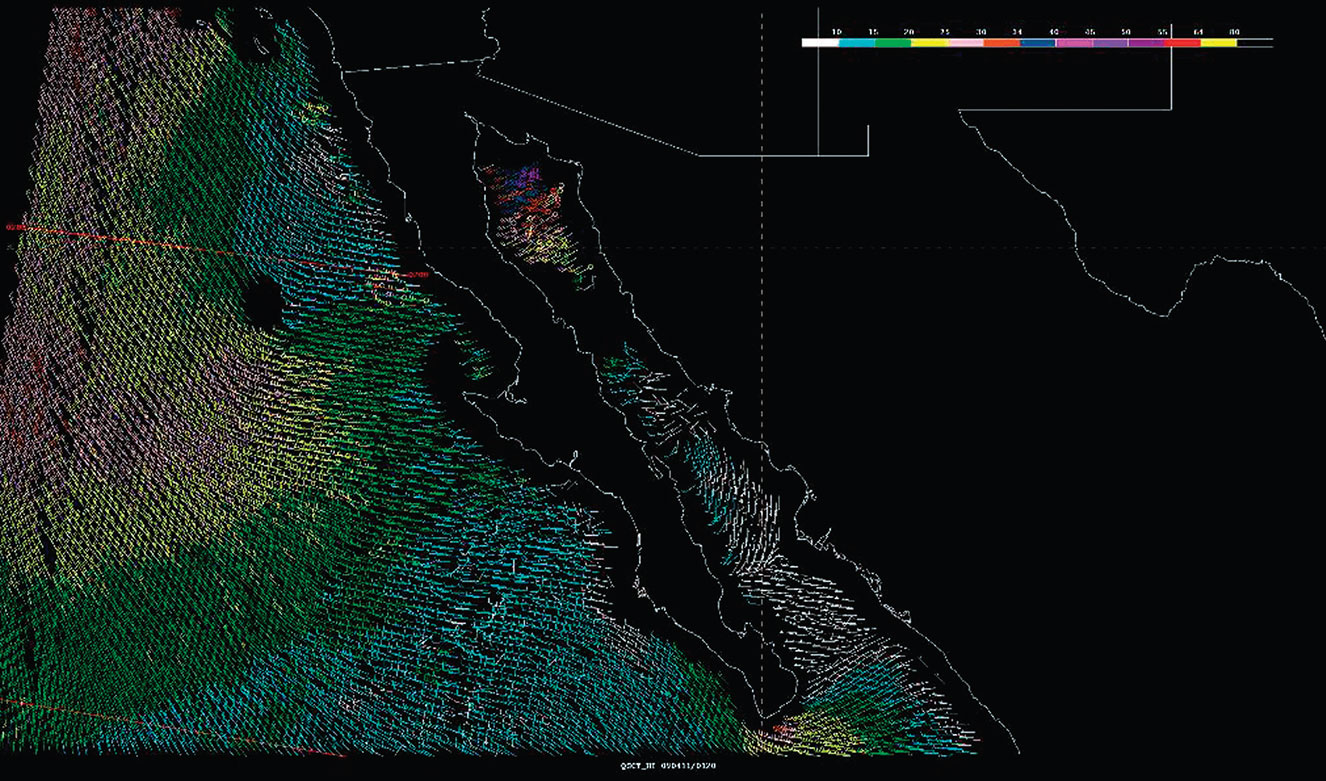
Figure 13. 02Z QuikSCAT pass from 11 April 2009, with blue and purple barbs in the northern Gulf of California depicting gale force winds. (Click to enlarge)
Figure 12 depicts the comma-head pattern in the low level clouds over the northern Gulf, with the meso-low centered near the apex of the comma. A jet of mid-level dry air already descending down the Baja mountains was likely being further accelerated by this deepening surface low. Likewise, the strengthening jet was generating a stronger low resulting in a stronger pressure gradient, as well as stronger surface winds. Gale force winds, with speeds of 35-45 kts, were evident in the high resolution QuikSCAT pass around 02Z 11 April 2009 as seen in Figure 13. A gale warning was posted based on satellite imagery and this QuikSCAT pass, and ended once the low had moved inland over the Sierra Madre Occidentals and the pressure gradient in the northern Gulf of California slackened.
Other Gales in the Eastern North Pacific Region
Table 3 provides an overview of gale wind events to have affected the eastern North Pacific region that have not occurred in the Gulfs of Tehuantepec or Papagayo. Rather than providing a brief summary of each event, we have decided to discuss in detail a few of the more significant events. Readers are encouraged to access the archive of the TAFB high seas forecasts directly at ftp://ftp.nhc.noaa.gov/pub/products/ marine/high_sea/ if the event of interest is not discussed.
References
Cangialosi, John and Hugh Cobb, Tropical Atlantic and Tropical East Pacific Areas September through December 2008. Mariners Weather Log, Vol. 53, No. 1, April 2009.
Back to top