Tropical Atlantic and Tropical East Pacific Areas
January through April 2007
Robbie Berg, Mark Willis, and Hugh Cobb
Tropical Analysis and Forecast Branch, National Hurricane Center, Miami, Florida
Introduction
The winter/early spring season over the tropical and subtropical Atlantic Ocean was marked by numerous episodes of cold fronts sweeping through the area with marginal gale force wind events occurring primarily along the northern part of the Tropical Analysis and Forecast Branch (TAFB) area of responsibility. No events reached storm force or even strong gale, which is less active than would be expected this time of year. Twenty gale warnings were issued for the Atlanticten for the open Atlantic, three for the Caribbean, and five for the Gulf of Mexico. Two of the gale warnings issued for the Atlantic waters never materialized, and several other events were difficult to verify due to lack of observations.
The January through April time period proved to be very active for non-tropical gale and storm force events in the TAFB Eastern North Pacific area. Sixteen warnings were issued by the TAFB in the Pacific area. The majority of these events (75%) occurred in the Gulf of Tehuantepec, which included 12 gale force events of which six reached storm force. The remaining events were associated with strong trade winds during 5-6 Jan, a Gulf of California northerly wind event during 6-8 Jan, a prefrontal southwesterly wind event that affected the far northwestern portion of the TAFB area during 3-5 Feb, and a Gulf of Papagayo gap wind event during 19-20 Feb. Figure 1 depicts a timeline which shows the distribution of gale warnings for the Atlantic, Caribbean, Gulf of Mexico, and Eastern North Pacific. In addition to the normal gale and storm force events, a significant long period south/southwesterly swell event impacted the Eastern North Pacific area in early to mid April which was responsible for at least two deaths.
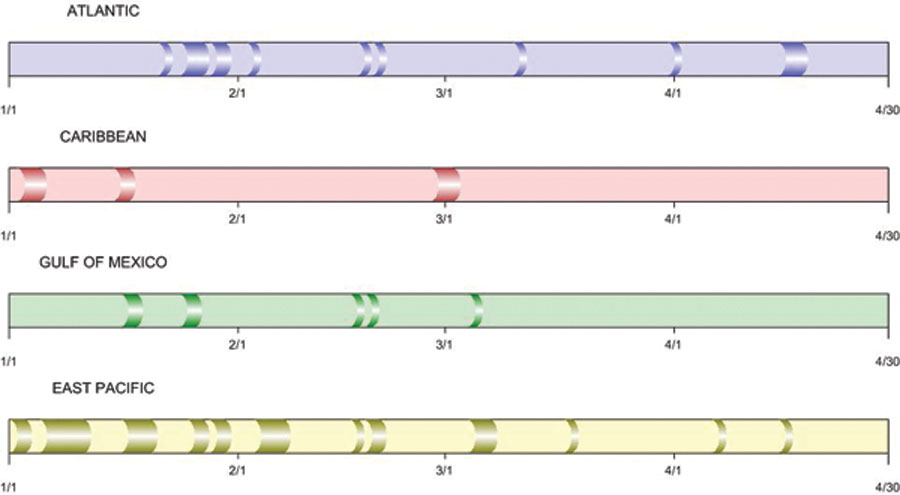
Figure 1. Timeline showing the distribution of gale warnings for the Atlantic, Caribbean, and Gulf of Mexico.
(Click the image to enlarge.)
Atlantic, Caribbean, and Gulf of Mexico
Atlantic
With fairly tranquil weather in control across the tropical Atlantic for the first part of January, the first gale event did not occur until 21 Jan. Most gale events in the Atlantic occurred from late January through mid February, but there were a few isolated events in March and April. The longest gale event actually occurred in April, lasting for three days. Table 1 shows the list of gale events occurring over the tropical Atlantic waters from January through April.
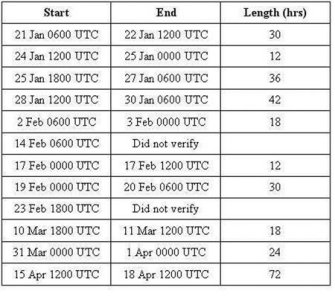
Table 1. Gale warnings issued for the tropical and subtropical Atlantic Ocean between January and April 2007.
The first gale event was associated with a cold front that initially moved off the U.S. coast 18 Jan and moved east, extending from the central Atlantic westward to Florida by 21 Jan. Two ships, the Chiquita Schweiz (C6KD9) and the MSC Lausanne (DCRN2), reported winds of 35 kts behind the front as it approached 40W at 0600 UTC 22 Jan. The MSC Lausanne also reported winds of 45 kts west of the front at 1200 UTC, but that value may have been a little too high based on the surrounding observations.
The second gale event occurred with another cold front, which moved off the U.S. coast on 22 Jan. Winds increased to gale force on 24 Jan as the front moved across the central Atlantic near 50W. Although this was a relatively short-lived gale, one ship, the Tristan (SKWI), did report westerly winds of 35 kts just behind the front at 1200 UTC 24 Jan. QuikSCAT data from 24 Jan indicates that the strongest winds associated with the front were in a narrow band just ahead of the boundary.
A third cold front with an area of low pressure moved just east of Florida early on 25 Jan, with gale conditions developing later that afternoon when the low was near 31N70W with a pressure of 1006 hPa. The ship Tropic Atlantic (V2OW4) reported southwesterly winds of 30 kts just south of the low at this point, justifying the marginal gale event. The low deepened quickly as it moved northeast of the subtropical waters, plummeting to 952 hPa just off Newfoundland by the time the gale force winds moved out of the TAFB area of responsibility. No other ships in the area reported sustained winds to 35 kts, but a QuikSCAT pass during the morning of 26 Jan indicated that the southern extent of the swath of gale force winds brushed across the subtropical west Atlantic waters (Figure 2).
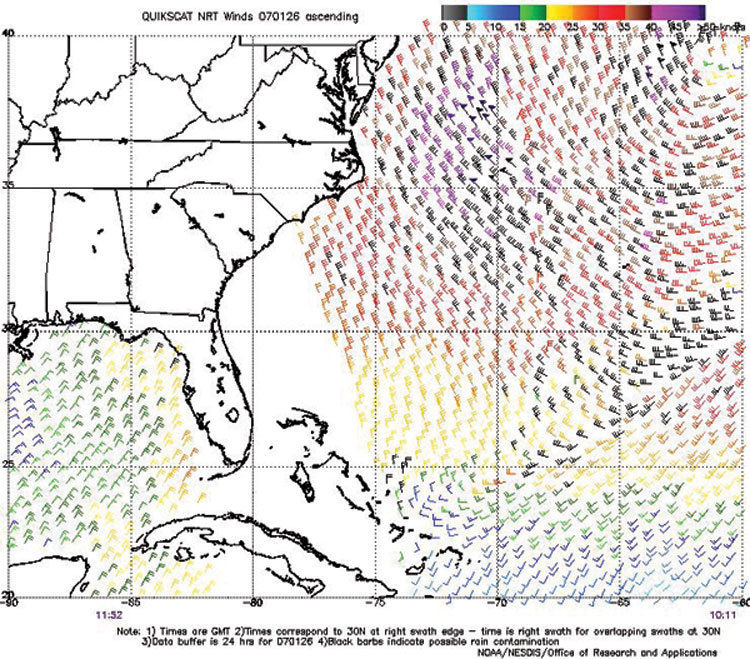
Figure 2. QuikSCAT pass from 1011 UTC January 26 2007 showing strong post-frontal northwesterly winds off the East Coast.
(Click the image to enlarge.)
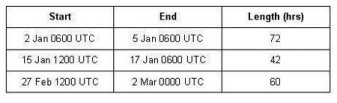
Table 2. Gale warnings issued for the Caribbean Sea between January and April 2007.
The fourth gale event of January occurred as an area of low pressure moved across northern Florida during the morning of 28 Jan and dragged a cold front across Florida and the western Atlantic. Again, there were no reports of gale force winds from ships within the TAFB area of responsibility, but QuikSCAT data showed the strongest winds occurring near the low on 28 Jan and then another swath of gale force winds brushing the west Atlantic waters on 29 Jan on the back side of the low.
The first gale event of February began as a frontal boundary, and a series of areas of low pressure moved off the southeast U.S. coast late on 1 Feb. At 0600 UTC 2 Feb, the ship Tropic Atlantic (V2OW4)the same ship which reported near gale force winds during the 25-27 Jan eventreported southwesterly winds of 40 kts southeast of the front offshore the coast from Jacksonville, FL. A QuikSCAT pass the morning of 2 Feb verified the gale by showing an area of low pressure off the Delmarva Peninsula with a swath of at least 35 kts southwesterly winds extending northeast of the Florida coast (Figure 3).
Another short-lived gale event began 0000 UTC 17 Feb as the pressure gradient increased ahead of a cold front moving across the central Atlantic. All ships reporting gale force winds stayed north of the area, and QuikSCAT showed only marginal gales brushing 31N.
A cold front moved off the U.S. coast early on 18 Feb with winds increasing to gale force by the evening, when a 1002 hPa low was located just west of Bermuda. The ship Iver Excel (PCBU) reported westerly winds of 35 kts at that time as the front was passing its location. By 1200 UTC 19 Feb, the ship Rhine Forest (V7EI9) reported westerly winds of 40 kts, also as the front was passing its location. A second re-inforcing cold front began to catch up with the first front later in the day of 19 Feb and caused the gale force wind field to spread farther westward with the adjusted pressure gradient. By afternoon, the ship Pacific (PGQI) reported northwesterly winds of 40 kts just behind the second front. The Conti Emden (A8IV9) reported southwesterly winds of 40 kts at 0000 and 0600 UTC 20 Feb.
The first gale event of March began 1800 UTC 10 Mar with a complex area of low pressure just northeast of the Bahamas which was connected to a warm front extending eastward across the central Atlantic. The low did not deepen much lower than about 1012 hPa as it moved northeast, and the gale force winds were limited to a narrow band just north of the warm frontwhich lifted north of the area during the day 11 Mar. No ships reported gale force winds in the vicinity of the low, but QuikSCAT verified marginal gales just north and northwest of the developing low.
Another area of low pressure over the central Atlantic produced gale force winds from 0000 UTC 31 Mar through 0000 UTC 1 Apr, but, again, there were no ship reports of winds higher than 30 kts.
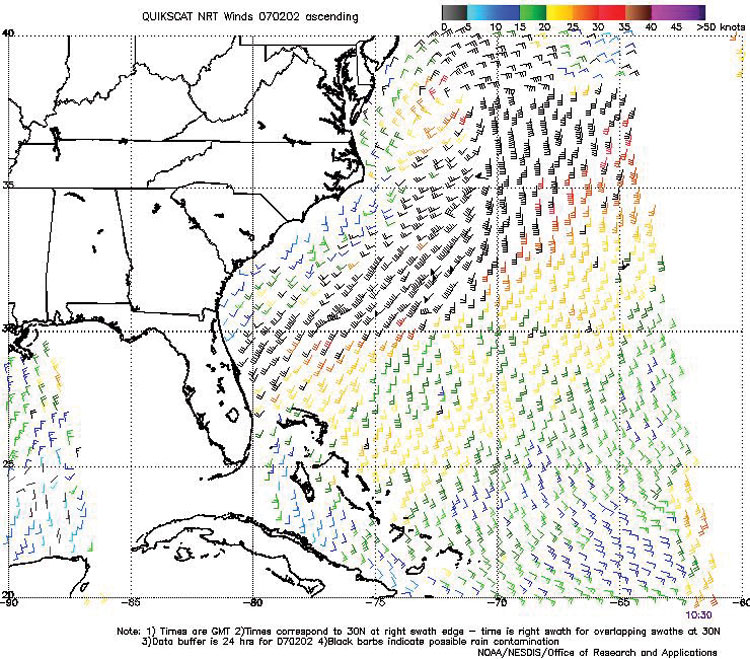
Figure 3. QuikSCAT pass from 1030 UTC February 2 2007 showing an area of low pressure off the Delmarva Peninsula with a band of pre-frontal southwesterly winds to gale force reaching southward to the subtropical waters.
(Click the image to enlarge.)
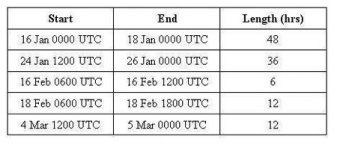
Table 3. Warnings issued for the Gulf of Mexico between January and April 2007.
The last gale event of the period began in mid-April with a fairly strong springtime area of low pressure, which deepened over the southeast U.S. on 15 Apr. As the low moved northward along the east coast of the U.S. and became a fairly significant NorEaster, winds continued to increase over the waters east of Florida. Buoy 41010 east of Cape Canaveral reported maximum sustained winds of 33 kts with gusts to 41 kts during the period from late on 15 Apr to early 16 Apr as the associated cold front moved by. The highest seas at the buoy occurred near 0800 UTC 16 Apr, reaching a maximum value of 5.8 m (19 ft). Figure 4 depicts the QuikSCAT pass very close to this time and shows the strong wind field off the entire U.S. East Coast. This was the longest-lasting gale event during the four months between Jan and Apr, lasting until 1200 UTC 18 Apr, for a total of three days until the cold front reached the central Atlantic.
Caribbean
Three separate gale events occurred over the south central Caribbean between early January and early March in the usual higher wind regimes off the Colombian coast. All these events were caused by an increase in pressure gradient over the Caribbean due to strong high pressure over the western Atlantic and low pressure over Colombia.
The first gale event began 0600 UTC 2 Jan and lasted for three days. Several ships, including the Tineke (PJOX) and the Cap Finisterre (DACF), repeatedly reported winds of 35-40 kts. QuikSCAT also verified this event with a sizeable swath of strong winds extending between Jamaica and Colombia, highest near the Colombian coast. The second event began 1200 UTC 15 Jan and lasted for almost two days. Two ships, the Shanghai Express (DGSE) and the Iver Excel (PCBU), both reported winds to 35 kts off the Colombian coast. More than a month went by before the final gale event occurred, beginning 1200 UTC 27 Feb and lasting for 2 ½ days. Numerous ship reports of 35-40 kts winds were received from the Volendam (PCHM), the Cap Flinders (A8IY9), the Westerdam (PINX), and the Horizon Purdue (WJBJ).
Gulf of Mexico
The first gale event of 2007 within the Gulf of Mexico was initiated by a cold front which moved off the Texas coast during the morning hours of 15 Jan. Winds increased to gale force behind the front over the southwestern Gulf by 0000 UTC 16 Jan as strong high pressure over the Southern Plains surged southward along the Mexican coast. The gale event lasted for two days, but there were no available ship or buoy observations during this period. One QuikSCAT pass the morning of 17 Jan did, however, confirm a swath of strong northerly winds over the western Gulf in the post-frontal environment. Incidentally, Veracruz, Mexico (along the coast), did report sustained winds of 30 kts with gusts to 40 kts just before sunrise 17 Jan, so it is likely that winds were at least 5-10 kts higher just offshore.
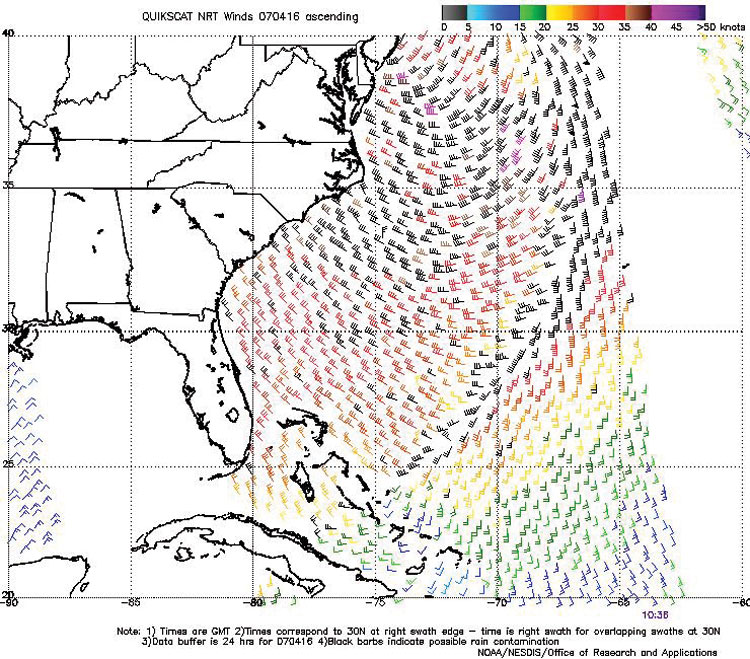
Figure 4. QuikSCAT pass from 1036 UTC Apr 16 2007 showing gale force winds extending from a NorEaster located near the New Jersey coast southward to the waters east of Florida.
(Click the image to enlarge.)
By 20 Jan, another storm system began developing over the western Gulf of Mexico along the old frontal boundary from the previous event. Low pressure developed along the stationary front, but a more pronounced circulation developed as a second surge of high pressure moved south from the Southern Plains, forcing the front southward across the Gulf as a cold front. The gale began on 1200 UTC 24 Jan as the front began to surge south. The area of low pressure then moved eastward and reached South Florida by 25 Jan, but all gale force winds remained over the southwestern Gulf where the gradient was strongest. Again, QuikSCAT was the only available measurement tool which showed that a gale had occurred over this area.
The next three gale events were short-lived in nature (less than a day) and were generally poorly forecasted. The 16 Feb and 4 Mar events both occurred behind cold fronts over the southwestern Gulf in the usual regime of increased pressure gradient. However, the event beginning on 18 Feb occurred over the northeastern Gulf as a cold front swept across the area with a stronger eastward (rather than southward) push. During the morning, the oil rig Deepwater Horizon (V7HC9), drifting buoy 42362, and the cruise ships Carnival Conquest (3FPQ9) and Carnival Ecstasy (H3GR) all reported winds of 40-50 kts behind the front (all of which were probably a little high due to anemometer elevation). Additionally, the East Gulf buoy 42003 reported maximum sustained winds of 32 kts with gusts to 40 kts on 18 Feb. Figure 5 shows the National Weather Service surface analysis over the Gulf of Mexico from 1200 UTC 18 Feb with several reports of winds to gale force behind the cold front.
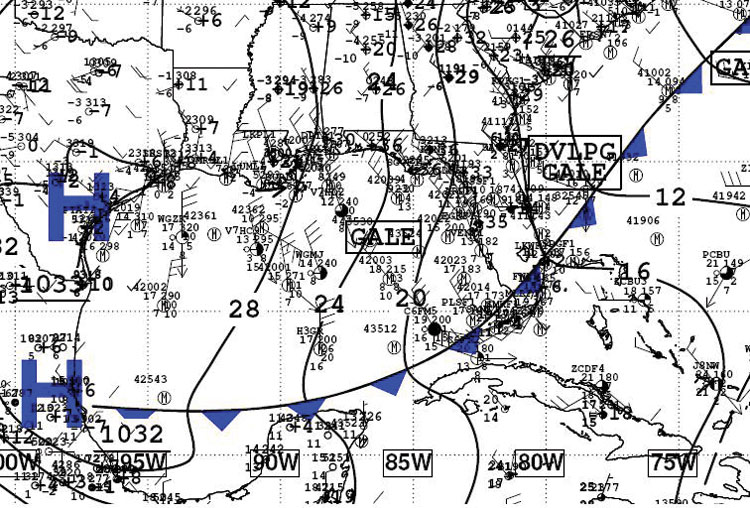
Figure 5. National Weather Service surface analysis from 1200 UTC 18 Feb 2007 showing winds to gale force being reported west of the cold front moving across Florida.
(Click the image to enlarge.)
Eastern North Pacific
Gulf of Tehuantepec Events
The 2006-2007 Gulf of Tehuantepec gale season was very active with a total of 20 gale events between late October and mid April. Of these 20 events, a record breaking 12 reached storm force as verified by high resolution (12.5 km) QuikSCAT data and ship reports. An average Tehuantepec season has 15 gale events of which two reach storm force (Cobb et al., 2003). The unusual large number of storm events this season also led to a record breaking number of ships reporting storm force winds (Figure 6). The six reporting ships included the Seabulk America (WWYY), Leverkusen Express (DEHY), Ryndam (PHFV), Hoechst Express (DHER), Kobe Express (DGSE), and ZIM Japan (9HAC8). As always, the ship data proved to be invaluable when making forecast decisions at the TAFB.
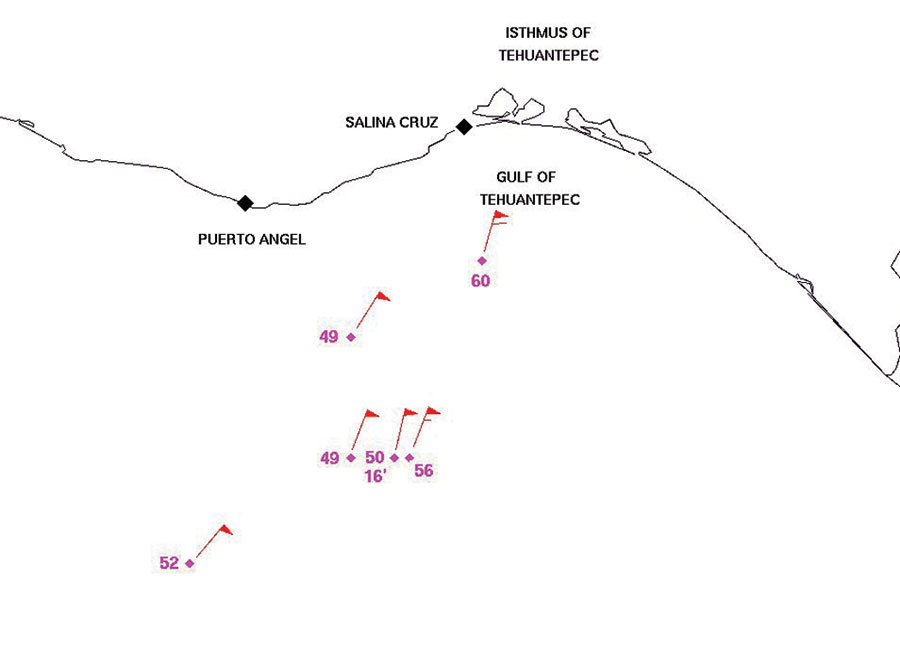
Figure 6. Location of the record breaking six ships reporting storm force or greater winds during the 2006-2007 Gulf of Tehuantepec season.
(Click the image to enlarge.)
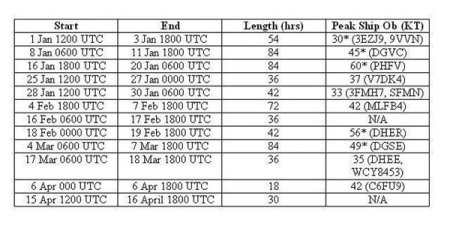
Table 4. Gale warnings issued for the Gulf of Tehuantepec between January and April 2007. Asterisk next to wind represents storm force event as verified by QuikSCAT and/or ship observations. Corresponding ship calls signs denoted in parentheses.
January through April 2007 produced 12 gale events in the Gulf of Tehuantepec of which six reached storm force. Details of these events are seen in Table 4. One of the most significant of these Gulf of Tehuantepec storm events occurred during 4-7 Mar. The culprit was the usual suspect of a strong area of continental high pressure that built into Texas and Mexico behind a cold front that traversed the Gulf of Mexico. At 1800 UTC 5 Mar the National Weather Services Unified Surface Analysis depicted a 1036 hPa high pressure center over northeast Mexico, which was building behind a cold front pushing through the northwest Caribbean (Figure 7).
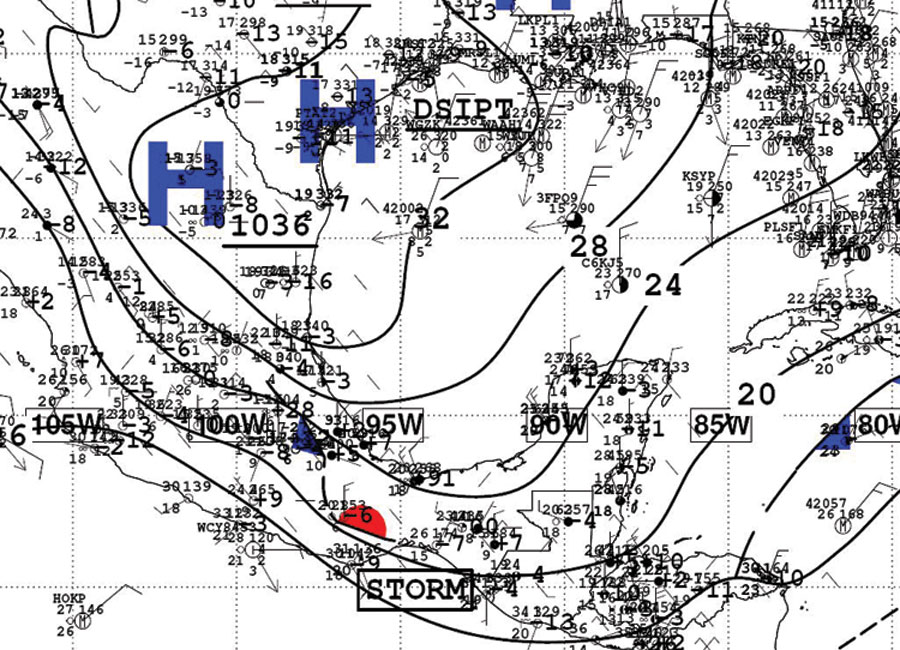
Figure 7. National Weather Service surface analysis from 1800 UTC 5 Mar 2007 showing strong high pressure building behind a cold front moving into the northwest Caribbean.
(Click the image to enlarge.)
Meanwhile, a remnant stationary front was hung up along the eastern slopes of the Sierra Madre range. A high resolution QuikSCAT pass at 0404 UTC 6 Mar revealed a widespread storm force event (Figure 8). A similar scenario was evident in an earlier QuikSCAT pass from 1438 UTC 5 Mar. In addition, three ship observations of 45-50 kts winds were reported during the event: two from the Seabulk Courage (WCY8453) and one from the Kobe Express (DGSE).
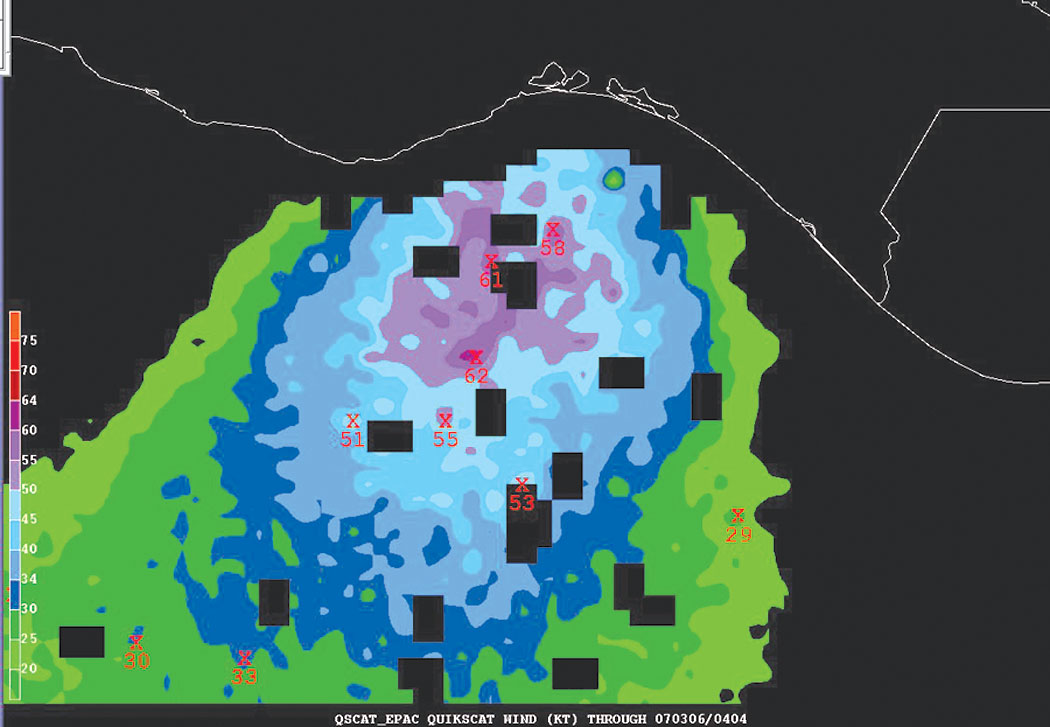
Figure 8. Gridded QuikSCAT pass from 0404 UTC 6 Mar 2007 showing a widespread storm force event in the Gulf of Tehuantepec.
(Click the image to enlarge.)
The forecast problems associated with Gulf of Tehuantepec events often stem from the fact that models typically underestimate the 10-m wind speeds that funnel through the Chivela Pass. Thus, it is often necessary to look at model output a little higher up in the boundary layer. For this particular event, the NAM 975 hPa winds seemed to handle the situation best when compared to the high resolution QuikSCAT data (Figure 9). Another useful forecast tool during these events is using upstream sea level pressure values as a clue for the expected wind strength. Cobb et al. (2003) showed that the average sea level pressure at Brownsville, Texas, during Gulf of Tehuantepec storm events is 1032.8 hPa. The surface analysis in Figure 7 shows that Brownsville is included in the 1032 hPa isobar and therefore meets the climatological criterion for a possible storm force event in the Tehuantepec.
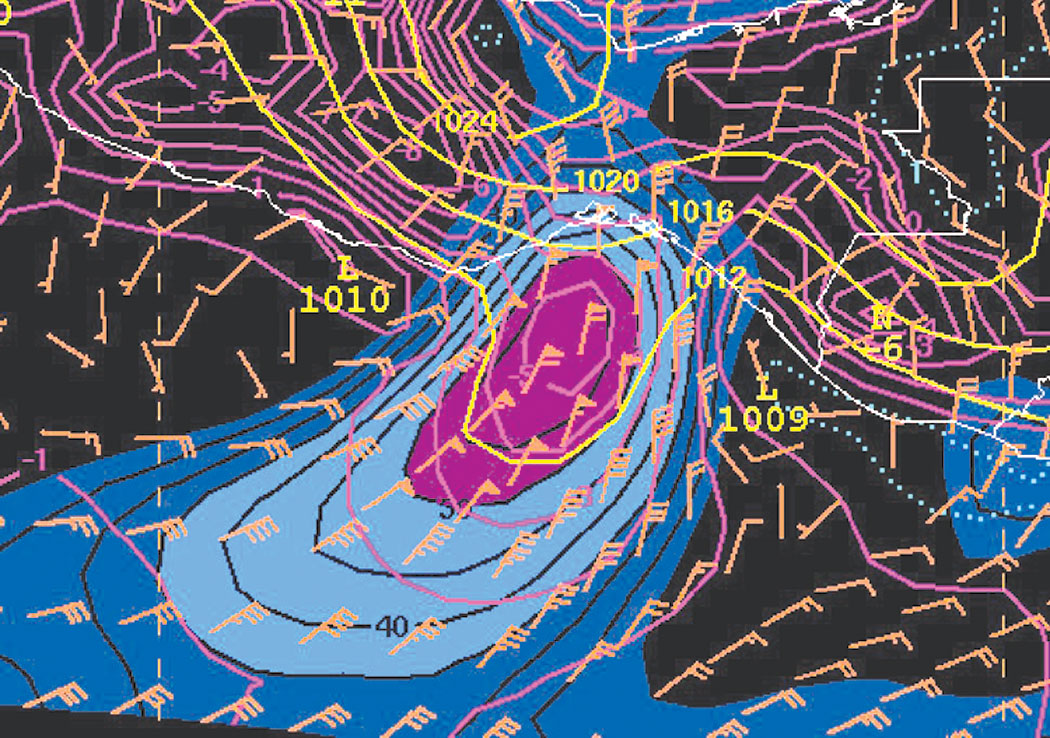
Figure 9. NAM 975 hPa wind, 975 hPa-surface lapse rate, and sea level pressure 12 hr forecast valid 0000 UTC 6 Mar 2007.
(Click the image to enlarge.)
Promising research at the National Hurricane Center was done with Tehuantepec events during the recent cool season, which runs from October 1 through April 30. Brennan et al. (2007) used high resolution QuikSCAT retrievals to show that the NAM was generally superior in comparison to the GFS model in detecting Gulf of Tehuantepec gale events during the 2006-2007 season (Figure 10). The exception was in the very short-term forecast range (12-hr), where the GFS 30m winds proved superior. This information will undoubtedly be useful in forecasting future Tehuantepec events at the TAFB. Unfortunately, Brennan et al. (2007) also showed that the models had a poor Probability of Detection (POD) and fairly large low biases for Tehuantepec storm force events.
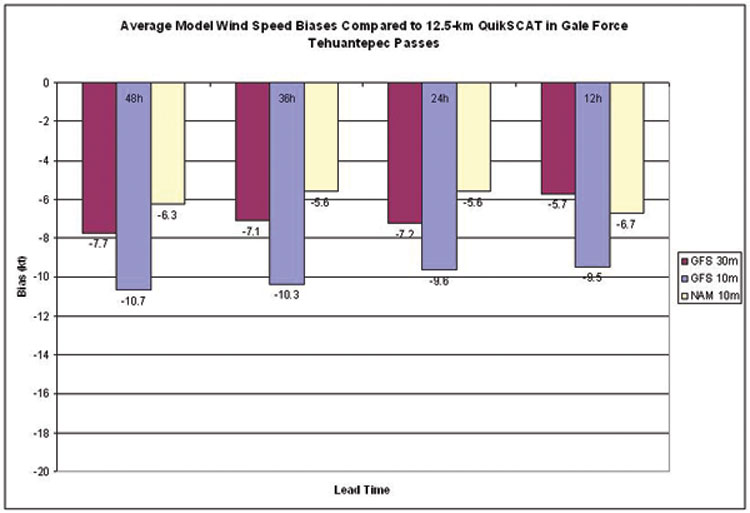
Figure 10. Average model wind speed biases compared to 12.5-km QuikSCAT in gale force Tehuantepec events. Replicated with permission from Brennan et al. (2007).
(Click the image to enlarge.)
Large Pacific Swell Event Early to Mid April
A large south to southwest swell event propagated through the TAFB Eastern Pacific area during the second week in April and produced significant coastal impacts along Central America, Mexico, and the U.S. West Coast. The swell was associated with an intense storm system in the Southern Hemisphere during early April that interacted with an area of high pressure to its west. This set up a significant fetch of storm to borderline hurricane force winds aimed at Central and North America. A QuikSCAT pass from 1414 UTC 3 Apr revealed a fetch of 45-65 kts south to southwest winds, strongest south of 45S between 120W and 135W (Figure 11).
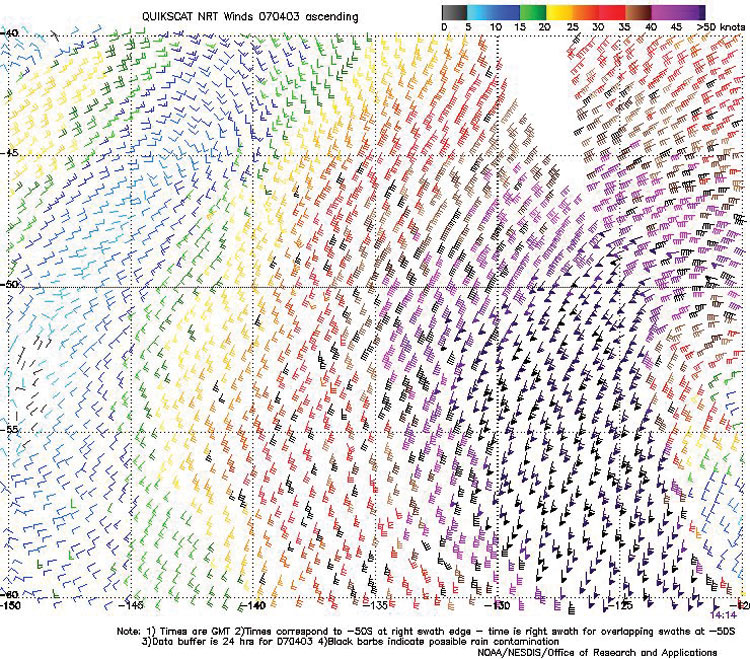
Figure 11. QuikSCAT pass from 1414 UTC 3 Apr 2007 showing large fetch of storm to near hurricane force winds deep in the Southern Hemisphere associated with large, long period swell event.
(Click the image to enlarge.)
Since this storm occurred during the Southern Hemisphere autumn, after the warm summer months, the ice pack near Antarctica was much less extensive than during the peak winter or early spring months (Figure 12). This promoted a longer effective fetch of the storm force southerly winds which aided in the extremely large seas upwards of 12-14 m (40-45 ft). The icepack around Antarctica would have been more of a limiting factor on the fetch if it occurred during the Southern Hemisphere winter or spring. The very long fetch of high winds also produced extremely long period ocean waves. The end result was 2-3 m (6-10 ft) deep water swells in the 17-25 second band that moved through the TAFB area during 7-11 Apr. Due to the very long periods associated with this swell, the surf heights were able to grow much larger than their deep water heights (3.5-4.0+ m (12-15+ ft)) through nearshore wave processes such as shoaling and refraction. The large surf unfortunately led to at least two deaths in Central America (Mendez, 2007).
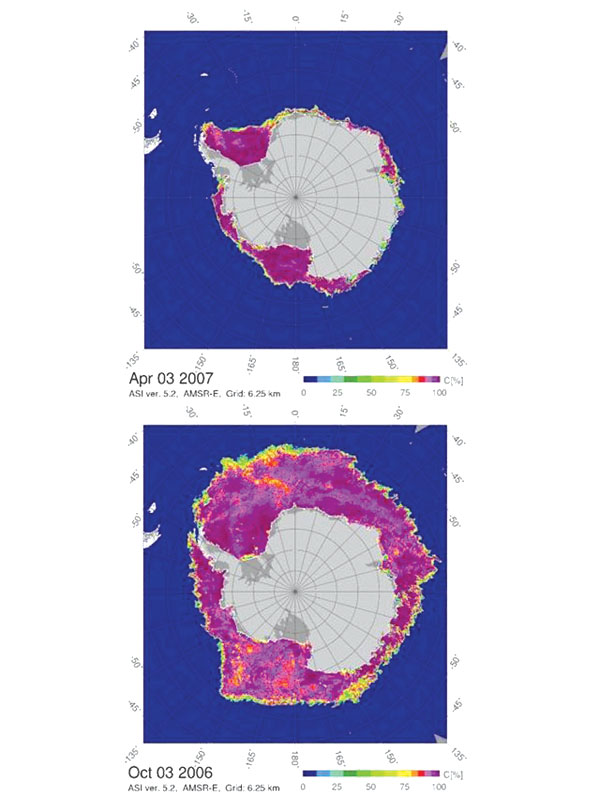
Figure 12. AMSR-E percentage of Antarctic ice concentration (shaded) from 3 April 2007 (top) and 3 Oct 2006 (bottom). Image courtesy of Lars Kaleschke and Gunnar Spreen, University of Hamburg.
(Click the image to enlarge.)
References
Brennan, M.J., H.D. Cobb, III, and R.D. Knabb, 2007: Observations of Gulf of Tehuantepec gap wind events from QuikSCAT: An updated event climatology and operational model evaluation. Preprints, 22nd Conference on Weather Analysis and Forecasting/18th Conference on Numerical Weather Prediction, Park City, UT, Amer. Meteor. Soc.
Cobb III, H.D., D.P. Brown, and R. Molleda, 2003: Use of QuikSCAT imagery in the diagnosis and detection of Gulf of Tehuantepec wind events 1999-2002. Preprints, 83rd Annual Meeting/12th Conference on Satellite Meteorology and Oceanography, Long Beach, CA, Amer. Meteor. Soc.
Mendez, Diego AP writer, 2007: Large Waves Batter El Salvador, Mexico.
Spreen, G., L. Kaleschke, and G. Heygster, 2007: Sea Ice Remote Sensing Using AMSR-E 89GHz Channels, J. Geophys. Res. Oceans, in press.