Marine Weather Review - North Pacific Area
January through April 2007
By George P. Bancroft, NOAA National Center for Environmental Prediction
Introduction
The weather pattern over the North Pacific was most active in January and March in terms of numbers of strong cyclones producing hurricane-force winds, with January alone having 10. In sharp contrast to the Atlantic, the number of hurricane-force storms was down in February with only three, while March and April were busier. There was a greater prevalence of blocking at high latitudes in February and early March when cyclones coming off Japan often stalled or were forced to move toward the western Bering Sea or farther west. The most intense cyclone (in terms of analyzed central pressure) occurred in early January near the Kurile Islands and was similar in intensity to the most intense storm in the North Atlantic.
The January to April period is usually the least active period for tropical cyclones and this period of 2007 was no exception. Only one tropical cyclone, Kong-Rey, made an appearance on OPC Pacific oceanic analysis charts transmitted via high frequency radiofacsimile, in early April.
Tropical Activity
Typhoon Kong-Rey: Kong-Rey appeared on OPC oceanic analysis charts as a typhoon beginning late on April 2 near 16N 146W and was moving northwest 14 kts. Maximum sustained winds were 70 kts with gusts to 85 kts. The typhoon then moved to near 18N 144E at 1200 UTC on April 3 whre it reached its maximum intensity of 90 kts with gusts to 110 kts. The cyclone then began to recurve to the north and then northeast with a weakening trend. By 1200 UTC on the 4th Kong-Rey weakened to a tropical storm near 22N 147E with maximum sustained winds of 55 kts and gusts to 70 kts, and was accelerating northeast. Kong-Rey became an extratropical gale-force low near 25N 152E at 0600 UTC April 5, with dissipation occurring twelve hours later.
Other Significant Events
North Pacific Storm, January 2-5: January began with a hurricane-force event near the western Aleutians. Low pressure forming well east of Japan near 160E on January 2 moved rapidly to the western Aleutians with a 960-mb central pressure at 0000 UTC on the 4th. The central pressure dropped 34 hPa in the twenty-four hour period ending at that time. A high-resolution scatterometer satellite pass near 1800 UTC on the 3rd revealed west winds as high as 70 kts south of the low center. Buoy 46071 (51N 179.6E) reported west-southwest winds of 49 kts with gusts to 66 kts and 8.5-m seas (28 ft) at 0100 UTC on the 4th. The highest significant wave height at the buoy was 9.5 m (31 ft) one hour later. The minimum pressure at the buoy was 957.5 hPa at 2200 UTC on the 3rd. The Hannover Express (DEHZ) near 55N 175W reported an east wind of 35 kts and 9.0-m seas at 0600 UTC January 4. The storm then turned east and weakened to a gale early on the 5th near the eastern Aleutians, before dissipating off Southeast Alaska early on the 6th.
Western North Pacific Storm, January 6-10: The next significant storm followed a track farther west and was even more intense. Figure 1 depicts the development and track of this powerful cyclone that already was well-developed while crossing Japan. The most rapid deepening occurred early, with the central pressure falling 40 hPa in the twenty-four hour period ending at 0000 UTC January 7. The second part of Figure 1 shows the storm near maximum intensity with a 70-kts ship report near the front. Also see Table 1 which includes this report and others. The storm developed a lowest central pressure of 944 hPa six hours later, making it the deepest of the period in the North Pacific and only 1 hPa higher than the deepest cyclone of the same period in the North Atlantic. The storm then slowly moved into the western Bering Sea by early on the 10th while weakening to a gale-force low, with secondary lows forming to the south and east taking over as the parent low continued to weaken through the 12th.
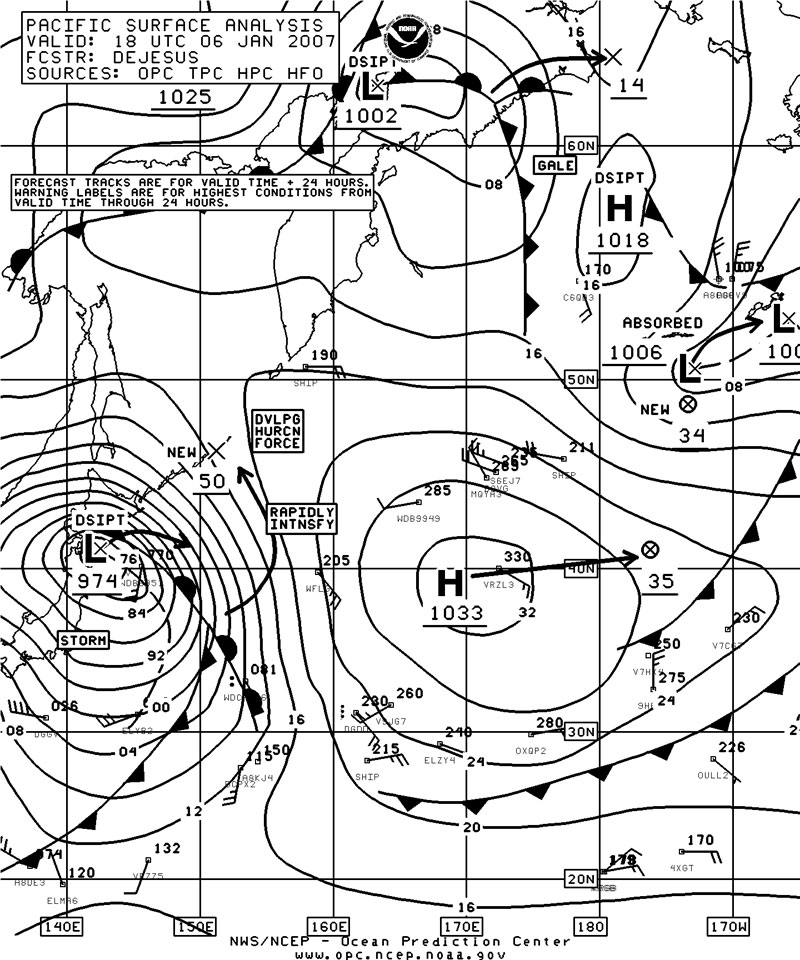
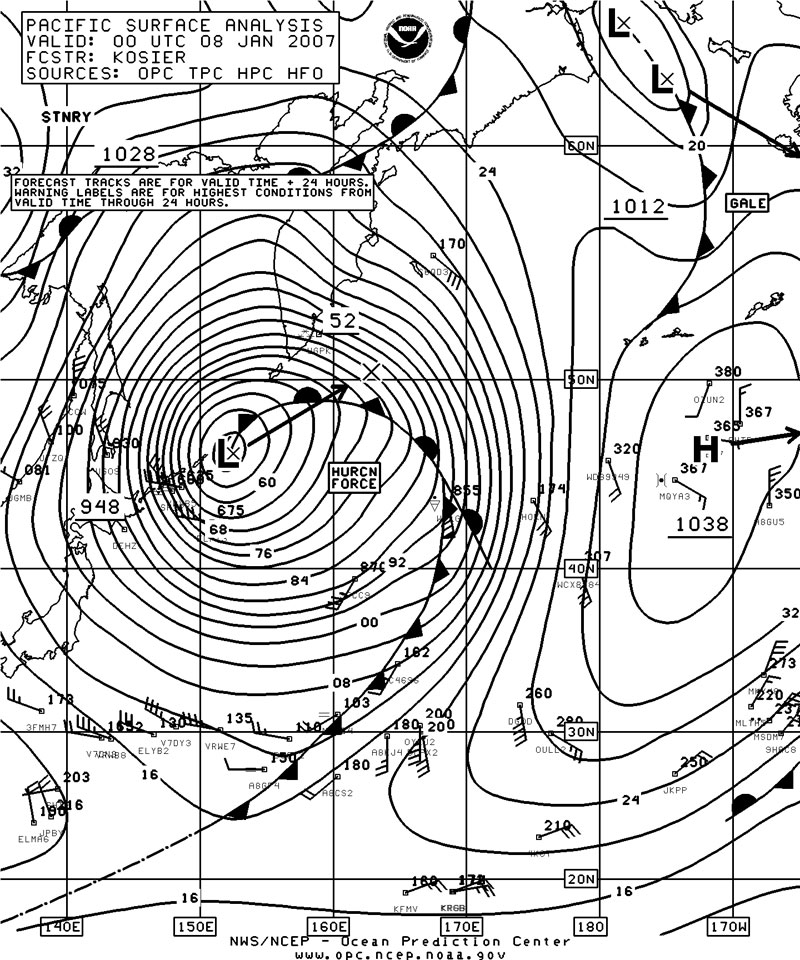
Figure 1. OPC North Pacific Surface Analysis charts (Part 2 - west) valid 1800 UTC January 6 and 0000 UTC January 8, 2007. The arrows are 24-hour forecast tracks of surface pressure centers to the 24-hour forecast positions with forecast pressures given with the last two whole digits in millibars.
(Click the image to enlarge.)
| OBSERVATION | POSITION | DATE/TIME(UTC) | WIND | SEAS(m/ft) |
|---|---|---|---|---|
| Contship Vision (DGGV) | 31N 141E | 07/0300 | W 55 | 10.5/35 |
| ELYB2 | 31N 145E | 07/0600 | W 50 | 12.5/41 |
| WDC4696 | 34N 160E | 07/1200 | S 50 | 9.5/31 |
| 34N 163E | 07/1800 | S 50 | ||
| CSX Spirit (WFLG) | 42N 165E | 07/1200 | SE 50 | |
| 44N 168E | 07/2100 | SE 65 | ||
| 44N 169E | 08/0000 | S 75 | ||
| Polar Eagle (ELPT3) | 43N 140E | 07/2100 | W 40 | 9.0/30 |
| 44N 153E | 08/0700 | W 65 | ||
| 44N 154E | 08/0900 | W 70 | ||
| 45N 156E | 08/1500 | W 65 | ||
| 45N 157E | 08/2100 | W 65 | ||
| 46N 158E | 09/0000 | W 55 | ||
| VRVB5 | 46N 152E | 08/1200 | NW 50 | 9.5/31 |
| ELYB2 | 31N 144E | 08/1800 | NW 35 | 10.5/34 | Buoy 46035 | 57N 177.7W | 09/1300 | S 25 | 7.5/25 |
| Buoy 46071 | 51.3N 179.1E | 10/0000 | S 25 | 8.5/28 |
Table 1. Ship and buoy observations taken during the passage of the storm of January 6-10, 2007.
North Pacific Storm, January 13-18: This storm developed farther south near 41N 165E by 1200 UTC January 14 by the consolidation of a multi-centered cyclonic system that was located near 39N 151E twenty-four hours prior, with a drop in central pressure of 21 hPa. This cyclone briefly developed hurricane-force winds as a 977-hPa low near 42N 171E at 1800 UTC on the 14th. This was based on an early-morning high-resolution QuikScat scatterometer image which showed a small area of 65 to 70 kts on the south side of the center near 39N 169E. The storm then tracked northeast to near the central Aleutians by the 17th and slowly deepened to the low 970s in central pressure while expanding in area, and maximum winds decreased to gale-force. The central pressure then rose as the system moved northeast with dissipation occurring in the northwest Gulf of Alaska on the 22nd. The strongest wind reported by a ship was a south wind of 55 kts near 46N 165W from the ship A8EH3 at 0000 UTC on the 16th.
North Pacific Storm of January 19-22: A small but compact low with marginal hurricane-force winds on the south side developed over the south-central waters near 39N 175W with a 988-hPa central pressure at 1800 UTC January 20. The hurricane-force conditions were brief and only occurred on the 20th. The storm then moved northeast and weakened to a gale on the 22nd, before moving into Southeast Alaska on January 24.
North Pacific Storm, January 19-22: This cyclone was nearly a twin of the preceding storm of the 19-22nd and developed to the west, near 41N 177E and again with a 988-hPa central pressure, at 0000 UTC on the 21st. This cyclone originated east of Japan as a weak 1009-hPa low near 150E late on the 19th. The ship ELMA6 (38N 175E) encountered west-northwest winds of 55 kts at 0000 UTC January 21. Hurricane-force conditions lasted only about twelve hours, and the low subsequently weakened while moving southeast, dissipating near 34N 160W late on the 22nd.
North Pacific Storm, January 22-26: This developing major storm tracked northeast into the central North Pacific as depicted in Figure 2. The second part of Figure 2 shows the storm at maximum intensity with a 952-hPa central pressure, the deepest of several hurricane-force systems that affected the central and eastern waters during Januarys active pattern. The central pressure fell 25 hPa in the twenty-four hour period ending at 0000 UTC on the 24th. A special parallel processing of 25-km QuikScat scatterometer data revealed winds 65 to 70 kts on the south side at 0631 UTC on the 24th, only five and one-half hours prior to the valid time of the second part of Figure 2. This image was similar in appearance to Figure 4 for a storm of similar intensity later in the month. Some ship and buoy observations taken in this storm are listed in Table 2. The hurricane-force conditions lasted between 0000 UTC on the 24th and 0600 UTC on the 25th. The storm subsequently weakened to a gale near the eastern Aleutians late on the 25th and dissipated in the far northeast Bering Sea by the 27th.
| OBSERVATION | POSITION | DATE/TIME(UTC) | WIND | SEAS(m/ft) |
|---|---|---|---|---|
| OXQP2 | 36N 169W | 24/0600 | SW 45 | 7.5/25 |
| 37N 164W | 24/1800 | S 45 | 8.0/27 | |
| CSX Enterprise | 48N 179W | 24/1200 | NW 55 | |
| (KRGB) | 48N 172W | 25/0600 | NW 45 | 9.5/31 |
| NMEL | 55N 165W | 25/0900 | NE 55 | 8.0/26 |
| 55N 165W | 25/1200 | N 45 | 8.0/26 | |
| Buoy 46707 | 45.7N 153.1W | 25/0300 | S 50 | |
| Buoy 46075 | 53.9N 160.9W | 25/0600 | E 40 | 7.5/25 |
| 25/0900 | SE 20 | 8.5/28 | ||
| 25/1200 | S 20 | 9.0/30 | ||
| Buoy 46078 | 56.2N 152.5W | 25/1900 | 8.5/28 |
Table 2. Selected ship and buoy observations taken during the passage of the storm of January 22-26, 2007.
North Pacific Storm, January 25-28: This storm followed the previous one and originated from a development secondary to a primary gale-force low which was located near 46N 165E at 1200 UTC January 25. The new low developed hurricane-force winds within twenty-four hours as it moved to 45N 170W with the central pressure falling 26 hPa. Hurricane-force winds lasted about twelve hours, with QuikScat imagery from early on the 26th looking similar to that of the preceding system. The low center developed a lowest central pressure of 956 hPa near 46N 167W at 1800 UTC on the 26th. The cyclone then weakened and moved into the southeast Bering Sea as a gale by the 28th with dissipation following the next day.
Eastern North Pacific Storm, January 27-29: This development farther east is depicted in Figure 3. This hurricane-force low explosively deepened in the twenty-four hour period covered by Figure 3, absorbing two weaker lows to the northwest. The central pressure dropped an impressive 41 hPa during this period. Hurricane-force winds lasted 12 to 18 hours near maximum intensity, with the scatterometer winds in Figure 4 revealing winds as high as 70 kts on the south side of the center and 55 kts to the northeast. This strong system was otherwise similar to preceding central and eastern storms described above. The ship DQVJ (44N 158W) reported south winds of 45 kts at 0600 UTC on the 29th, and north winds of that speed near 45N 161W twelve hours prior to this. The Hannover Express (DEHZ) reported northwest winds of 50 kts and 9.0-m seas (30 ft) at 0000 UTC on the 30th. The APL Thailand (WCX8882) near 45N 171W encountered northwest winds of 35 kts and 9.0-m seas (30 ft) six hours later. The storm turned northwest on the 29th and weakened to a gale-force low near the eastern Aleutians by the 30th with dissipation occurring that day.
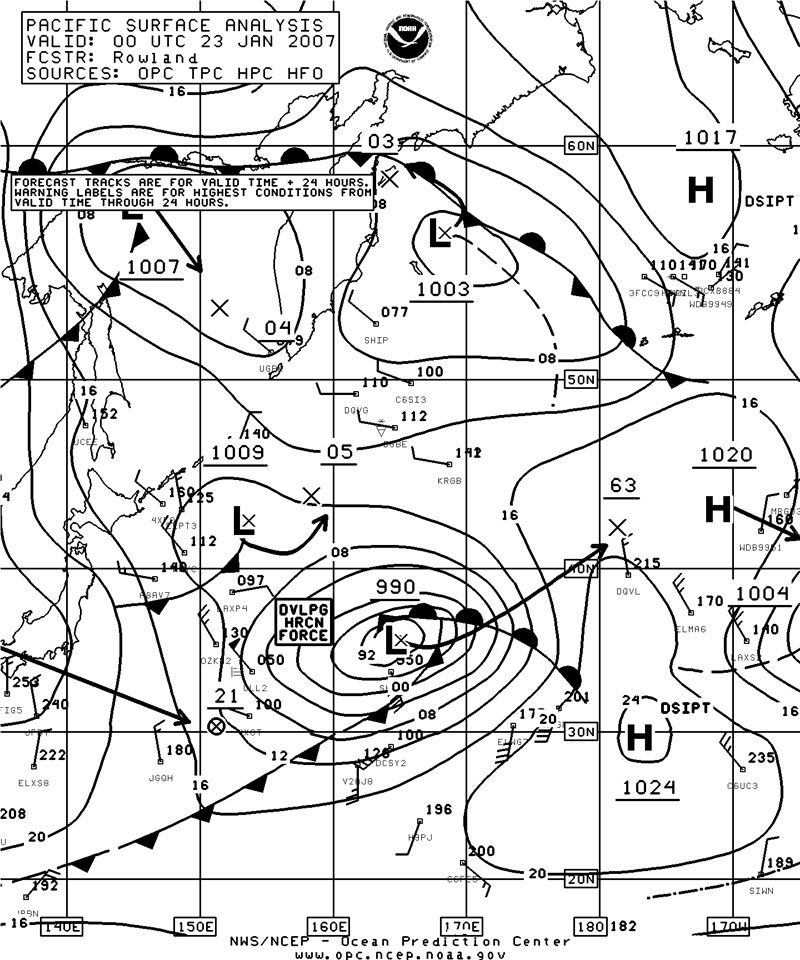
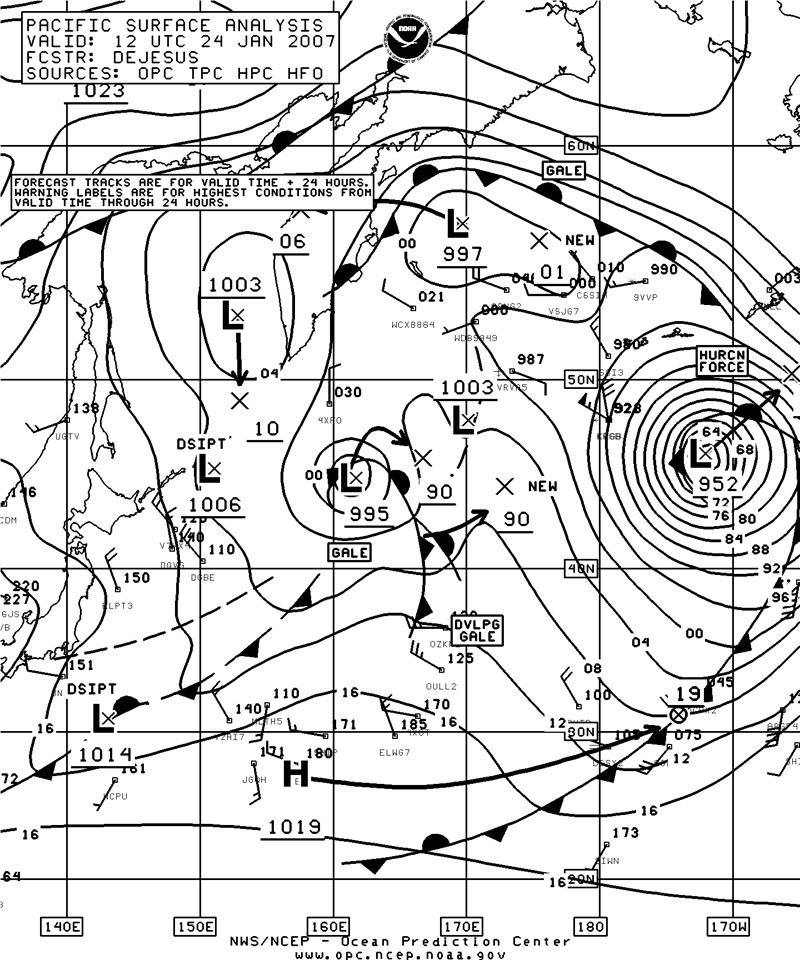
Figure 2. OPC North Pacific Surface Analysis charts (Part 2) valid 0000 UTC January 23 and 1200 UTC January 24, 2007.
(Click the image to enlarge.)
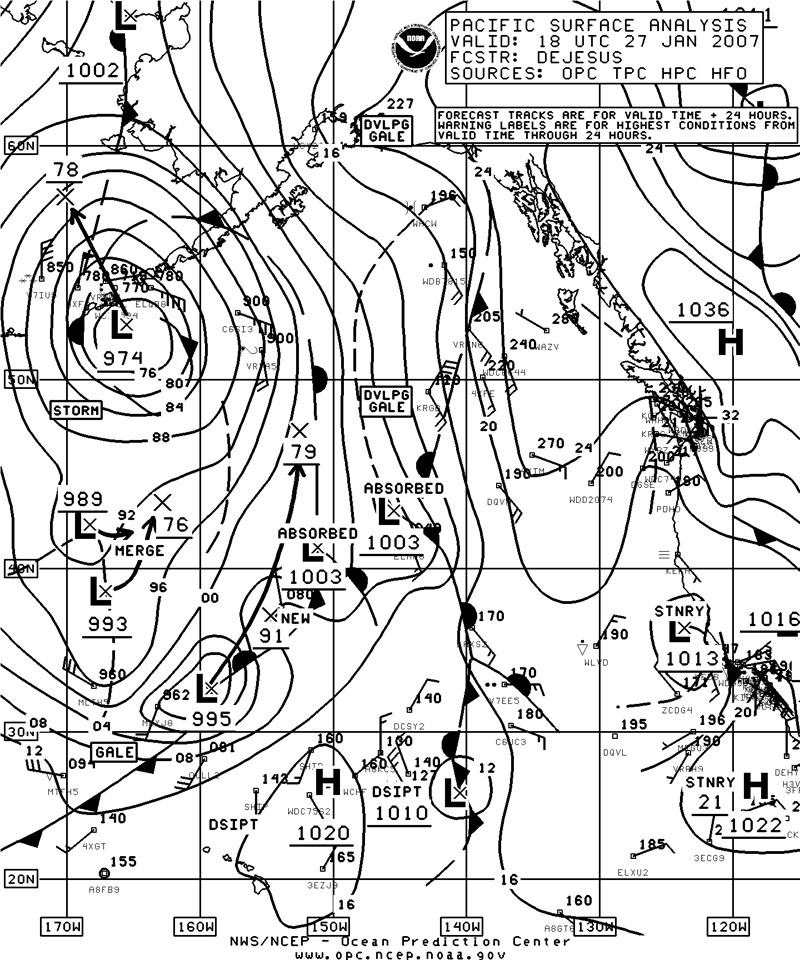
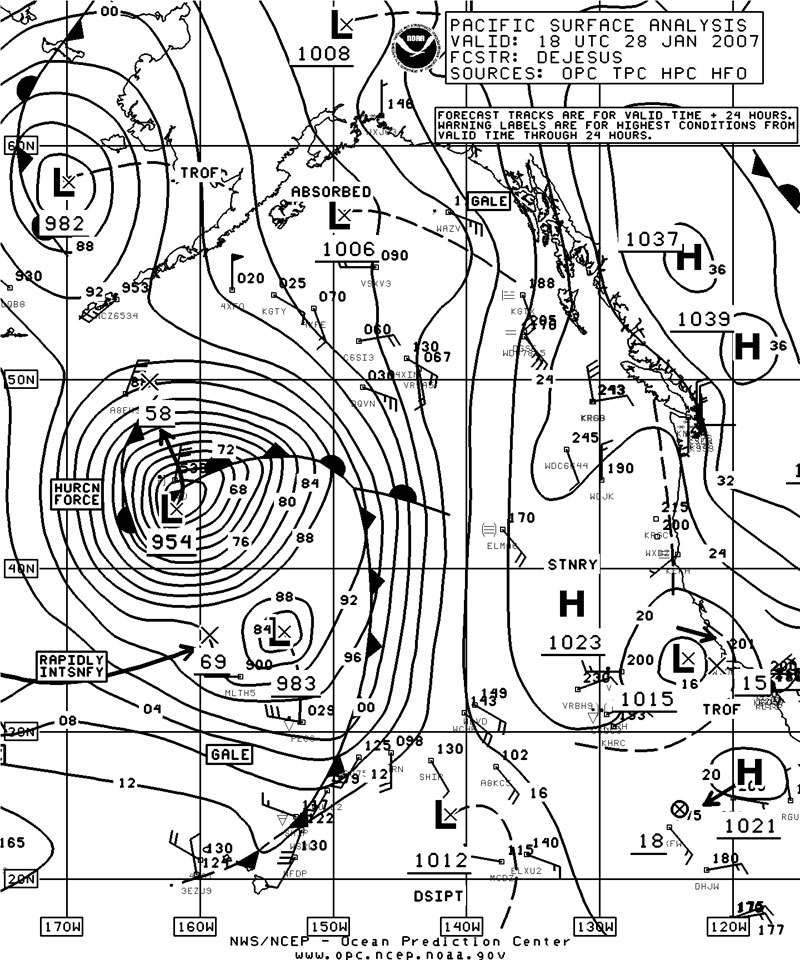
Figure 3. OPC North Pacific Surface Analysis charts (Part 1 - east) valid 1800 UTC January 27 and 28, 2007.
(Click the image to enlarge.)
North Pacific Storm, January 28-31: This system moved rapidly east-southeast out of the western North Pacific on January 28, developing storm-force winds on the south side as it crossed the dateline. The ship WCPU (34N 172E) encountered northwest winds of 50 kts at 1800 UTC on the 28th. The cyclone rapidly deepened as it turned north near 160W on the 29th. As it absorbed the remains of the preceding storm near the central Aleutians while turning northwest on the 30th, it developed hurricane-force winds on the eastern side. The system developed a lowest central pressure of 959 hPa near 51N 165W at 1800 UTC January 30. At 0000 UTC on the 31st the ship MMEL (54N 166W) reported southeast winds of 50 kts and 13.5-m seas (45 ft). The buoy 46066 (52.7N 155W) reported a southeast wind of 45 kts and 10.5-m seas (35 ft) at 1800 UTC January 30, followed two hours later by a report of seas 11.5 m (38 ft). Buoy 46075 (53.9N 160.8W) reported southeast winds 45 kts and 9.0-m seas (30 ft) at 1900 UTC on the 30th, followed two hours later by a report of south winds of 50 kts. At 2300 UTC January 30 the same buoy reported south winds of 35 kts and seas reaching 12.0 m (40 ft). The cyclone subsequently moved into the Bering Sea and weakened to a gale on the 31st before moving inland over Russia late on February 1.
North Pacific Storm, January 30 to February 1: This developing storm originated as a frontal wave of low pressure crossing the dateline near 34N on January 29, moving east. The cyclone rapidly intensified as it turned north near 160W late on the 30th, with the central pressure dropping 24 hPa in the twenty-four hour period ending at 0600 UTC on the 31st, when it briefly developed hurricane-force winds as a relatively compact 972-hPa low near 39N 160W. The ship VRBH9 (38N 158W) reported southeast winds of 55 kts at 0000 UTC on the 31st. The storm then moved north and expanded in size late on the 31st with the central pressure dropping to 962 hPa before accelerating north-northwest and weakening to a gale on February 1. The system passed north of the Bering Strait late on February 2.
Western North Pacific Storm, February 17-21: A frontal wave of low pressure quickly developed into a storm-force low while passing just south of Japan late on February 17. At 1200 UTC on the 18th the storm was near 36N 148E with a 987-hPa central pressure. The ship WDDI (30N 148E) encountered southwest winds of 60 kts at that time. The cyclone moved northeast on the 18th and then turned north near 160E and developed hurricane-force winds briefly on the 19th while intensifying. The center developed a lowest pressure of 963 hPa when near 53N 161E at 0600 UTC on the 20th and again when the center re-formed west of the Kamchatka Peninsula near 57N 158E at 1800 UTC on the 20th. The system re-developed hurricane-force winds at that time, with the ship JCMM (54N 153E) reporting a northwest wind of 65 kts. Also the Polar Eagle (ELPT3) near 51N 165E and 9HAC8 (51N 158E) reported southwest winds of 50 kts and west winds 55 kts, respectively. The system subsequently drifted northwest and weakened to a gale by the 21st and dissipated a day later.
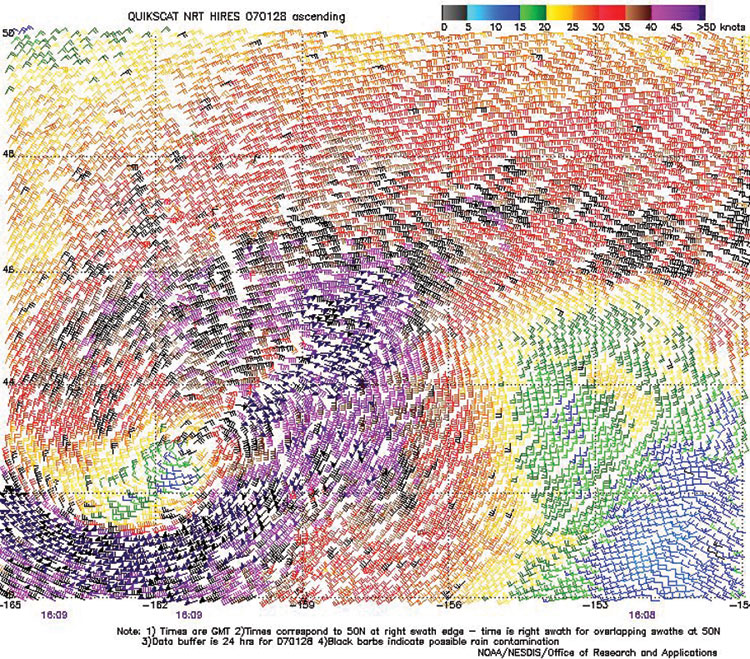
Figure 4. High-resolution QuikScat scatterometer image of satellite-sensed winds around the storm shown in Figure 3. The resolution is 12.5 km, versus 25 km in the coarser-resolution version of QuikScat imagery. The valid time of the pass is 1609 UTC January 28, 2007, or about two hours prior to the valid time of the second part of Figure 3. The center of the storm appears near 43N 161W in the lower left part of the image. Image is courtesy of NOAA/NESDIS/ Office of Research and Applications.
(Click the image to enlarge.)
North Pacific Storm, February 21-26: This developing storm relatively far south is displayed in Figure 5. The cyclone is shown in the second part of the figure as it was near maximum intensity and developing hurricane-force winds. A 25-km QuikScat image (Figure 6) reveals hurricane-force winds concentrated on the north side between the low center and the strong high pressure to the north. There is one 85-kts wind barb in this area of highest winds, but the processing of the image flagged this area for possible rain contamination. At 0600 UTC on the 23rd the ship A8AX8 reported north winds of 50 kts and 11.5-m seas (37 ft). The cyclone slowly weakened on the 24th while turning northeast, and then turned northwest on the 25th and weakened to a gale near 47N 174E early on February 26. The weakening system then entered the Sea of Okhotsk as March began and dissipated March 4.
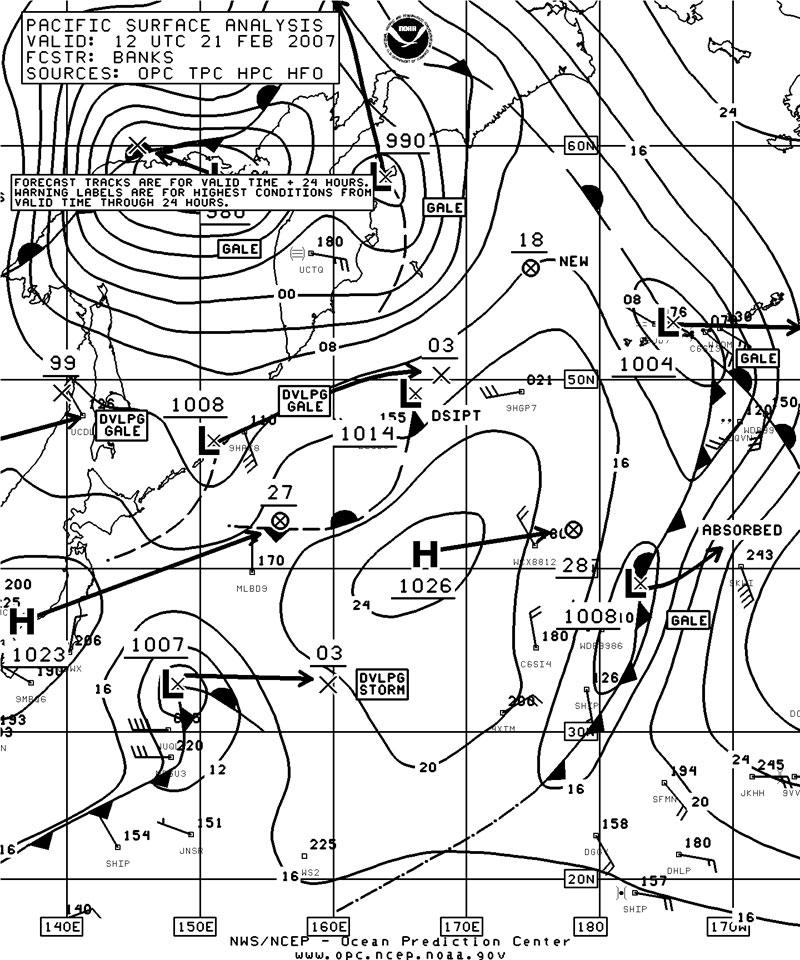
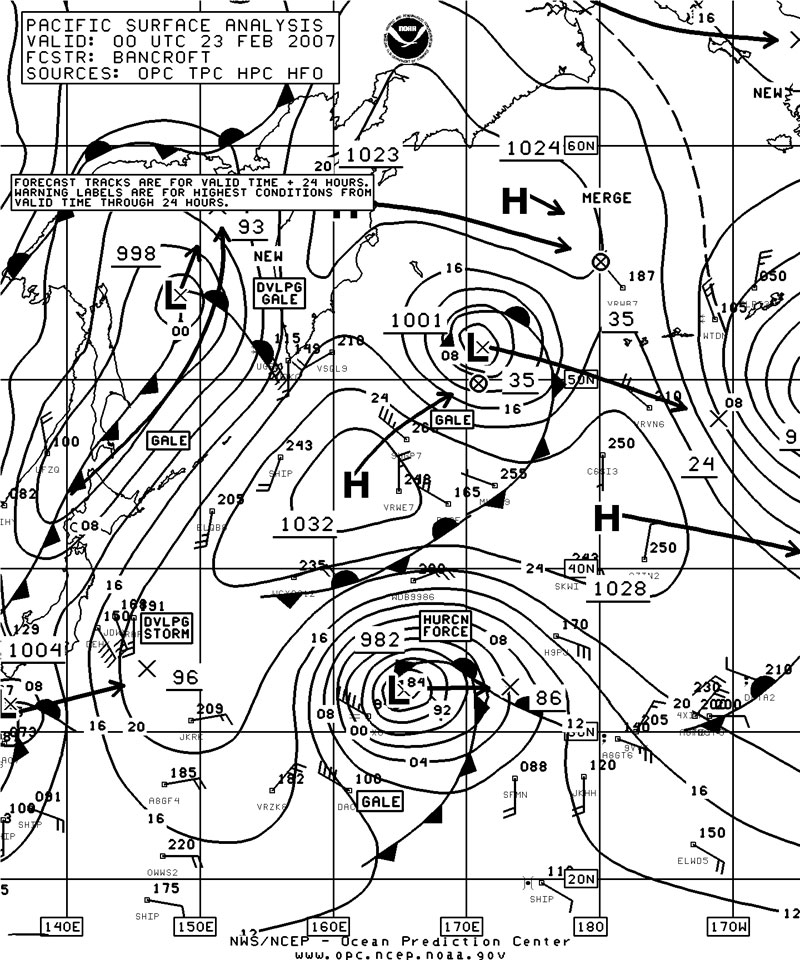
Figure 5. OPC North Pacific Surface Analysis charts (Part 2) valid 1200 UTC February 21 and 0000 UTC February 23, 2007.
(Click the image to enlarge.)
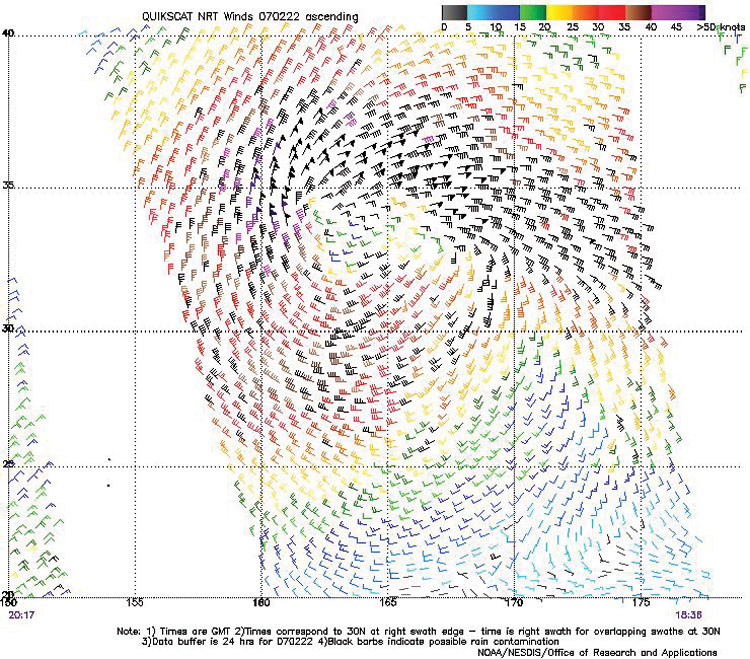
Figure 6. QuikScat scatterometer image of satellite-sensed winds around the southwestern North Pacific storm shown in Figure 5, valid at 1839 UTC February 22, 2007, or about five and one-half hours prior to the valid time of the second part of Figure 5. The resolution is 25 km. The center of the storm appears near 34N 163E. Image is courtesy of NOAA/NESDIS /Office of Research and Applications.
(Click the image to enlarge.)
Western North Pacific Storm, February 23-26: The second part of Figure 5 shows the beginning of the next storm in the western waters, passing south of Japan, with Figure 7 displaying it as a complex storm system east of Japan. Although not very deep in terms of central pressure, it developed a tight pressure gradient on the western side and hurricane-force winds briefly late on February 24 as shown in the high-resolution scatterometer image of Figure 8. At 0600 UTC on the 24th the APL Singapore (WCX8812) near 36N 144E reported northwest winds of 60 kts while the ship WDB9951 (44N 150E) encountered northwest winds of 50 kts. The ship DDAL2 (37N 147E) reported north winds of 60 kts and 9.0-m seas (30 ft) six hours later. The CSX Enterprise (KRGB) encountered northeast winds of 40 kts and 9.5-m seas (31 ft) at 0600 UTC on the 25th. The storm system subsequently turned east-southeast on the 25th and weakened to a gale near 38N 164E late on the 26th before turning northeast. The cyclone approached the central Aleutians on February 28 before turning east and dissipating near the Canadian coast March 3.
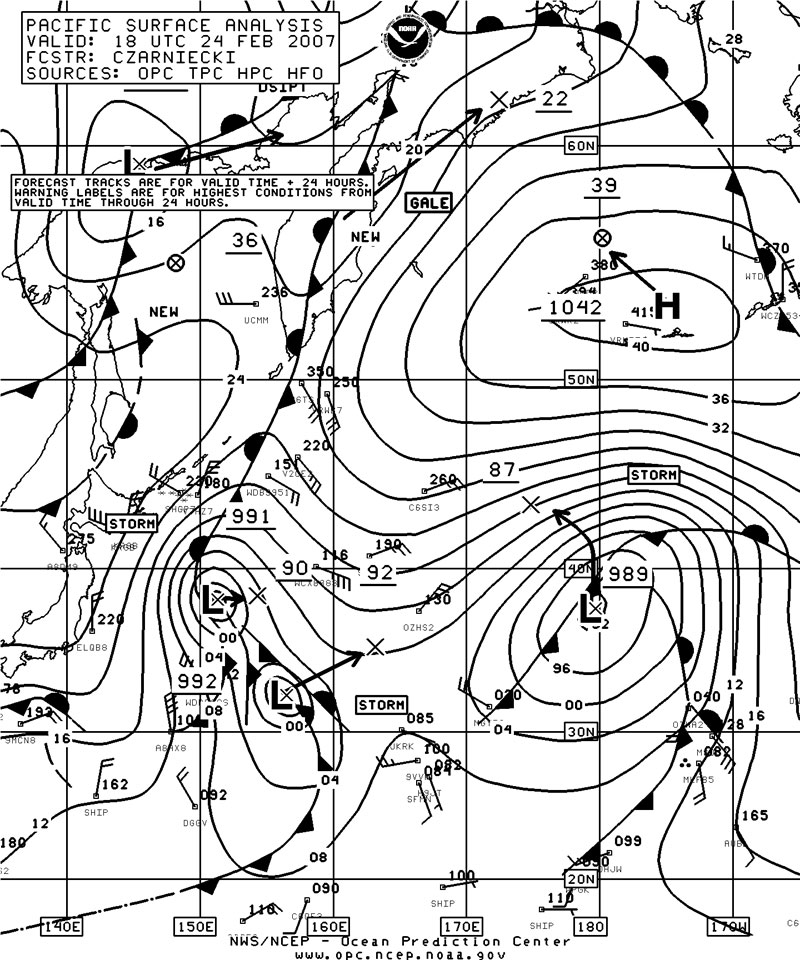
Figure 7. OPC North Pacific Surface Analysis chart (Part 2) valid 1800 UTC February 24, 2007.
(Click the image to enlarge.)
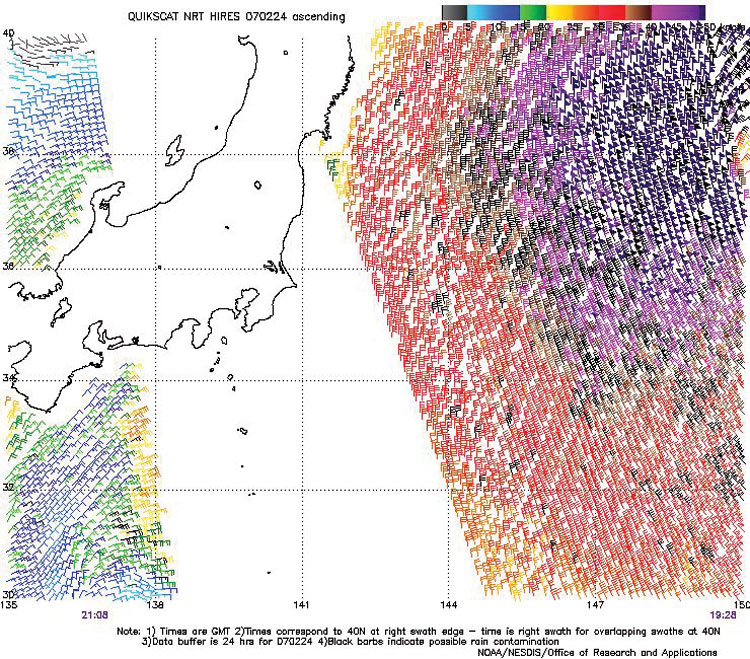
Figure 8. High-resolution QuikScat scatterometer image of satellite-sensed winds around the west side of the storm just east of Japan shown in Figure 7. The resolution is 12.5 km, versus 25 km in the coarser-resolution version of QuikScat imagery. The valid time of the pass is 1928 UTC February 24, 2007, or only about one and one-half hours later than the valid time of Figure 7. Image is courtesy of NOAA/NESDIS/ Office of Research and Applications.
(Click the image to enlarge.)
Western North Pacific Storm, February 28 to March 4: Another strengthening area of low pressure moved east from Japan on February 28, developing a central pressure of 978 hPa near 38N 153E at 0600 UTC March 1. The ship MLFB5 reported every three hours on March 1, with reported wind and sea conditions peaking at 65 kts from the north and 14.5-m seas (47 ft) at 0600 UTC March 1 when the position was at 38N 150E. By 0000 UTC March 2 the same ship reported north winds 40 kts and 10.0-m seas (32 ft) while the vessel HOKN (39N 151E) reported north winds of 45 kts and seas 9.0 m (30 ft). The system developed a lowest central pressure of 971 hPa near 38N 155E, unusually deep for that latitude, at 1800 UTC on the 1st, before moving east and weakening to a storm-force low March 2. With blocking over the Bering Sea, the weakening cyclone drifted north along 173E on March 3 and weakened to a gale by the 4th, before looping back to the south. The system stalled near 40N 175E on the 5th and 6th before drifting southeast and dissipating well south of the Gulf of Alaska on the 10th.
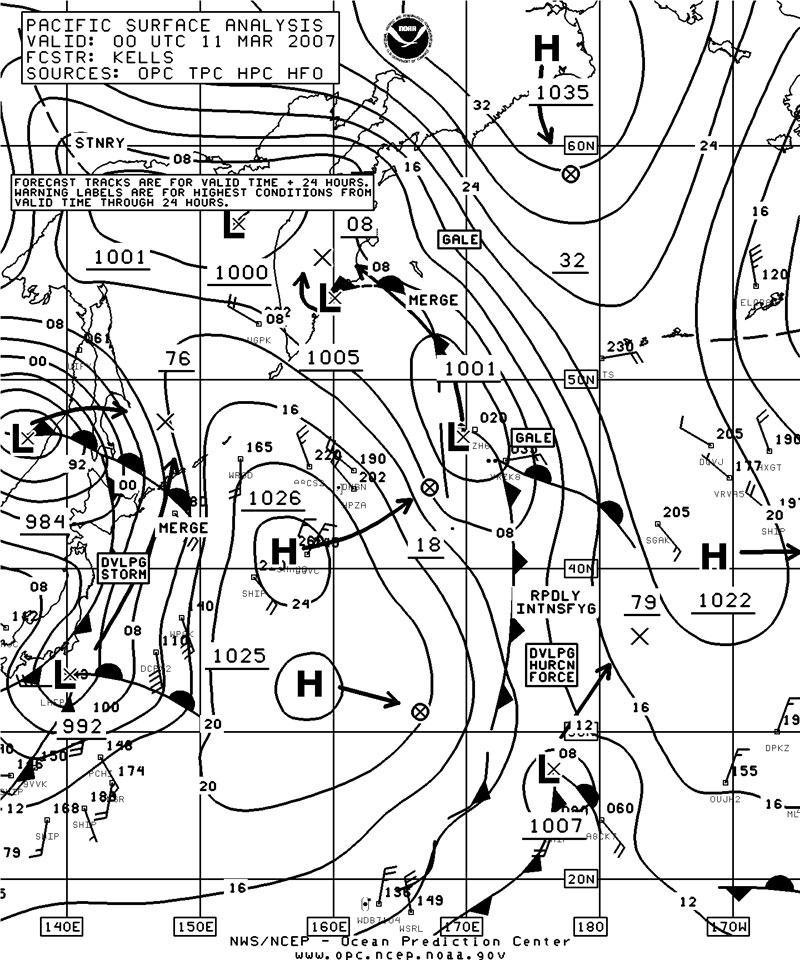
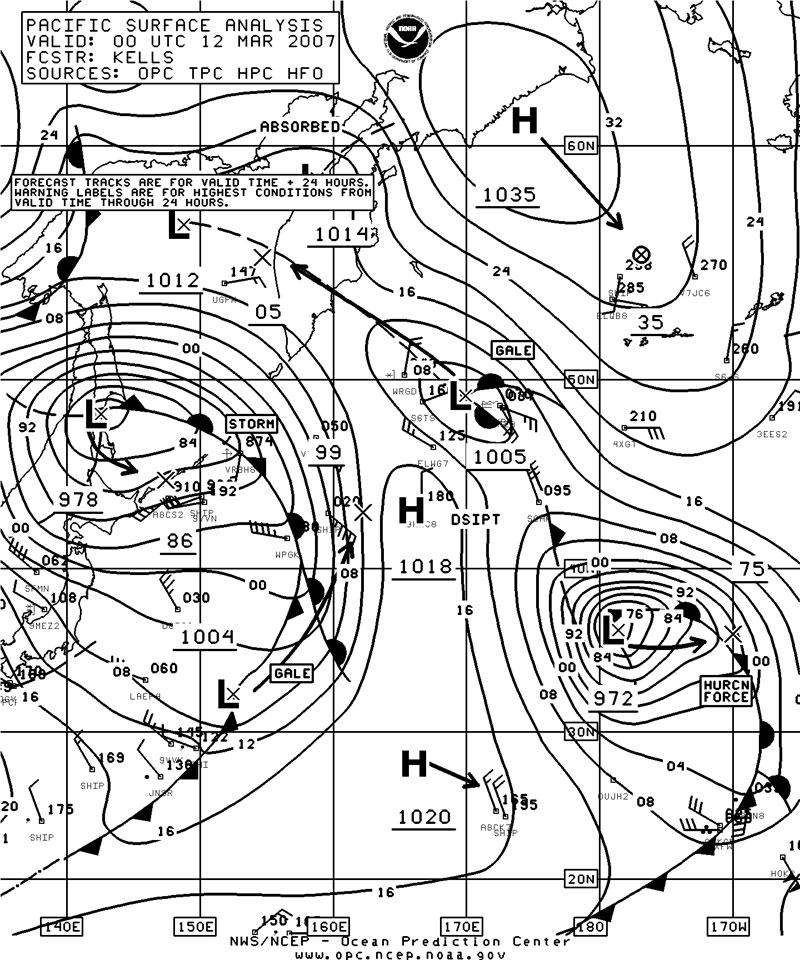
Figure 9. OPC North Pacific Surface Analysis charts (Part 2) valid 0000 UTC March 11 and 12, 2007.
(Click the image to enlarge.)
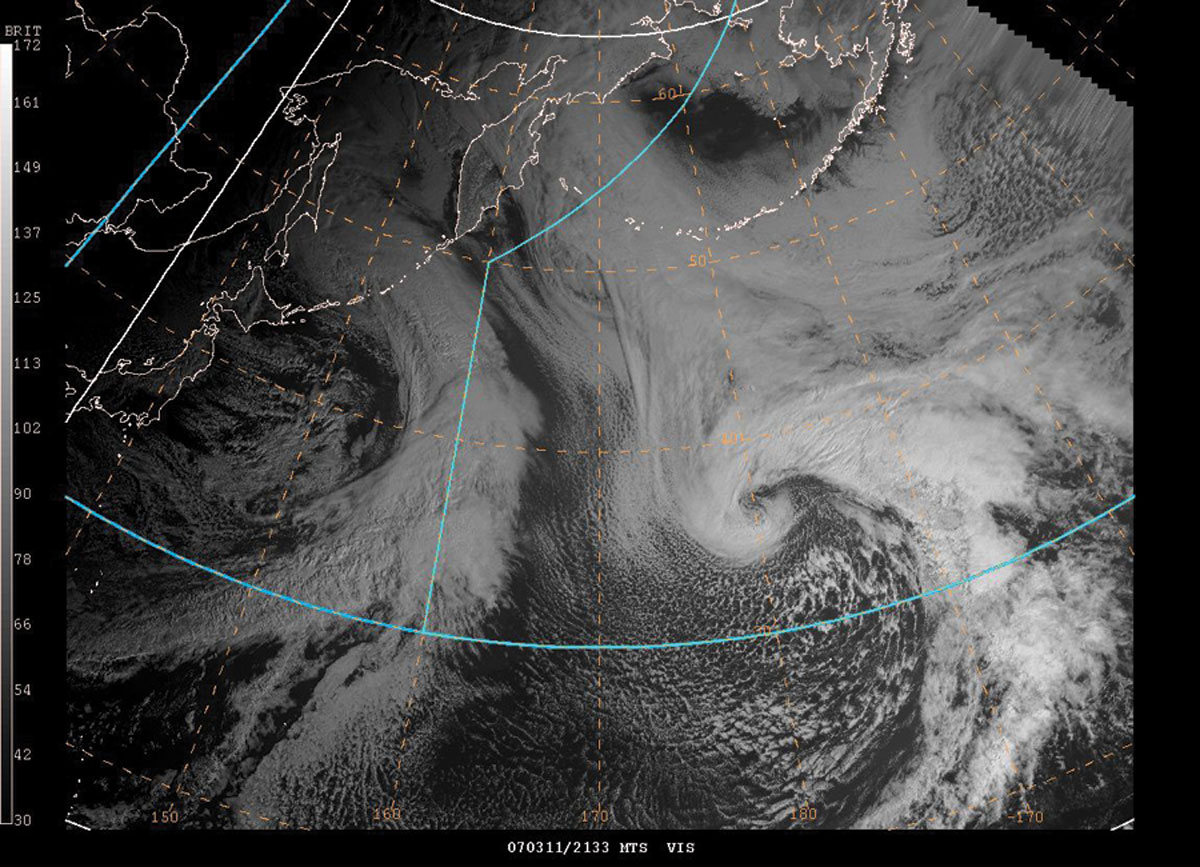
Figure 10. MTS visible satellite image of the storm in Figure 9 near the dateline, valid at 2133 UTC March 11, 2007. The valid time of the image is about two and one-half hours prior to the valid time of the second part of Figure 9.
(Click the image to enlarge.)
North Pacific Storm, March 10-14: Another unusually deep cyclone for so far south developed by the middle of March, as depicted in Figure 9. This hurricane-force storm is shown as its central pressure bottomed out at 972 hPa. It appears its development was aided by drawing in the cold air from behind the cold front to the west of the developing system in the first part of Figure 9. The central pressure dropped 33 hPa in the twenty-four hour period ending 1800 UTC on the 11th. The MTS visible satellite image (Figure 10) near the time of maximum intensity reveals well-defined broad frontal features and cumulus-type clouds associated with cold air pouring in from the west over relatively warm water. Figure 11 is a 25-km QuikScat pass showing hurricane-force winds on the backside of the storm, which was centered off the right edge of the image at the time, about 1800 UTC on the 11th. There was little ship data. The ship WCPU (37N 169E) reported north winds of 40 kts at 1200 UTC on the 11th. Blocked by high pressure to the north, the cyclone subsequently drifted southeast and then northeast late on the 12th, weakening to a gale near 39N 159W early on the 14th. Dissipation occurred late on the 15th.
Western North Pacific Storm, March 14-17: This developing storm originated from a frontal wave of low pressure southeast of Japan near 33N 154E late on March 13. The cyclone moved northeast and rapidly intensified to hurricane-force by 0600 UTC March 15 when the center was near 41N 170E with a 984-hPa central pressure. The center developed a lowest central pressure of 972 hPa near 42N 173E at 0000 UTC on the 16th. Once again scatterometer imagery was needed to fill in gaps in ship data, with a pass near 1800 UTC on the 15th, similar to Figure 4, revealing west winds to 65 kts south of the center. Most ships in the area were reporting 35 kts or less, but the Oriental Bay (MKYJ8) near 41N 170E reported west winds of 40 kts and 9.0-m seas (30 ft) at 1200 UTC on the 16th. By that time the system was weakening and turning northwest. It weakened to a gale as it drifted west along 46N on the 17th. The cyclone then stalled south of the Kamchatka Peninsula on the 18th before re-forming eastward and moving northeast into Southeast Alaska on March 25.
North Pacific Storm, March 19-21: This storm initially formed as a 1002-hPa frontal wave of low pressure near 31N 175E at 0000 UTC March 19 which deepened rapidly during the first twenty-four hours when the pressure dropped 30 hPa. The cyclone developed hurricane-force winds shortly thereafter as the center moved to 49N 171W by 1200 UTC on the 20th. A scatterometer pass valid about five hours later showed winds to 70 kts south of the center but with some questionable wind directions. The APL Philippines (WCX8884) reported an east wind of 45 kts near 45N 168W at 0600 UTC on the 20th. Twelve hours later the Stuttgart Express (DGBE) encountered southwest winds of 50 kts and 14.0-m seas (46 ft) near 46N 170W. The cyclone subsequently weakened to a storm-force low as it approached Kodiak Island late on the 20th, and moved onshore in southern Alaska as a gale on the 21st.
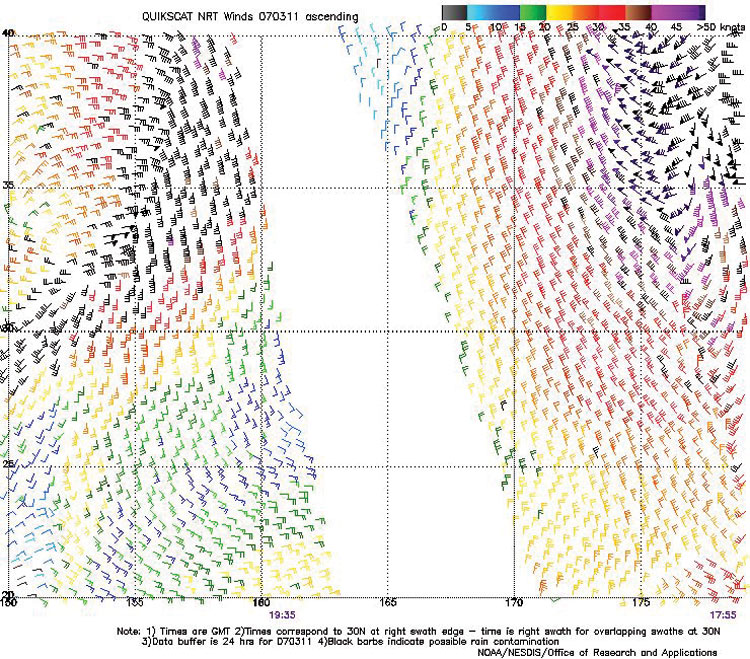
Figure 11. QuikScat scatterometer image of satellite-sensed winds around the west part of the south-central North Pacific storm shown in Figure 9, valid at 1755 UTC March 11, 2007, or about six hours prior to the valid time of the second part of Figure 9. The resolution is 25 km. The center of the storm is off the upper right side of the chart. Image is courtesy of NOAA/NESDIS /Office of Research and Applications.
(Click the image to enlarge.)
North Pacific and Bering Sea Storm, March 27-30: The development of this hurricane-force low is depicted in Figure 12, as northern and southern lows merged. The central pressure fell 29 hPa in the twenty-four hour period ending at 1200 UTC on the 29th, when the center was at 49N 172E with a lowest central pressure of 960 hPa. Figure 13 is a high-resolution scatterometer image showing a well-defined center near 40N 165E and winds up to 75 kts south of the center. Rain contamination may affect some of the wind speeds and directons northwest of the center. Hurricane-force conditions lasted between 1800 UTC on the 28th and 0000 UTC on the 30th. The cyclone then begin to weaken and moved into the western Bering Sea as a storm-force low on March 30, and moved inland over Russia on the 31st.
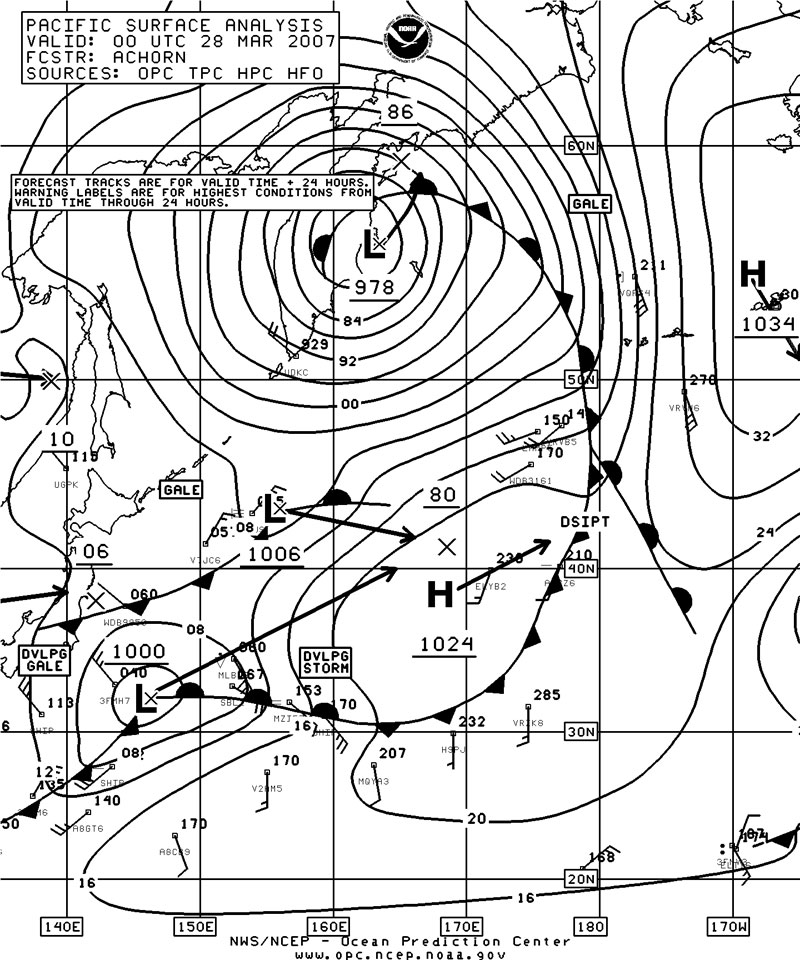
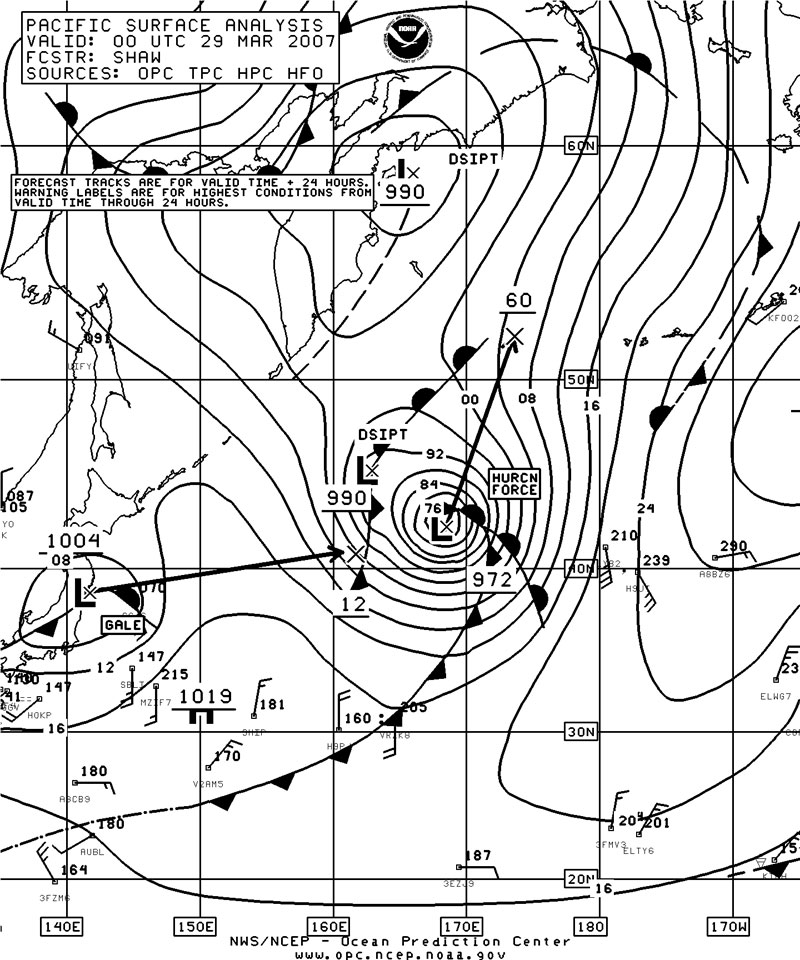
Figure 12. OPC North Pacific Surface Analysis charts (Part 2) valid 0000 UTC March 28 and 29, 2007.
(Click the image to enlarge.)
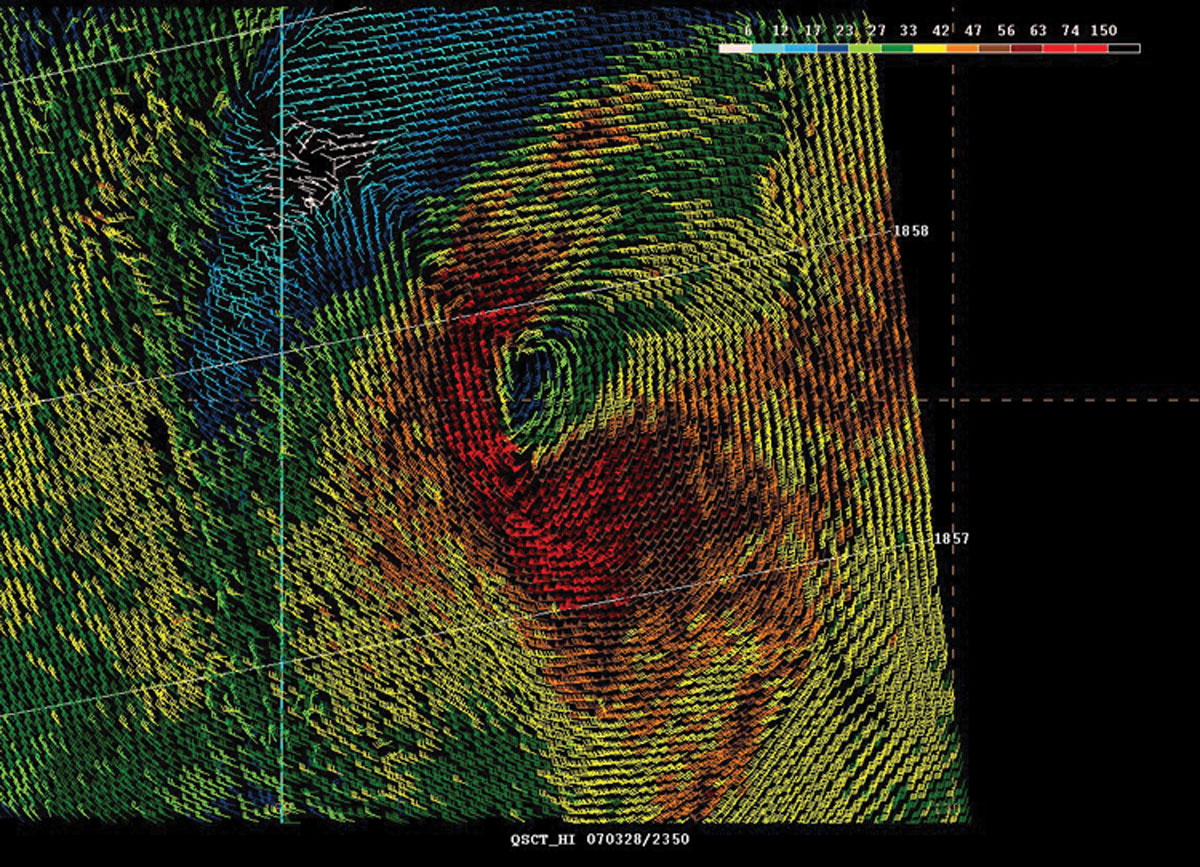
Figure 13. High-resolution QuikScat scatterometer image of satellite-sensed winds around the storm shown in Figure 12. The valid time of the pass is approximately 1858 UTC March 28, 2007, or about five hours prior to the valid time of the second part of Figure 12. The center of the storm appears near the center of the image. The stronger wind barbs appear in darker shades of gray in the black-and-white version of the image. The numbered diagonal lines are cross-track time lines for the satellite pass. Image is from NOAA/NESDIS/ Office of Research and Applications adapted for use at OPC.
(Click the image to enlarge.)
Western North Pacific Storm, March 30 to April 2: Low pressure moved northeast from the main island of Japan late on March 29 and became a storm near 41N 154E with a 982-hPa central pressure at 1800 UTC March 30. The ship 4XEC (41N 155E) reported north winds of 55 kts at that time. The cyclone intensified to a 964-hPa center as it moved northeast to 47N 166E by 1800 UTC March 31. The system then weakened and turned northwest early on April 1, before strengthening and redeveloping hurricane-force winds. At 1800 UTC April 1 the center was at 52N 165E with a 964-hPa central pressure when the APL Singapore (WCX8812) reported southwest winds of 65 kts. The system then weakened to a gale near the Kamchatka Peninsula by April 2, before re-forming as a weak stationary low west of the Kamchatka Peninsula by the 3rd.
North Pacific Storm, April 5-8: A frontal wave of low pressure near 37N 162E at 0000 UTC on the 5th quickly intensified to a hurricane-force low with a 978-hPa central pressure twenty-four hours later as it moved to 41N 172E. Intensification continued until early on the 7th when the central pressure was 958 hPa near 47N 151W. The ship DBUT (36N 170W) reported a west wind of 55 kts at 0000 UTC on the 7th. Expansion of the storms circulation led to decreasing winds during this period, with winds diminishing to gale force late on the 7th. The system then turned northwest into the Bering Sea on the 9th, where it dissipated on April 12.
North Pacific Storm, April 17-19: Several weak lows southeast of Japan early on April 16 consolidated into a 986-hPa low center near 34N 144E twelve hours later, which intensified as it moved northeast. The central pressure dropped 26 hPa in the twenty-four hour period ending at 1200 UTC on the 17th. The center developed a lowest pressure of 968 hPa near 40N 162E at 0000 UTC on the 18th, when high-resolution QuikScat data revealed winds as high as 65 kts south of the center. Hurricane-force conditions continued until 1200 UTC on the 18th, as the cyclone began to weaken as it moved northeast toward the Aleutians (Figure 14). The ship OXWK2 (45N 173W) reported west winds of 40 kts at 1800 UTC April 19. The cyclone weakened to a gale as it passed south of the eastern Aleutians late on the 19th. Dissipation followed on the 22nd as the system reached the Queen Charlotte Islands.
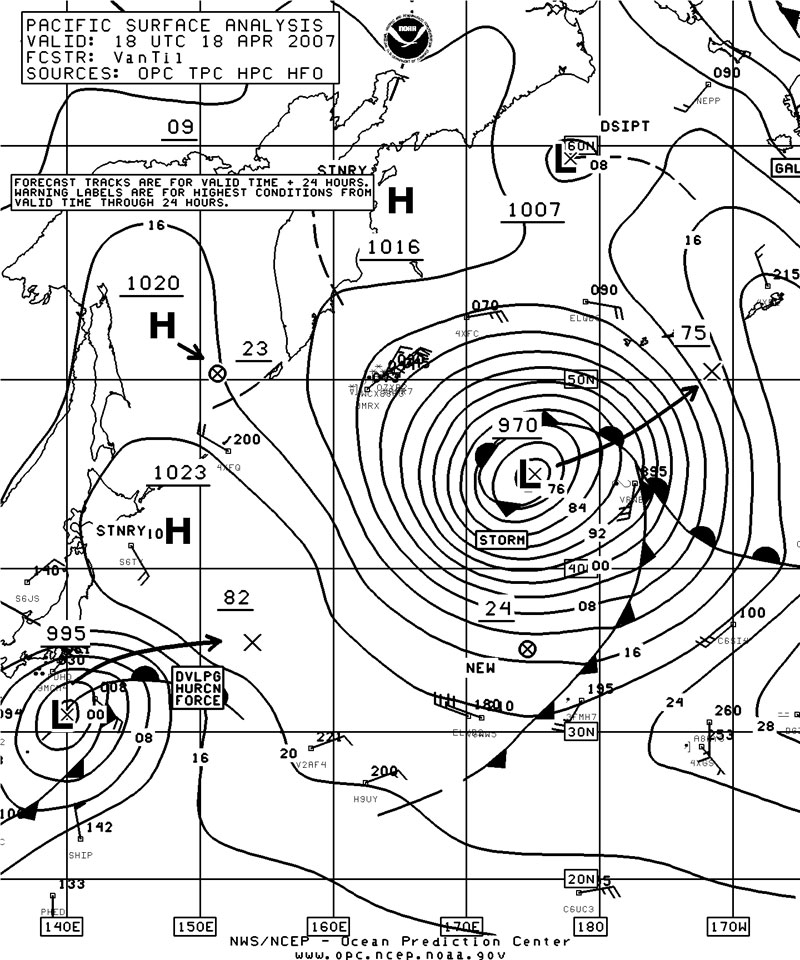
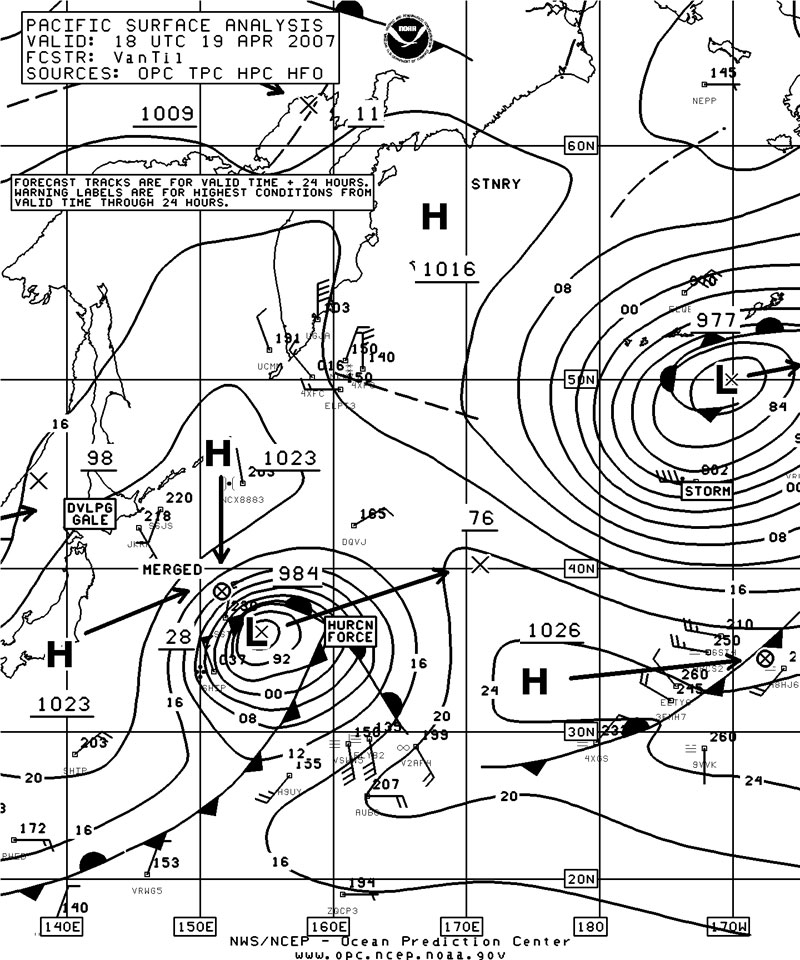
Figure 14. OPC North Pacific Surface Analysis charts (Part 2) valid 1800 UTC April 18 and 19, 2007.
(Click the image to enlarge.)
North Pacific Storm of April 18-22: The last major storm of the period began as low pressure that was already rapidly deepening as it passed south of Japan on April 18. Figure 14 displays the development and track of this storm. Winds of up to 80 kts appear on the northwest side of the low center in the 25-km scatterometer data (Figure 15), in the area of tightly-packed isobars in the second part of the figure. A vessel reporting using the generic SHIP identifier reported a northwest wind of 55 kts and 13.0-m seas (43 ft) near 34N 151E at 1800 UTC on the 19th. Although the cyclone continued to deepen through April 21 while heading northeast, the winds slowly decreased as the circulation expanded. Winds diminishing to gale force as the system passed south of the eastern Aleutians and started to rapidly weaken. The cyclone dissipated near Kodiak Island on the 25th.
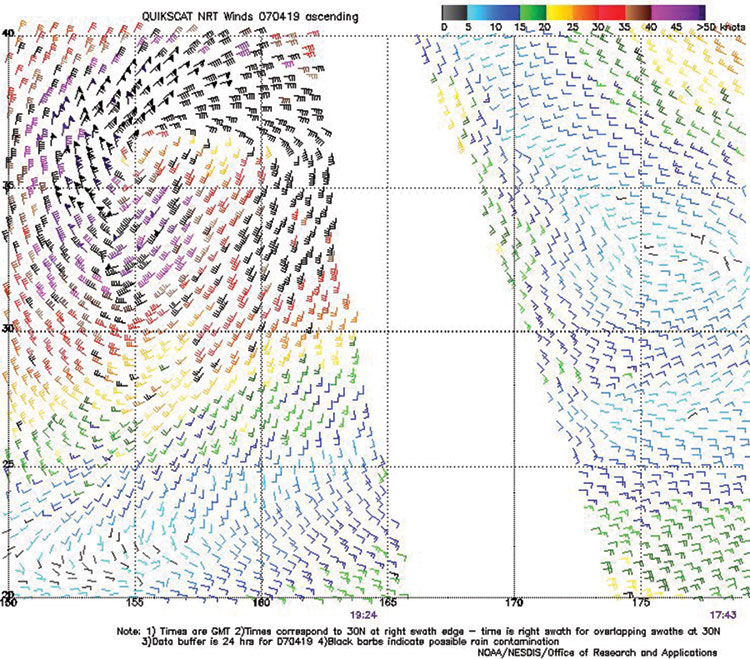
Figure 15. QuikScat scatterometer image of satellite-sensed winds valid at 1924 UTC April 19, 2007. Image is courtesy of NOAA/NESDIS /Office of Research and Applications.
(Click the image to enlarge.)