Marine Weather Review - North Atlantic Area
January through April 2007
By George P. Bancroft, NOAA National Center for Environmental Prediction
Introduction
The period of January to April 2007 included an exceedingly stormy period of January and February, with February having the most hurricane-force events seen in any month by this author. After a peak of 15 such events in February, the frequency dropped during March and April, with the latter having one hurricane-force low.
The pattern during the first three weeks of January was progressive, with lows developing off the northeast U.S. or Canadian coast and moving east or northeast before passing near or north of the British Isles. The pattern changed late in January and became more blocked, forcing cyclones north toward the Davis Strait or northeast over the North Atlantic with the lows stalling, turning west toward Labrador or looping near or south of Greenland. A more northeastward storm track resumed in March with the cyclonic systems moving toward Iceland or the Norwegian Sea. There was relatively little activity over the southeast waters such as off North Africa and the Iberian Peninsula where high pressure was common, with occasional trailing cold fronts. There was no tropical activity during the four-month period.
Significant Events of the Period
North Atlantic Storm, January 1-2: January started with a hurricane-force low moving northeast and passing just south of the Grand Banks early on the 1st with a lowest central pressure of 968 hPa. Hibernia Platform (HP6038 at 46.4N 48.4W) reported a north wind of 70 kt at 0900 UTC on the 1st. Three hours later another oil platform, YJUF7 (46.7N 48W) reported north winds of 72 kts, while the platform VEP717 (46.7N 48.7W) encountered north winds of 65 kts. At 1800 UTC January 1 the ship 9HCH7 (42N 51W) reported north winds of 50 kts and 10.0-m seas (32 ft), followed six hours later by a report of northwest winds of 40 kt and 10.5-m seas at 41N 49W. The system then weakened to a gale over the central North Atlantic on the 2nd before becoming absorbed.
North Atlantic Storm, January 7-9: This storm tracked northeast from the Gulf of St Lawrence early on January 7 and passed just north of the Grand Banks at 0000 UTC on the 8th with a 970-hPa central pressure. At that time the platforms Hibernia (HP6038) and VEP717 reported southwest winds of 60 kts with the latter also reporting 7.0-m seas (23 ft), and the ship SCKM (47N 42W) encountered southwest winds of 60 kts and 8.0-m seas (27 ft). The center passed 51N 37W and briefly developed hurricane-force winds early on the 8th, when a scatterometer pass revealed winds to 65 kts on the south side. The system then turned southeast and began to weaken but developed a new intensifying second center to the northeast, which passed just north of Scotland early on the 9th as a storm with the central pressure as low as 956 hPa. The old center dissipated with the new center moving into Norway later that day.
North Atlantic Storm, January 9-11: The development and track of this deep cyclone is depicted in Figure 1. During the initial twenty-four hours the central pressure dropped 28 mb, making this storm a meteorological "bomb." The central pressure of 950 hPa south of Iceland made this hurricane-force low one of the deepest of the period. Like the storm before it, this system produced southwest winds of 60 kts at the platform VEP717 (46.7N 48.6W) at 2100 UTC on the 9th. The time of the high-resolution QuikScat pass in Figure 2 falls about halfway between the times of the two parts of Figure 1. Figure 2 reveals winds to 70 kts on the backside as the storm center passed southeast of Greenland, plus winds as high as 65 kts in the southwest flow south of the center. Hurricane-force winds with this storm lasted until the center weakened and passed east of Iceland on the 11th. Some ship and buoy observations taken in this storm are listed in Table 1.
North Atlantic Storm of January 10-12: From initial formation as a storm-force low south of Nova Scotia early on the 10th, this system tracked northeast and developed hurricane-force winds after passing east of the Grand Banks at 1200 UTC on the 11th. This cyclone, although not as intense as its predecessor, was more compact and winds to 70 kts appeared in QuikScat data on the afternoon of the 11th. The center developed a central pressure down to 967 hPa when passing near 55N 34W at 0000 UTC on the 12th. The oil platform C6QE7 (49.4N 48.1W) reported northwest winds of 50 kts at 1500 UTC January 11.
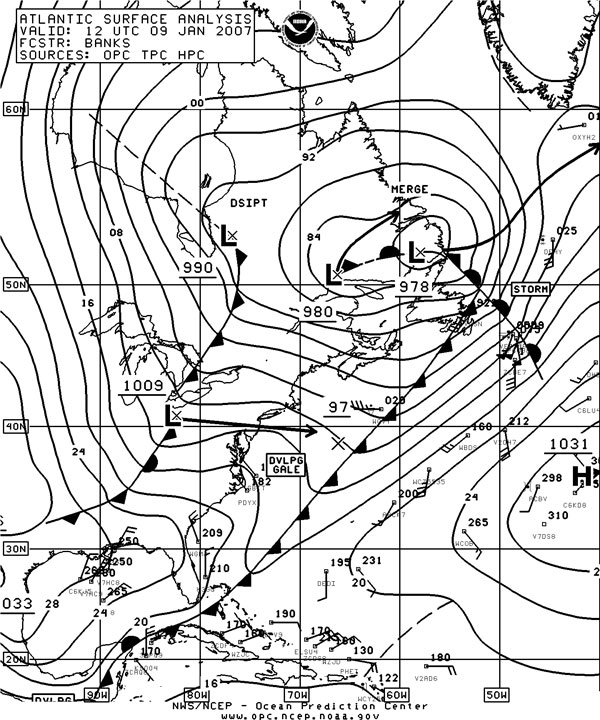
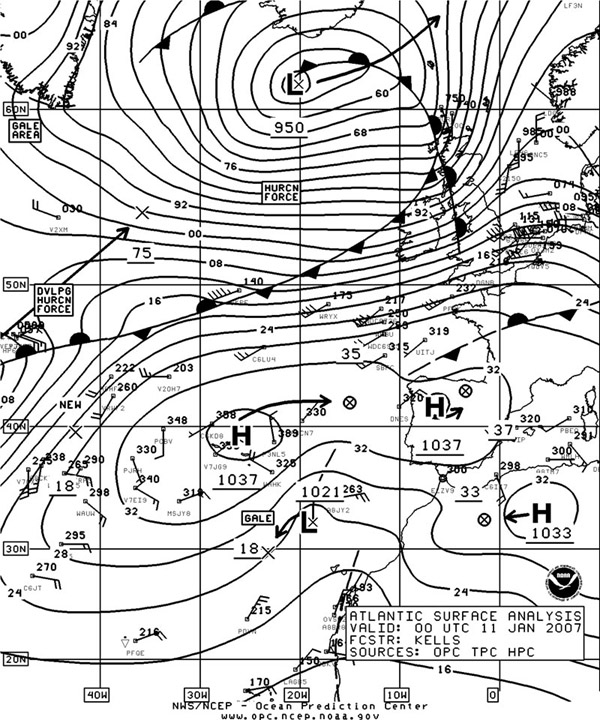
Figure 1. OPC North Atlantic Surface Analysis charts valid 1200 UTC January 9 (Part 2 - west) and 0000 UTC January 11, 2007 (Part 1 - east).
(Click the image to enlarge.)
| OBSERVATION | POSITION | DATE/TIME(UTC | WIND(kts) | SEAS(m/ft) |
|---|---|---|---|---|
| DEHY | 52N 46W | 09/1500 | S 50 | |
| Godafoss (V2XM) | 55N 42W | 10/0900 | SW 50 | 7.5/25 |
| Atlantic Companion (SKPE) | 50N 24W | 10/1800 | W 35 | 11.5/37 |
| Admiral Starikov (UDUR) | 60N 6W | 11/0000 | S 50 | |
| Buoy 62105 | 55.4N 12.3W | 10/2300 | 10.0/32 | |
| 11/1100 | maximum | 12.0/40 | ||
| Buoy 62090 | 53.1N 11.3W | 11/0700 | W 45 | 10.0/33 |
| Buoy 62095 | 53.1N 15.9W | 11/0100 | W 40 | 9.5/31 |
| maximum | 11.5/37 | |||
| Buoy 62108 | 53.5N 19.3W | 11/0200 | 11.5/37 | |
| 11/0900 | maximum | 13.0/43 | ||
| Buoy 64045 | 59.1N 11.4W | 11/1000 | W 50 | 10.5/34 |
| 11/1100 | maximum | 12.5/41 |
Table 1. Ship and buoy observations taken during the storm of January 9-11, 2007.
Three hours later the Atlantic Companion (SKPE) reported southwest winds of 45 kts and 9.0-m seas (30 ft). At 1800 UTC on the 12th the buoy 62105 (55.4N 12.3W) reported seas to 11.5 m (38 ft), almost as high as in the preceding storm. The cyclone then tracked northeast, passing north of Great Britain while maintaining its intensity before moving into Norway as a storm-force low later on the 12th.
North Atlantic Storm, January 13-15: Two subsequent cyclones followed along similar tracks after forming in the central waters, with the second briefly developing winds to 65 kts on the south side like those near the lower left side of Figure 2 late on the 14th. The central pressure reached 969 hPa as it moved north of the area shortly thereafter.
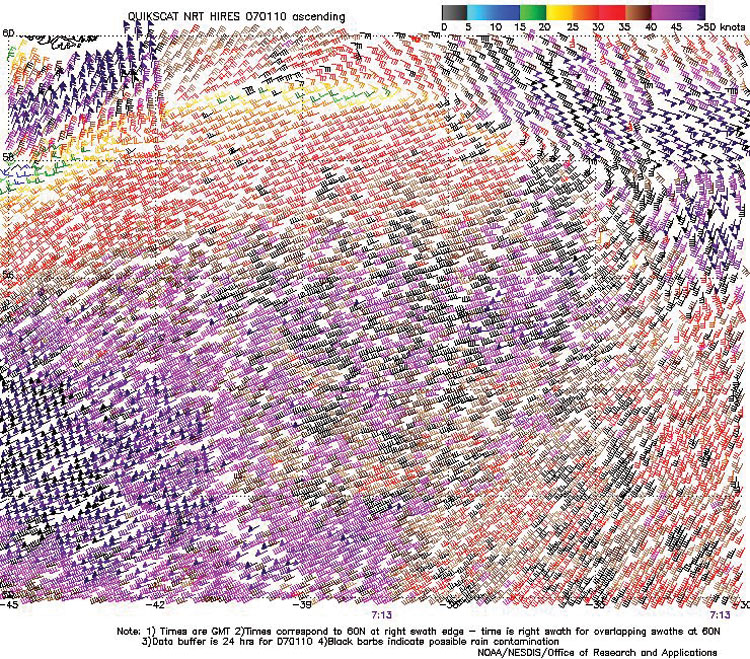
Figure 2. High-resolution QuikScat scatterometer image of satellite-sensed winds around the storm shown in Figure 1. The resolution is 12.5 km, versus 25 km in the coarser version of such imagery. The valid time of the pass is 0713 UTC January 10, 2007, or about seventeen hours prior to the valid time of the second part of Figure 1. The center of the storm appears near 59N 39W. Image is courtesy of NOAA/NESDIS/Office of Research and Applications.
(Click the image to enlarge.)
Northwest Atlantic and Greenland Storms, January 14-17: An initial low intensified rapidly as it entered the northwest Labrador Sea from the northwest on the 14th. The Ocean Prawns (VOSN) reported a northwest wind of 55 kts near 58N 60W at 1800 UTC on the 14th. The cyclone tracked southeast in an area lacking ship and buoy reports and developed hurricane-force winds on the southwest side by 1800 UTC on the 15th with the center near 56N 51W. The system re-developed north to a new center east of Greenland early on the 16th with the first part of Figure 3 showing the western side of this low that had hurricane-force winds. Figure 4 is a high-resolution QuikScat image revealing winds to 80 kt near the south Greenland coast with this new low while there is a separate area of west to northwest winds to 70 kts to the south, which is a reflection of the old low center. This new center stalled and dissipated by the 18th as a new hurricane-force low developed out of the Labrador Sea to a position south of Greenland (Figure 3). This system formed a new center near 60N 36W twelve hours later in a development similar to the previous as shown in the first part of Figure 3. These lows then drifted east with hurricane-force winds continuing until late on the 19th, and the lows were absorbed into a larger system moving northeast into Norway on the 20th.
North Atlantic and North Sea Storm of January 16-18: This development occurred about at the same time as the Greenland area storms described above and is depicted in Figure 3. Like the January 10-12 storm, this cyclone took only two days to cross the Atlantic and developed storm-force winds after passing east of Newfoundland late on the 16th. As the low developed a lowest central pressure of 964 hPa near 56N 11W at 0600 UTC on the 18th, a high-resolution scatterometer pass for 0525 UTC on the 18th revealed west winds to 70 kts just west of Ireland (Figure 4). The Berge Atlantic (LAIP5) encountered southwest winds of 40 kts and 8.5-m seas (28 ft) near 46N 21W at 1200 UTC on the 18th. The buoy 62108 (53.5N 19.3W) reported seas of 10.5 m (35 ft) one hour later. Some ship reports in the 50 to 60 kt range appear in the English Channel in the second part of Figure 3. The cyclone quickly moved into the Baltic Sea six hours later.
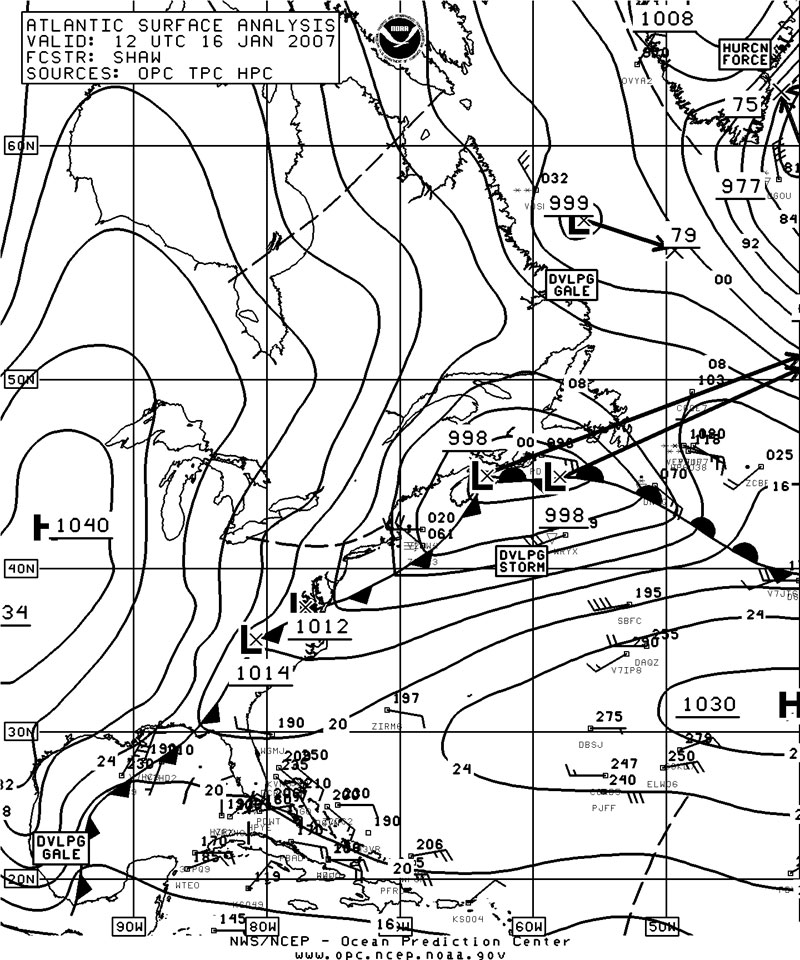
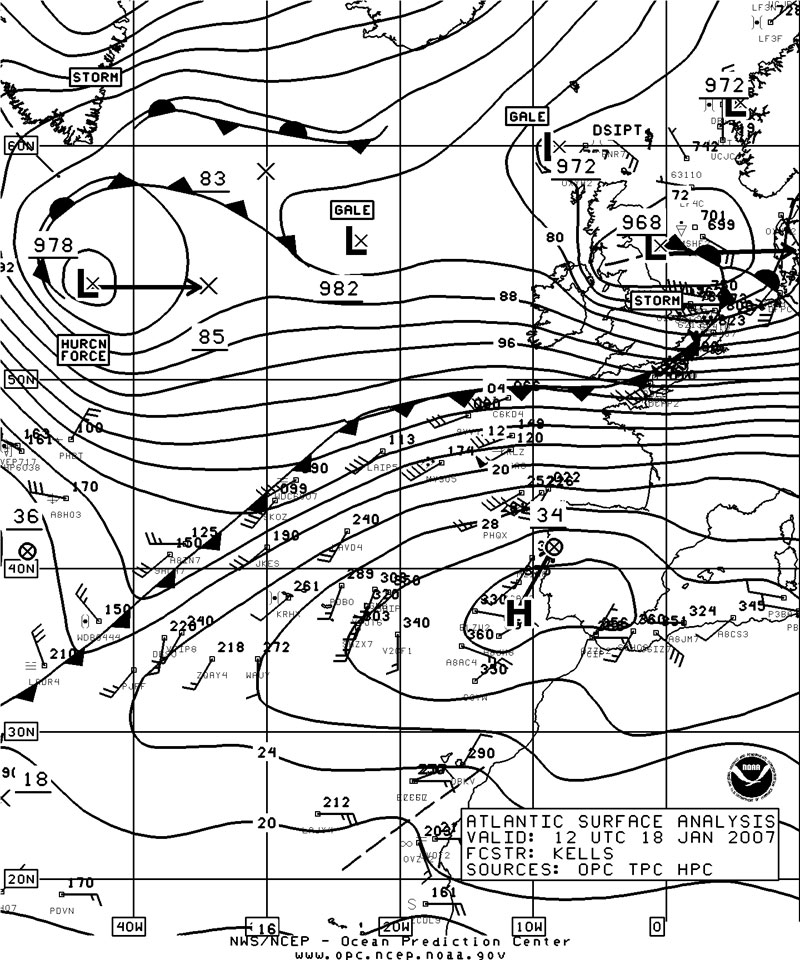
Figure 3. OPC North Atlantic Surface Analysis charts valid 1200 UTC January 16 (Part 2) and 1200 UTC January 18, 2007 (Part 1).
(Click the image to enlarge.)
| OBSERVATION | POSITION | DATE/TIME(UTC) | WIND(kts) | SEAS(m/ft) |
|---|---|---|---|---|
| WDC6736 | 34N 66W | 26/1200 | NW 55 | 12.5/41 |
| Faust (WRYX) | 37N 71W | 26/1200 | NW 45 | 10.0/33 |
| PHET | 33N 72W | 26/1400 | NW 55 | 7.5/24 |
| DINA | 43N 58W | 26/1800 | NE 70 | |
| WDC6736 | 34N 68W | 26/1800 | W 50 | 11.5/38 |
| Godafoss (V2XM) | 47N 53W | 27/0000 | E 60 | |
| PIAG | 40N 45W | 27/0000 | S 60 | |
| V2CF1 | 36N 64W | 27/0000 | NW 60 | |
| Buoy 44141 | 43N 58W | 26/2200 | W 45 | 5.5/18 |
Table 2. Ship and buoy observations taken during the storm of January 26-28, 2007.
Northwest Atlantic Storm of January 21-23: Following the initial movement of strong low pressure northward through the Canadian Maritime Provinces and Labrador Sea on the 19th and 20th, a secondary low formed near 40N 56W and moved northeast but was forced northwest over the Labrador Sea on January 22 due to increased blocking over the North Atlantic. Platform YJUF7 (46.7N 48W) and the ship MHN06 (45N 38W) reported southeast winds of 55 kts at 0600 UTC on the 21st and 0000 UTC on the 22nd, respectively. Hurricane-force winds occurred in the southeast flow against the southwest Greenland coast on January 22 as revealed by 65-kts winds in scatterometer wind imagery. The system weakened in the Davis Strait on the 23rd.
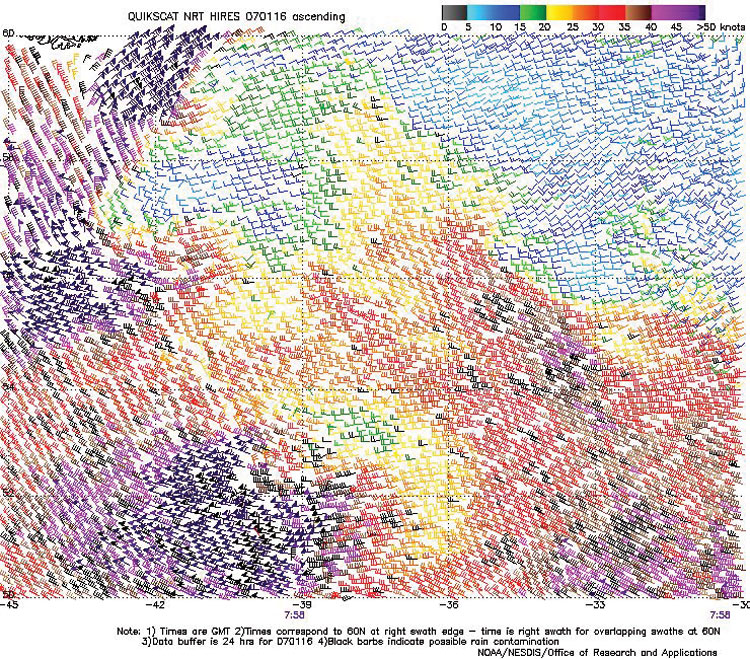
Figure 4. High-resolution QuikScat scatterometer image of satellite-sensed winds around the storm system passing east and southeast of Greenland shown in Figure 3. The resolution is 12.5 km, versus 25 km in the coarser version of such imagery. The valid time of the pass is 0758 UTC January 16, 2007, or about four hours prior to the valid time of the first part of Figure 3. The center of the storm appears near 59N 40W. Image is courtesy of NOAA/NESDIS/Office of Research and Applications.
(Click the image to enlarge.)
Western North Atlantic Storm, January 26-28: The rapid development of this storm from the merging of two lows is depicted in Figure 5. It took only eighteen hours from 0000 UTC on the 26th for hurricane-force winds to develop, with the central pressure dropping an impressive 45 hPa in the twenty-four hour period ending at 1800 UTC January 26. The central pressure bottomed out at 948 hPa with the center near Newfoundland. Selected ship and buoy observations taken during this storm are listed in Table 2 (previous page). The cyclone weakened thereafter, dissipating as a trough in the Labrador Sea late on the 28th.
North Atlantic Storm, January 28 to February 1: This system developed rapidly after moving off the southeast U.S. coast late on January 28, with OPC labeling it as a hurricane-force low as it passed just east of the mid-Atlantic offshore waters, which extend 250 nmi from the coast. The central pressure fell 27 hPa in the twenty-four hour period ending at 0000 UTC on the 30th, when the center was at 43N 56W with a 972 hPa pressure. The cyclone developed a lowest central pressure of 954 hPa near 53N 49W at 1800 UTC on the 30th, when Hibernia Platform (HP6038 at 46.4N 48.4W) and Platform VEP717 (46.7N 48.7W) reported southwest winds of 65 kts and 70 kts, respectively. At 1800 UTC on the 29th the ship 9HCH7 (40N 66W) reported a north wind of 55 kts while the vessel V2CF1 (37N 73W) encountered northwest winds of 45 kts and 9.5-m seas (31 ft). The cyclone then moved north-northeast while slowly weakening, passing east of Greenland by February 1.
North Atlantic Storm, January 31 to February 3: As the preceding storm was exiting, another storm developed south of the Canadian Maritimes on January 31 and lifted northeast on February 1 while deepening. The cyclone passed just east of Greenland on the 2nd with a central pressure as low as 963 hPa and winds briefly reaching hurricane force, before stalling and drifting southeast with a weakening trend as the next storm in the series approached.
Western North Atlantic Storms, February 2-5: The first developing storm moved off the mid-Atlantic coast of the U.S. and tracked northeast and then north across Newfoundland while intensifying, developing hurricane-force winds for about a twelve-hour period on the 3rd. The ship ZQCP3 (44N 55W) reported south winds of 65 kts and 7.0-m seas (23 ft) at 0600 UTC on the 3rd. Platform VEP717 east of the low center reported southeast winds of 65 kts at 1200 UTC on the 3rd, while Hibernia (HP6038) encountered southeast winds of 62 kts. The ship SCKB (47N 51W) reported south winds of 50 kts and 10.5-m seas (35 ft) at that time. The cyclone then developed a lowest central pressure of 962 hPa in the Labrador Sea late on the 3rd before becoming absorbed. The next developing storm followed a similar track and became as deep (948 hPa) as the storm of January 26-28 as it overtook and absorbed the preceding system early on February 4. The central pressure dropped an impressive 43 hPa in the twenty-four hour period ending at 1200 UTC on the 4th. At that time the Ocean Prawns (VOSN) reported southwest winds of 50 kts near 49N 52W, while Hibernia (HP6038) encountered southwest winds of 45 kts and 6.0-m seas (20 ft). Six hours prior to this, the ship SCKB (46N 54W) encountered west winds of 50 kts and 10.0-m seas (32 ft). The cyclone briefly developed hurricane-force winds while turning west in the northwest Labrador Sea early on the 5th before weakening inland late on the 5th.
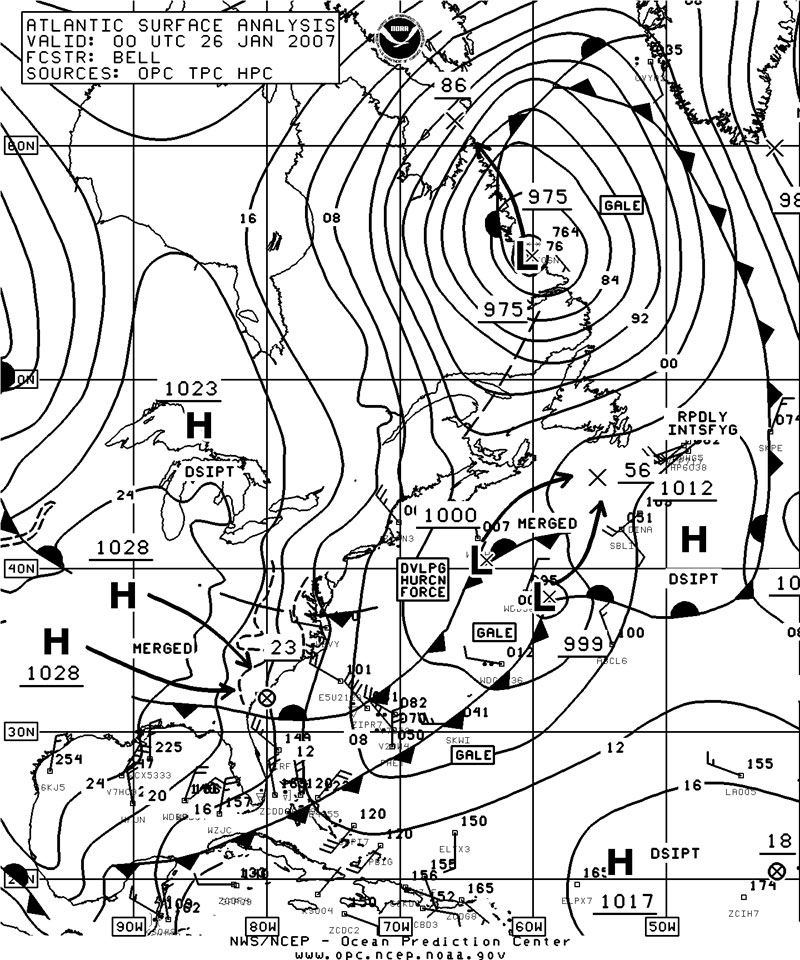
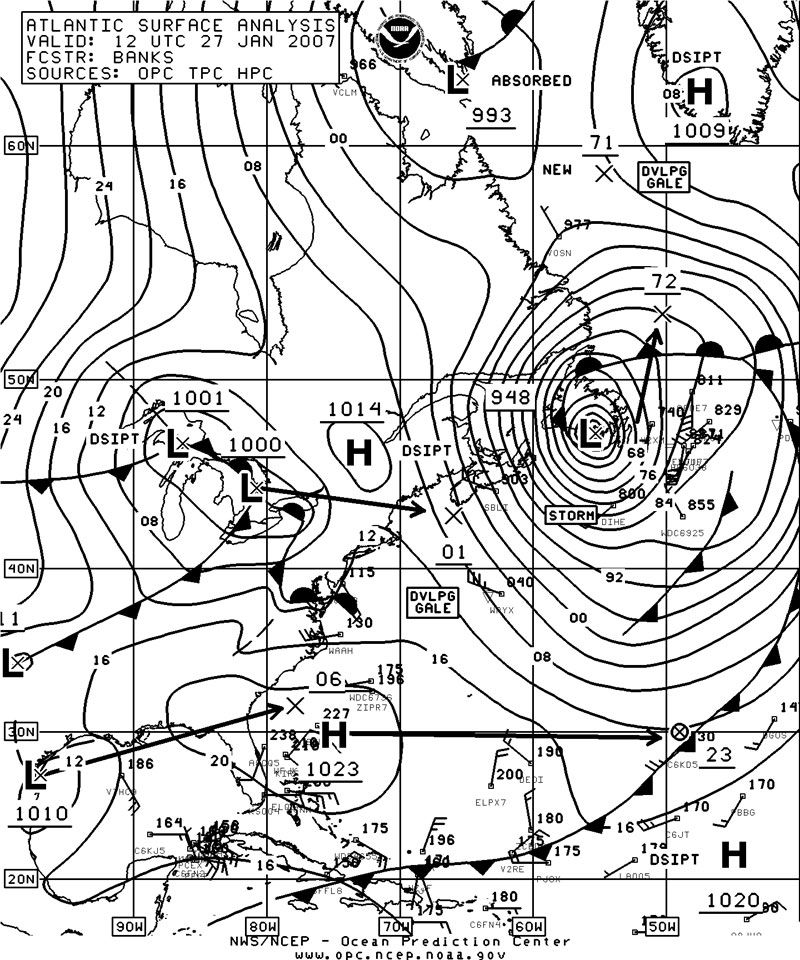
Figure 5. OPC North Atlantic Surface Analysis charts (Part 2) valid 0000 UTC January 26 and 1200 UTC January 27, 2007.
(Click the image to enlarge.)
North Atlantic Storm, February 5-8: This cyclone, unlike the previous two, passed east of Newfoundland and out into the Atlantic while rapidly intensifying. The system redeveloped to the east after passing north of the Grand Banks on the 6th. The central pressure dropped 46 hPa in the twenty-four hour period ending at 1800 UTC on the 6th, almost 2 hPa per hour. The center developed a lowest central pressure of 950 hPa near 56N 41W at 0000 UTC February 7. At that time the Godafoss (V2XM) near 53N 44W encountered west winds of 60 kts. The Berge Nord (LADY5) reported northwest winds of 45 kts and 8.0-m seas (26 ft) near 50N 23W at 1200 UTC on the 7th. OPC analyzed this cyclone as a hurricane-force low on the 6th. The storm then turned northwest into the Labrador Sea and weakened to a gale by the 8th, before weakening inland.
North Atlantic Storms of February 7-11: The first of two powerful hurricane-force lows originated near the U.S. mid-Atlantic coast early on the 7th and tracked east-northeast. As this storm developed hurricane-force winds by 1800 UTC February 8, the second low formed just south of Nova Scotia. The central pressure of the first low dropped 35 hPa in the twenty-four hour period ending at 1800 UTC on the 8th. Figure 6 shows the lead (eastern) low at maximum intensity (949-hPa central pressure) while the second low to the west was still intensifying. The second low developed a central pressure of 964 hPa near 49N 34W at 0600 UTC on the 10th. Figure 7 displays 12.5 km QuikScat scatterometer winds around the second storm, revealing winds of 95 kts southwest of the center. Special parallel processing of 25 km data found Category 3 winds in both storms based on the Saffir-Simpson scale for tropical cyclones (References 1 and 2), with the area of such winds over a larger area in the first storm. NOAA P-3 hurricane hunter-type aircraft flew into both storms and confirmed QuikScat's ability to detect hurricane-force winds. This was the first time winds of Category 3 or major hurricane strength were found in QuikScat data (Reference 2). The first system subsequently dissipated near Ireland early on the 10th while the second system maintained hurricane-force winds through 0000 UTC on the 11th before weakening to a gale north of Ireland on the 11th. Table 3 lists selected ship and buoy observations taken in these storms.
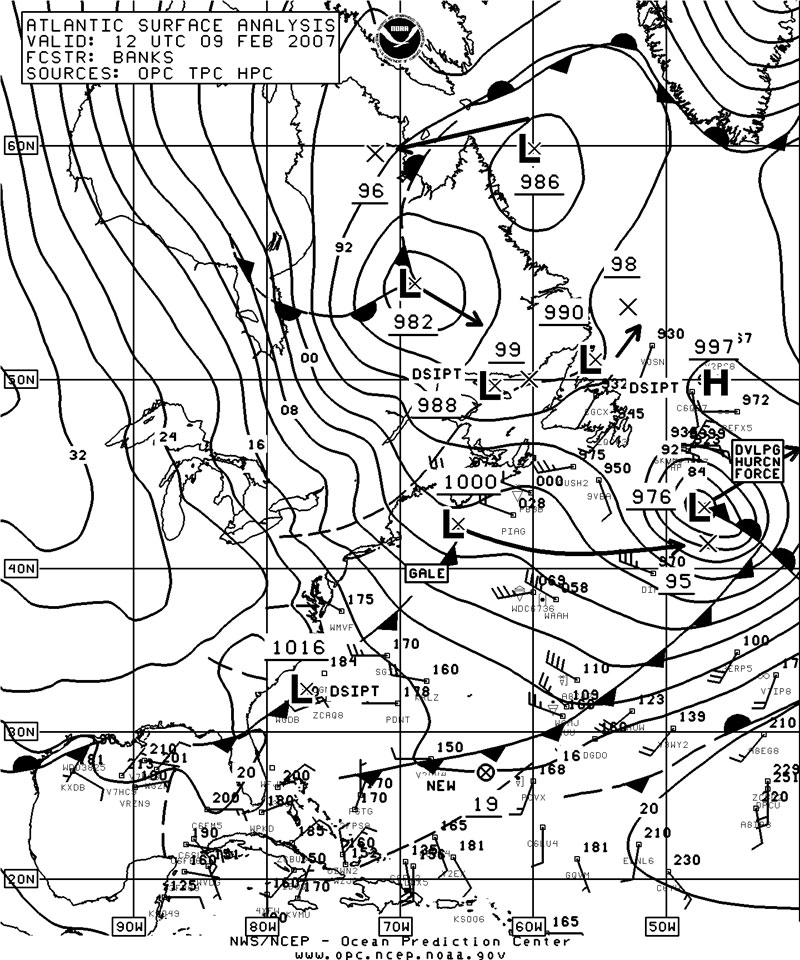
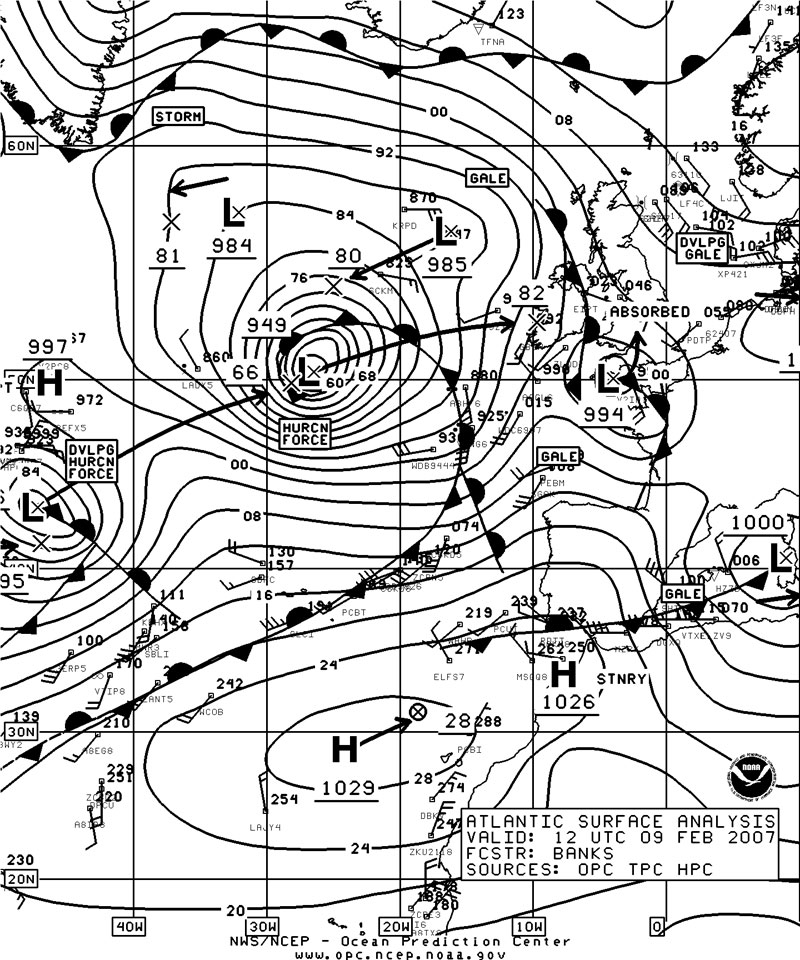
Figure 6. OPC North Atlantic Surface Analysis charts (Parts 1 and 2) valid 1200 UTC February 9, 2007.
(Click the image to enlarge.)
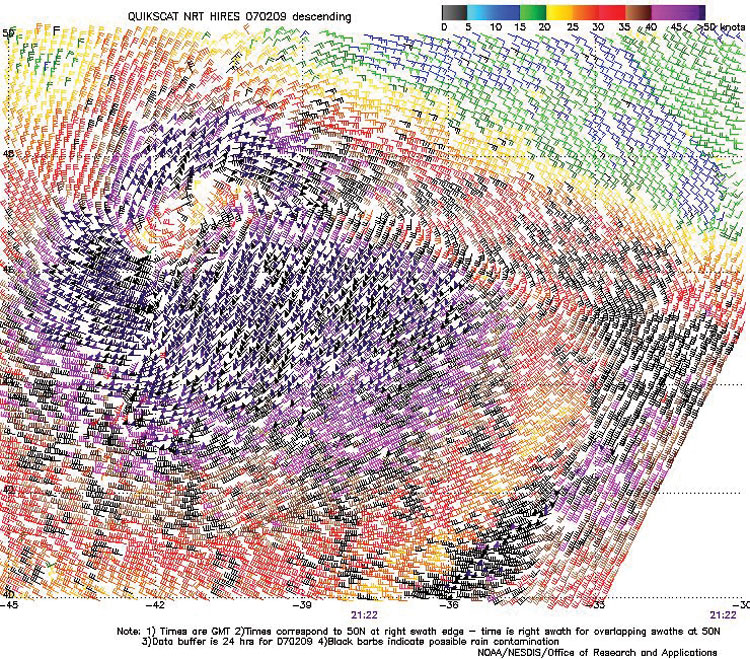
Figure 7. High-resolution QuikScat scatterometer image of satellite-sensed winds around the second hurricane-force low passing through the central North Atlantic waters in Figure 6. The valid time of the pass is 2122 UTC February 9, 2007, or about nine and one-half hours later than the valid time of Figure 6. The center of the storm appears near 47N 41W. Image is courtesy of NOAA/NESDIS/Office of Research and Applications.
(Click the image to enlarge.)
| OBSERVATION | POSITION | DATE/TIME(UTC) | WIND(kts) | SEAS(m/ft) |
|---|---|---|---|---|
| WAAH | 38N 58W | 09/1200 | NW 35 | 6.5/22 |
| A8CJ2 | 33N 57W | 09/1200 | NW 40 | |
| Contship Endeavour (ZCBE7) | 42N 39W | 09/1800 | W 55 | 8.0/27 |
| Vasiliy Lozovskiy | 56N 17W | 10/0000 | E 50 | |
| (UCUD) | 56N 17W | 10/1200 | E 45 | 12.0/40 |
| BATFR14 | 47N 11W | 10/0900 | W 30 | 16.0/52 |
| Buoy 62095 | 53.1N 15.9W | 10/0600 | E 10 | 10.0/33 |
| Buoy 62081 | 51.0N 13.1W | 10/0600 | W 25 | 13.5/45 |
| Buoy 62029 | 48.7N 12.3W | 10/0800 | SW 30 | 14.5/47 |
Table 3. Ship and buoy observations taken during the storms of February 7-11, 2007.
North Atlantic Storm, February 10-12: Low pressure tracked from near Nova Scotia east-northeast and intensified to 974 hPa near Ireland at 0000 UTC February 12. Scatterometer winds revealed 65-kts winds southwest of Ireland near that time. The first part of Figure 8 shows this storm moving over the British Isles and beginning to weaken. The ship MHN06 (47N 16W) reported northwest winds of 45 kts at 0000 UTC on the 12th. The cyclone then weakened to a gale and crossed the North Sea on the 12th.
Storms near Greenland, February 10-12: Figure 8 shows one of a series of weak lows passing southwestward near the southern tip of Greenland. This pattern persisted from the 10th through the 12th. Northeast winds against the southern Greenland coast were similar to those depicted in Figure 9.
North Atlantic Storm of February 11-15: Figure 8 depicts the development of this storm over the east-central and northeastern waters. This cyclone originated south of Newfoundland near 40N early on the 11th. The second part shows the storm at maximum intensity with a central pressure of 949 hPa. Blocking at high latitudes forced this system and others in February to slow while moving north or even loop back to the southwest and then southeast, as this one did. The scatterometer winds in Figure 9 reveal winds to 60 kts with 65 kts on the northwest side as the system looped toward Greenland. The Bonn Express (DGNB) reported northwest winds of 55 kts near 48N 40W at 1800 UTC on the 14th. The hurricane-force winds ended late on the 14th, with the system weakening west of France on the 15th.
Northeast Atlantic Storm, February 13-16: The next storm to the south near 46N 34W in the second part of Figure 8 developed marginal hurricane-force winds from late on the 13th until early on the 14th. This system stalled upon reaching 54N 25W on the 14th and then redeveloped to the north near Iceland as a 953-hPa low 61N 21W on the 15th, before moving across Iceland on the 16th. The Berge Atlantic (LAIP5) reported southwest winds of 50 kts near 45N 27W at 0000 UTC on the 14th.
North Atlantic Storm, February 17-20: This low formed near 45N 41W early on February 17 and quickly developed storm-force winds while moving northeast, with the ship MAHG5 (49N 24W) reporting south winds of 55 kts at 0000 UTC on the 18th. The cyclone developed a lowest central pressure of 965 hPa near 56N 29W and brief hurricane-force winds at 1200 UTC on the 18th. The cyclone turned northwest toward Greenland later that day and developed hurricane-force winds against the southeast Greenland coast on the 19th. The low then looped southwest and dissipated on the 20th.
North Atlantic Storm of February 19-23: This development originated near the U.S. mid-Atlantic coast early on the 18th, with the cyclone becoming a storm while passing south of Newfoundland on the 19th. The ships PCAW (35N 64W) and HZZB (40N 71W) encountered northwest winds of 60 kt at 1800 UTC February 19. The system developed multiple centers and hurricane-force winds as it continued to intensify and move over the Grand Banks, with a lowest pressure of 950 hPa for the main center at 47N 48W 1200 UTC on the 20th. Hibernia Platform (46.4N 48.4W) reported a west wind of 75 kts at 1800 UTC on the 20th. Six hours later Platform VEP717 (46.7N 48.7W) reported west winds of 65 kts and 9.0-m seas (29 ft). Additionally, the ship DDDI2 (39N 42W) reported 13.5-m seas (44 ft) at 1500 UTC on the 20th. The sprawling cyclonic system developed hurricane-force winds near the south tip of Greenland on the 21st and 22nd, with the Nuka Arctica (OXYH2, 58N 44W) reporting northeast winds of 70 kts and 10.5-m seas (34 ft) at 1200 UTC on the 22nd. The system slowly weakened beginning on the 21st and moved east on the 22nd, weakening to a gale near the British Isles on the 23rd.
North Atlantic Storm, February 22-25: Initial development consisted of the offshore redevelopment of an eastern Great Lakes low in a twenty-four hour period through 1800 UTC on the 23rd resulting in a 969-hPa hurricane-force low 40N 61W. The ship KVMU (35N 73W) reported north winds of 50 kts and 9.5-m seas (31 ft) at 1200 UTC on the 23rd. The vessel MZFR9 (35N 57W) at 0600 UTC on the 24th encountered west winds of 50 kts and 10.5-m seas (35 ft). The cyclone developed a lowest central pressure of 959 hPa near Cape Race where it stalled, with a new center developing to the south and taking over. The new center moved north and stalled in the southern Labrador Sea on the 26th, before moving southeast and weakening to a gale late on the 27th. The Nuka Arctica (OXYH2) reported east winds of 70 kts near 58N 45W at 1200 UTC on the 27th.
Northeast Atlantic Storm of February 28 to March 1: A new low formed near 52N 27W at 0000 UTC on the 27th and developed a lowest central pressure of 961 hPa near 60N 4W at 1200 UTC February 28. Six hours later the Galveston Bay (WPKD) reported northwest winds of 65 kts near 58N 10W.
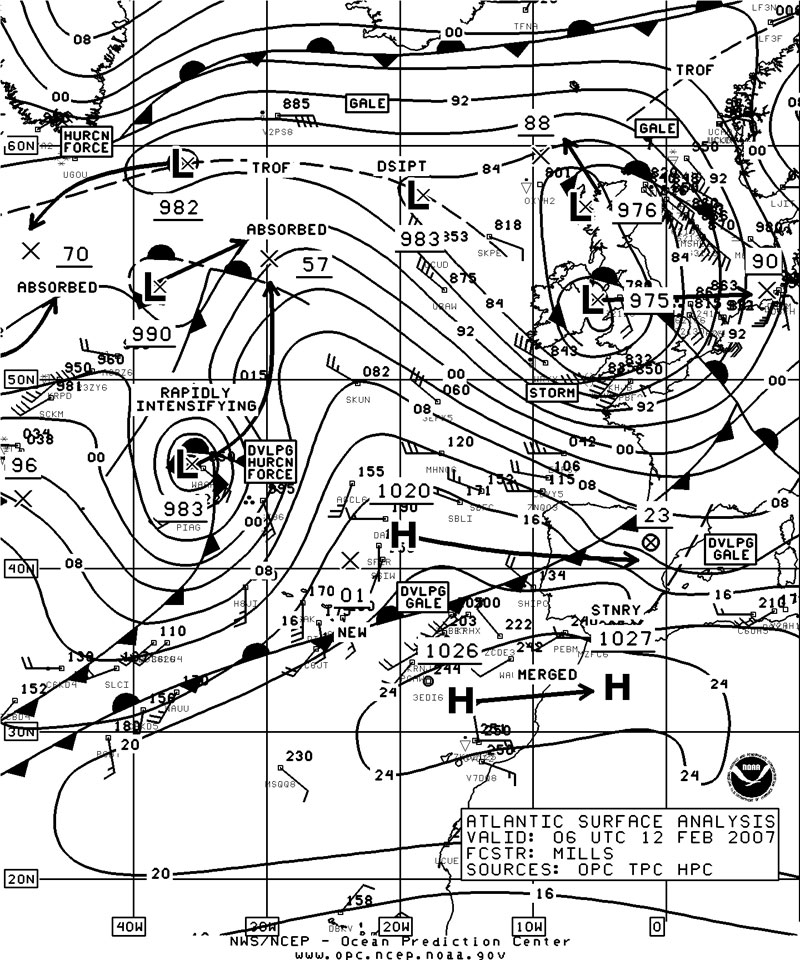

Figure 8. OPC North Atlantic Surface Analysis charts (Part 1) valid 0600 UTC February 12 and 1800 UTC February 13, 2007.
(Click the image to enlarge.)
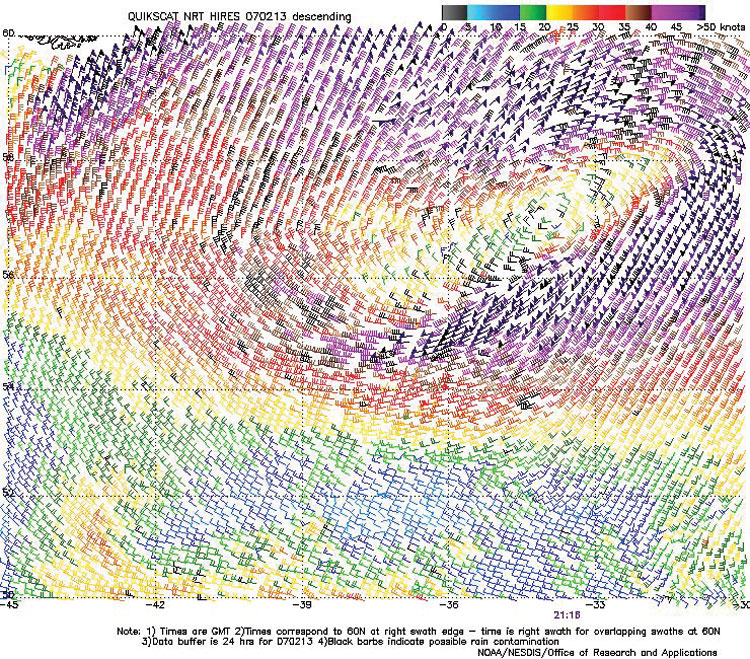
Figure 9. High-resolution QuikScat scatterometer image of satellite-sensed winds around the storm shown in the second part of Figure 8. The valid time of the pass is 2116 UTC February 13, 2007, or about three hours later than the valid time of the second part of Figure 8. The center of the storm appears near 57N 34W. Image is courtesy of NOAA/NESDIS/Office of Research and Applications.
(Click the image to enlarge.)
North Atlantic Storm, March 3-5: Low pressure formed in the south-central waters on March 2 and moved northeast, developing a central pressure down to 952 hPa near 56N 13W at 1800 UTC March 4. The central pressure fell 41 hPa in the twenty-four hour period ending at 1200 UTC on the 4th. Near this time high-resolution scatterometer winds revealed winds 65 to 70 kts. The ship 3EDI6 (47N 31W) reported northwest winds of 55 kts at 0000 UTC on the 4th. Six hours later the vessel LAVY4 (40N 19W) reported west winds of 35 kts and 13.0-m seas (43 ft). The ship UBAW (53N 16W) encountered west winds of 60 kts at 1800 UTC on the 4th. The cyclone then weakened near Iceland on the 5th and became absorbed on the 6th.
North Atlantic Storm of March 6-9: Low pressure developed near Nova Scotia early on March 6 with storm-force winds. The ship PCEO (39N 60W) reported west winds of 55 kts twelve hours later. The system then tracked east-northeast and then turned more north, developing a central pressure down to 960 hPa near 58N 36W at 0600 UTC on the 8th. A high-resolution scatterometer pass near that time revealed winds to 75 kts on the south side of the low center. The Berge Nord (LADY5) near 48N 43W reported southwest winds of 45 kts and seas 10.5 m (35 ft) at 1200 UTC on the 8th. Buoy 64045 (59N 11.7W) reported seas to 10.5 m (34 ft) at 1300 UTC March 9. The storm subsequently weakened near Iceland on the 9th.
North Atlantic Storm of March 9-12: This powerful storm originated south of Newfoundland near 40N at 0000 UTC on the 9th. Figure 10 displays the period of most rapid development of this storm, with the central pressure dropping 45 hPa in the twenty-four hour period ending at 1800 UTC on the 10th. The lowest central pressure of 943 hPa (27.85 inches) made this cyclone the deepest of the period. The infrared satellite image in Figure 11 reveals a mature system with broad cold-topped frontal features and well-defined center surrounded by wrap-around cold-topped cloud bands. In Figure 12, hurricane-force winds up to 75 kts even in this coarse version of QuikScat imagery appear in the south semicircle of the well-defined center in an area lacking conventional observations. The ship SCKB (46N 33W) reported southwest winds of 50 kts and 11.5-m seas (37 ft) at 1200 UTC on the 10th, followed six hours later by a report of southwest winds of 45 kts and 13.0-m seas (42 ft). The Berge Atlantic (LAIP5 near 48N 21W) encountered west winds of 55 kts and 10.0-m seas (32 ft) at 1800 UTC on the 11th. Buoy 64045 (59.2N 11.4W) reported southwest winds 30 kts and 12.0-m seas (40 ft). The storm maintained hurricane -force winds until 1200 UTC on the 11th while moving northeast, with the weakening low moving past Iceland on the 12th.
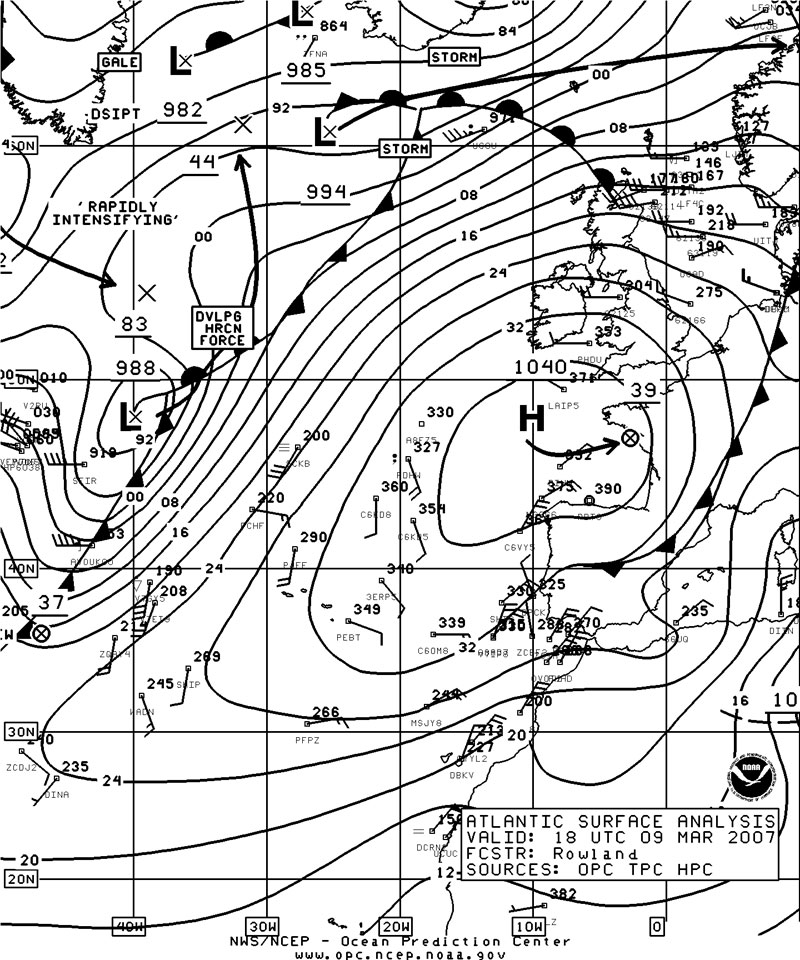
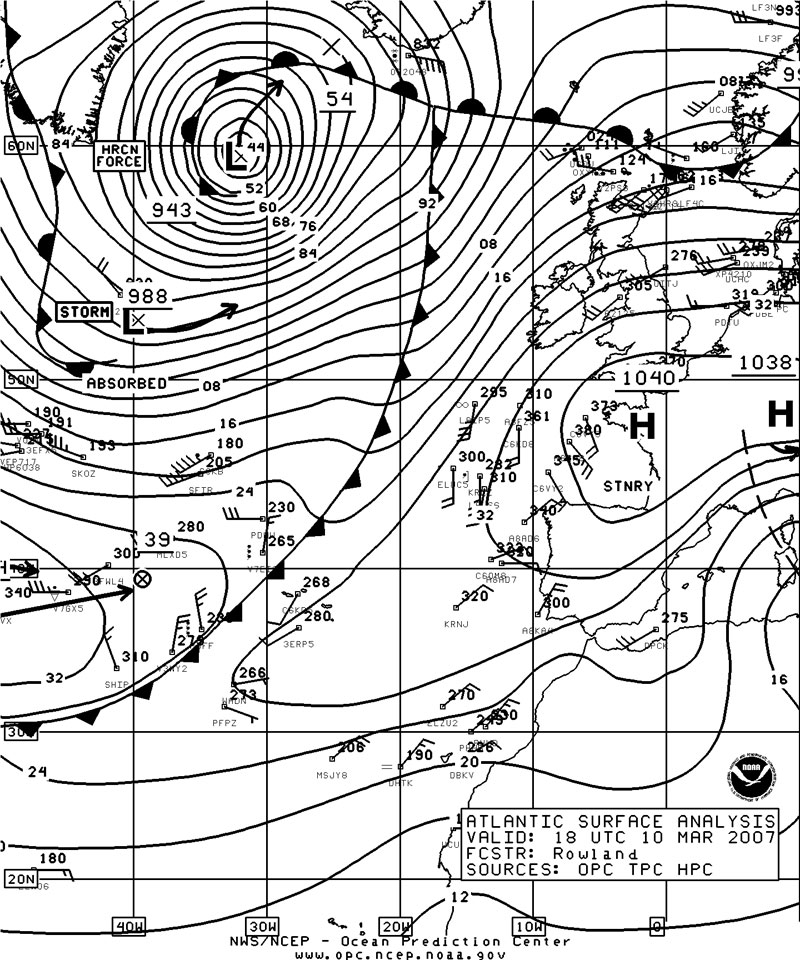
Figure 10. OPC North Atlantic Surface Analysis charts (Part 1) valid 1800 UTC March 9 and 10, 2007, showing the development of the most intense storm of the period.
(Click the image to enlarge.)
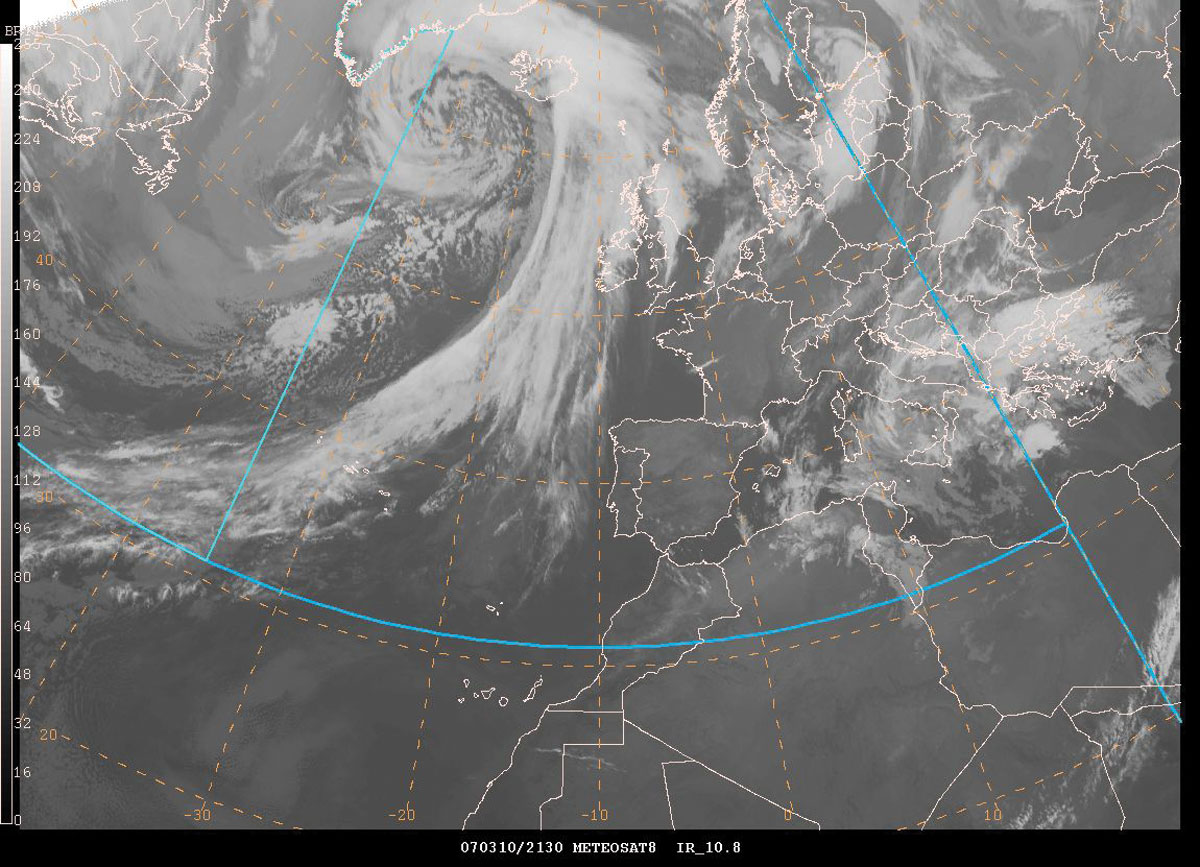
Figure 11. METEOSAT8 infrared satellite image valid at 2130 UTC March 10, 2007 showing the storm in Figure 10 near maximum intensity. Satellite senses temperature on a scale from black (warm) to white (cold) in this type of imagery. The valid time is three and one-half hours later than the valid time of the second part of Figure 10.
(Click the image to enlarge.)
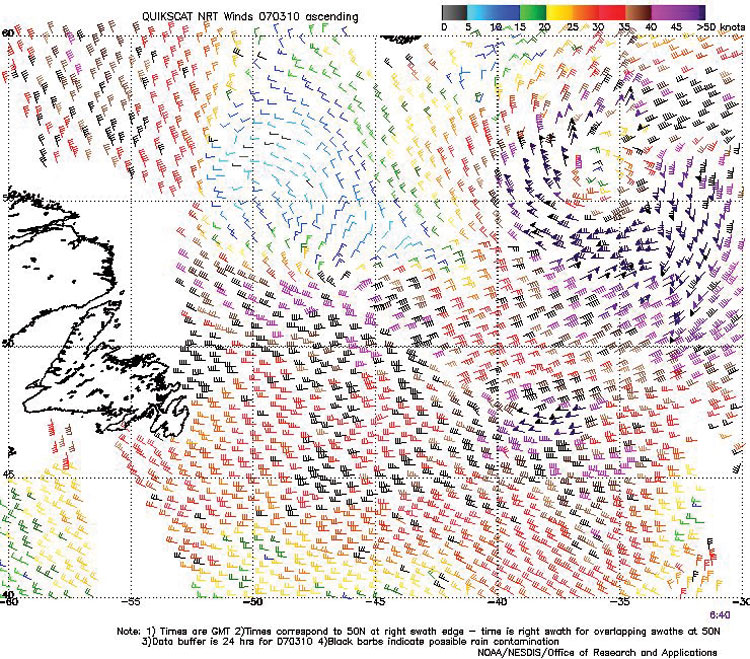
Figure 12. QuikScat scatterometer image of satellite-sensed winds around the storm shown in the second part of Figure 10, valid at 0640 UTC March 10, 2007. The resolution of the image is 25 km. The valid time of the pass is about eleven hours prior to the valid time of the second part of Figure 10. The center of the storm appears near 56N 35W in the upper-right side of the image. Image is courtesy of NOAA/NESDIS/Office of Research and Applications.
(Click the image to enlarge.)
North Atlantic Storm, March 12-15: This low formed well south of Nova Scotia near 35N on the 11th and followed a track west of the 943 hPa low described above. While the low passed west of the Grand Banks, Hibernia Platform (HP6038) reported southeast winds of 65 kt at 1800 UTC on the 12th. This hurricane-force system then moved east of Greenland with a 956-hPa central pressure late on March 13 where it stalled followed by slow weakening. The cyclone then weakened to a gale-force low north of the area by the 15th.
Northeast Atlantic Storm of March 17-19: The explosive development of this storm is shown in Figure 13, with the central pressure dropping 51 hPa in the twenty-four hour period ending at 0600 UTC March 18, or more than 2 hPa per hour on average. Development was aided by the potent 500-hPa short wave trough south of Iceland shown in Figure 14, and an unusually strong 135-kts 500-hPa jet to the west. More information on use of the 500-hPa chart may be found in Reference 3. The cyclone developed a lowest central pressure of 952 hPa six hours later, with a weakening trend following as the storm moved into Norway. At 1200 UTC on the 18th the buoy 62157 (57.4N 1.4E) reported a west wind of 80 kts. Six hours prior, 62138 (58.3N 1.8W) reported a west wind 75 kts.
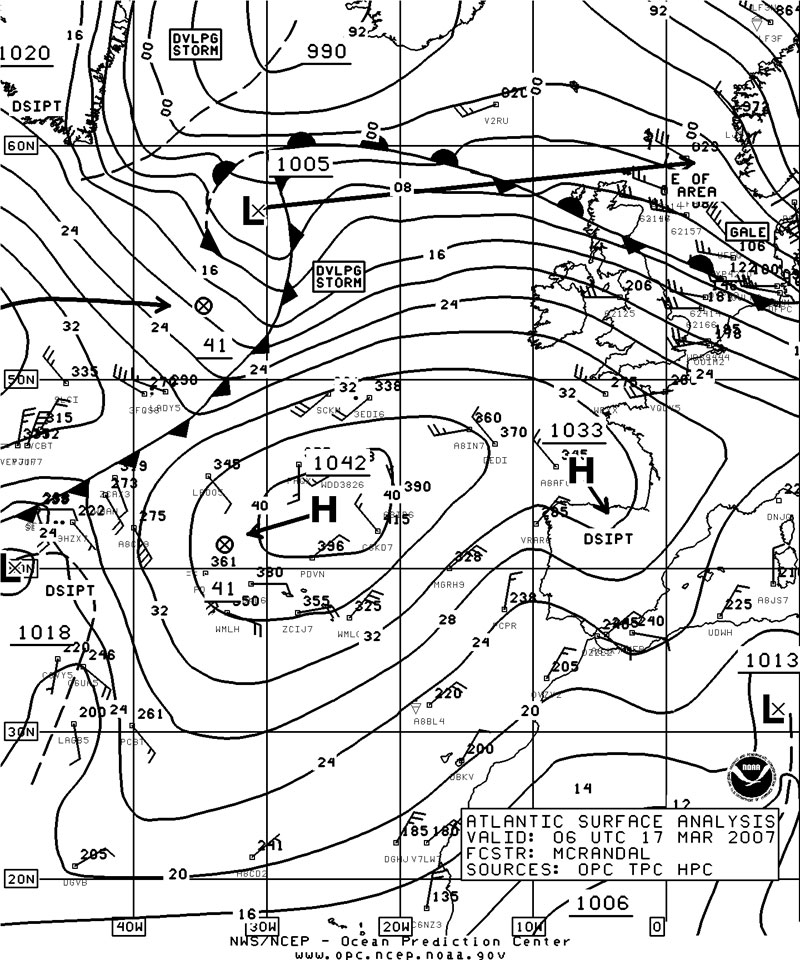
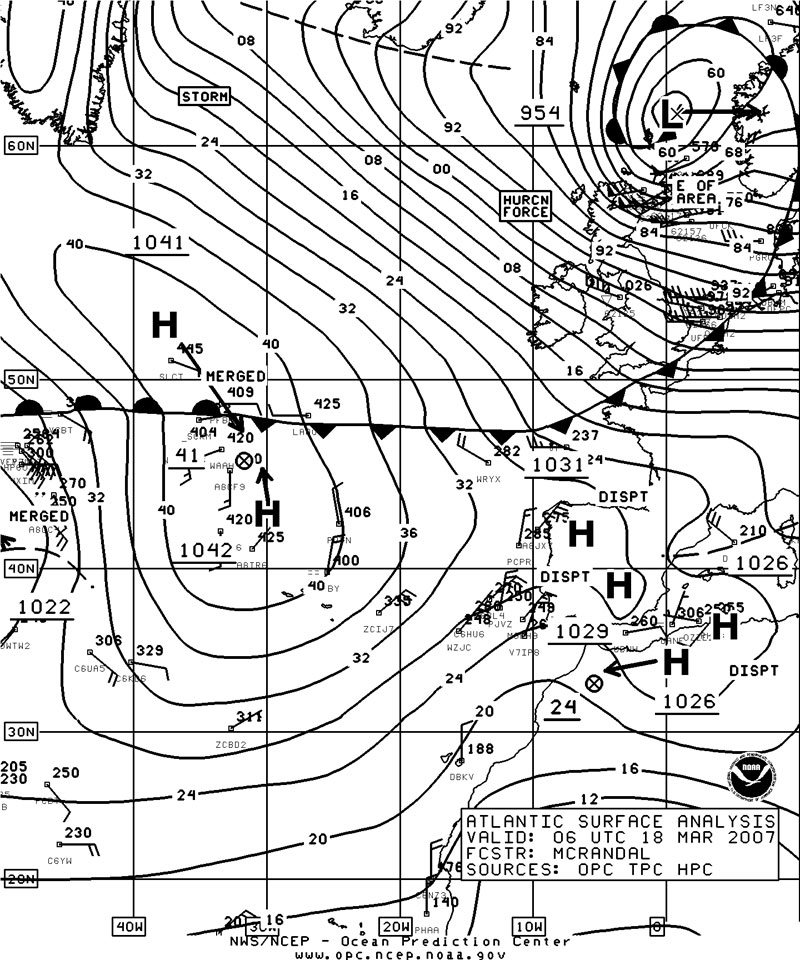
Figure 13. OPC North Atlantic Surface Analysis charts (Part 1) valid 0600 UTC March 17 and 18, 2007.
(Click the image to enlarge.)
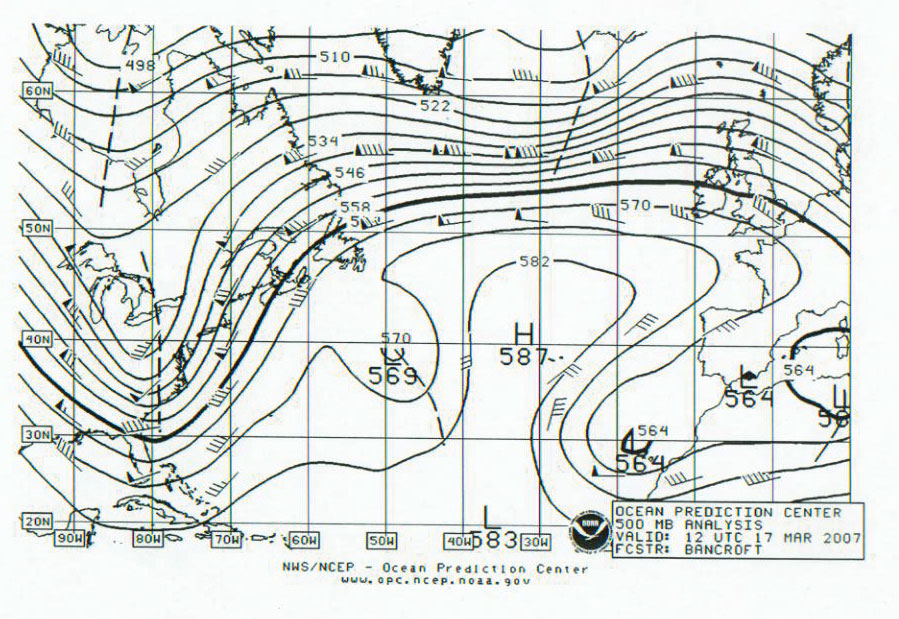
Figure 14. 500-mb Analysis of the North Atlantic valid at 1200 UTC March 17, 2007. This chart is computer-generated with short-wave troughs (dashed lines) manually added. The valid time is six hours later than that of the first part of Figure 13.
(Click the image to enlarge.)
Southwestern North Atlantic Storm of March 25-27: Low pressure formed off the U.S. mid-Atlantic coast at 1800 UTC March 24 and moved east-northeast, becoming a storm twenty-four hours later near 39N 59W with a 1000 hPa central pressure. The cyclone developed hurricane-force winds six hours later which continued until the 27th. The central pressure dropped 35 hPa in the twenty-four hour period ending at 0600 UTC on the 26th, when the center was at 41N 53W with a 982-hPa central pressure. At 0000 UTC March 26 the ship VSWW5 (40N 59W) reported northeast winds of 50 kts and 8.0-m seas (26 ft). Six hours later the ship MLCA2 (42N 53W) encountered northwest winds of 50 kts. The strongest wind report was at the platform YJUF7 (46.7N 48W),with a southeast wind of 73 kts at 0000 UTC on the 27th. The cyclone then moved north past the Grand Banks and weakened to a gale late on the 27th, became absorbed by another low and moved to the Davis Strait on March 31.
North Atlantic Storm, April 11-13: This storm developed from a frontal wave of low pressure off Cape Hatteras early on April 10 with Figure 15 showing the final twenty-four hours of development into a hurricane-force low. The most notable ship report was a northwest wind of 65 kts and 14.0-m seas (46 ft) from the ship PCBU (45N 37W) at 1200 UTC on the 12th. At 0600 UTC on the 13th the ship SCKB (51N 28W) encountered southwest winds of 55 kts and 9.0-m seas (30 ft). The cyclone continued to deepen slowly as it moved toward Iceland, although the winds diminished to gale force as the center passed west of Iceland late on the 13th.
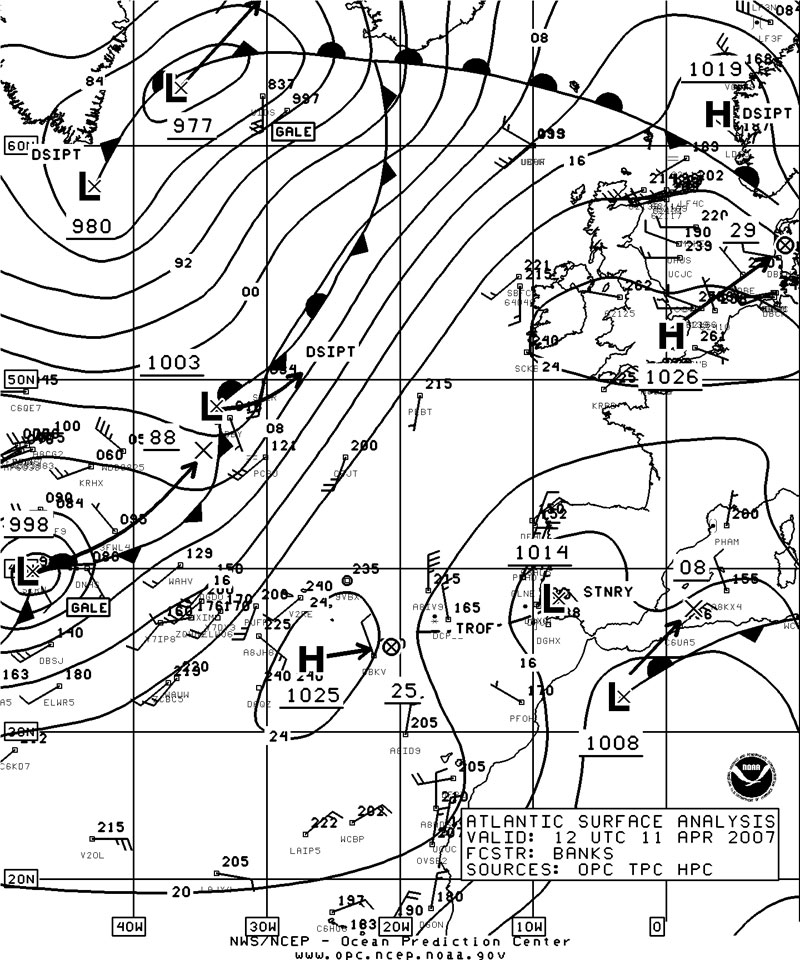
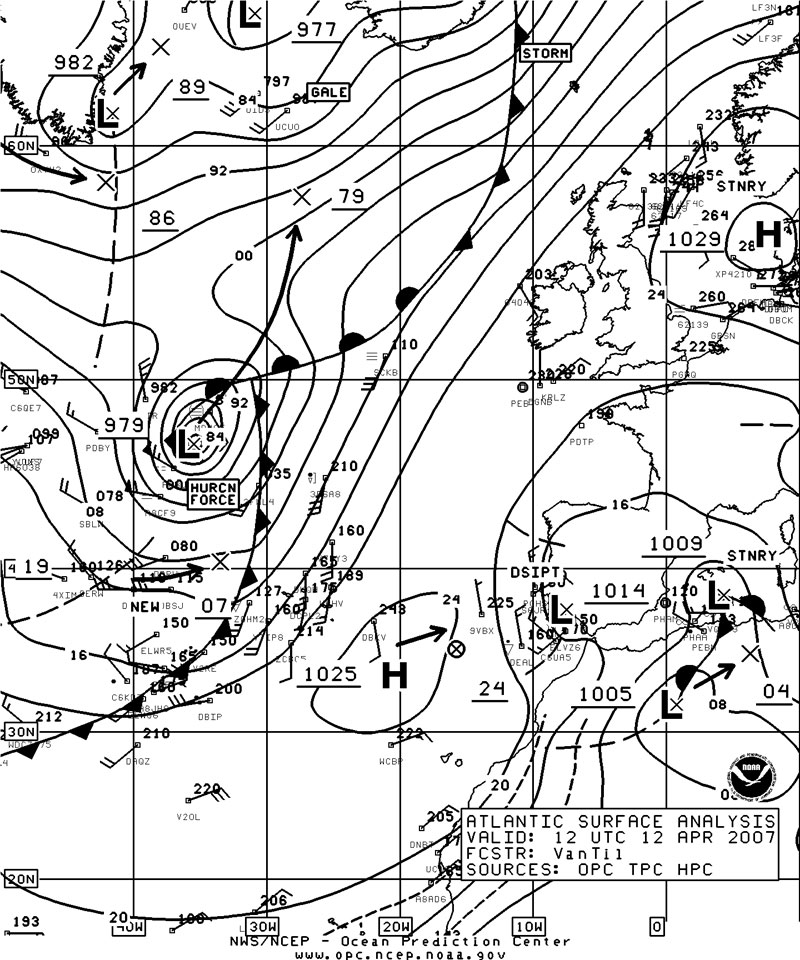
Figure 15. OPC North Atlantic Surface Analysis charts (Part 1) valid 1200 UTC April 11 and 12, 2007.
(Click the image to enlarge.)
Coastal Storm, April 15-17: This storm was unusually strong for April and impacted the northeast and mid-Atlantic coast of the U.S. and adjacent waters. After initial development over the Carolinas early on the 15th, the low developed into a coastal storm on the 15th which hugged the coast as it moved north. The lowest central pressure was 968 hPa near 41N 73W at 1200 UTC on the 16th. A slow drift to the southeast and a slow weakening trend followed. The system did not weaken to a gale until early on the 18th. Some selected ship, buoy and automated coastal platforms are listed in Table 4.
| OBSERVATION | POSITION | DATE/TIME(UTC) | WIND(kts) | SEAS(m/ft) |
|---|---|---|---|---|
| WDC6736 | 32N 79W | 16/0000 | SW 55 | |
| DCPL2 | 34N 70W | 16/1200 | SW 50 | |
| PCBU | 43N 69W | 17/1200 | NE 50 | |
| Buoy 44013 | 42.4N 70.7W | 16/1000 | E 39 G51 | 6.0/20 |
| 16/1300 | maximum | 8.0/27 | ||
| Buoy 44005 | 43.2N 69.1W | 16/1300 | E 41 G52 | 7.0/23 |
| 16/1500 | peak gust 54 | |||
| 16/1700 | maximum | 8.5/28 | ||
| Buoy 44011 | 41.1N 66.6W | 16/1800 | maximum | 9.0/30 |
| Buoy 44025 | 40.3N 73.2W | 16/0800 | maximum | 5.5/18 |
| 16/1300 | Pressure 966.4 mb | |||
| Buoy 41001 | 34.7N 72.7W | 16/0700 | SW 35 G49 | 8.5/28 |
| maximum | 10.0/33 | |||
| Buoy 41025 | 35.0N 75.4W | 16/0200 | SW 37 G45 | 4.5/15 |
| 15/2200 | Peak gust 54 | |||
| 15/2300 | maximum | 5.5/18 | ||
| Chesapeake Light | 36.9N 75.6W | 16/0700 | NW 47 G54 | |
| CHLV2 | 16/0100 | Peak gust 59 | ||
| Isles of Shoals | 43N 70.5W | 16/1100 | E 52 G56 | |
| IOSN3 | 16/1200 | Peak gust 64 | ||
| Matinicus Rock | 43.8N 68.7W | 16/1500 | E 55 G63 | |
| MISM1 | Peak gust 67 | |||
| Buoy 62095 | 53.1N 15.9W | 10/0600 | E 10 | 10.0/33 |
| Buoy 62081 | 51.0N 13.1W | 10/0600 | W 25 | 13.5/45 |
| Buoy 62029 | 48.7N 12.3W | 10/0800 | SW 30 | 14.5/47 |
Table 4. Ship, buoy and Coastal C/MAN observations taken during the coastal storm of April 15-17, 2007.
References
From Tropical Prediction Center website, http://www.nhc.noaa.gov/aboutsshs.shtml.
Cat-3 Hurricane Conditions twice (E-mail communication through Sienkiewicz, Joseph (OPC), February 10, 2007)
Sienkiewicz, J. and Chesneau, L., Mariners Guide to the 500-Millibar Chart (Mariners Weather Log, Winter 1995).