Breakthroughs in Nautical Charting: Paper to Electronic
Nick Perugini, CAPT, NOAA (ret.).
A nautical chart depicts the nature and shape of the coast, water depths and general topography of the ocean floor, locations of navigational dangers, the rise and fall of tides, and locations of human-made aids to navigation. The nautical chart is one of the most fundamental tools available to the mariners, who use charts to plan voyages and navigate ships using the shortest, safest, and most economical routes. NOAA is exclusively responsible for the production and authorization of nautical chart data in U.S. waters and NOAA's Office of Coast Survey continually updates its collection of over 1,000 current charts.
"We've fetched up, ah, hard aground, north of Goose Island, off Bligh Reef and, ah, evidently leaking some oil and we're gonna be here for a while..."
Captain Joseph Hazelwood's voice crackled over the radio in the U.S. Coast Guard station in Valdez, Alaska, just after midnight on March 24, 1989, revealing to the world the most infamous and costly oil spill in U.S. history. The 987-foot Exxon Valdez oil tanker had run aground in Prince William Sound, on a rocky reef that was clearly marked on the ship's NOAA paper nautical chart (Figure 1).
Could the Exxon Valdez grounding have been prevented? At the time of the grounding, mariners used paper nautical charts to plan voyages. While the National Transportation Safety Board concluded that the captain and the third mate of the Exxon Valdez made serious errors, it is possible that, had it been available at the time, today's electronic chart systems, fueled by NOAA data, could have helped to avoid this catastrophe.
In the past two decades, new advances in technology have made it possible for NOAA to deliver nautical charts in electronic formats that provide powerful tools for enhancing navigational safety. The story below follows breakthroughs in nautical charting...from paper to electronic charts.
Paper Nautical Charts: The Way It Was
In 1989, mariners relied on paper nautical charts produced by NOAA cartographers using a manual drafting and engraving process. Because it could take up to eight months to revise and print a paper chart, new editions of paper charts were only released every two years or more, meaning that these static paper versions were essentially only current on the day printed. For chart updates, mariners had to check weekly Local Notices to Mariners published by the U.S. Coast Guard and U.S. Notice to Mariners published by the former Defense Mapping Agency (now the National Geospatial Intelligence Agency).
Plotting a Fix on a Paper Chart
At the time of the Exxon Valdez grounding, a common technique used for determining a vessel's position was to sight visual bearings on charted landmarks or fixed aids to navigation and combine these bearings with ranges and bearings measured from radar. With the use of dividers and a ruler, a mariner manually plotted a vessel's current position, or "fix", on a paper chart. The entire process to determine the fix could take several minutes and required the mariner's full attention.
Once the position was plotted on the chart, the mariner could estimate the ship's position at any time after the fix. The technique, called "dead reckoning," involves advancing a known position using course, speed, time, and distance traveled.
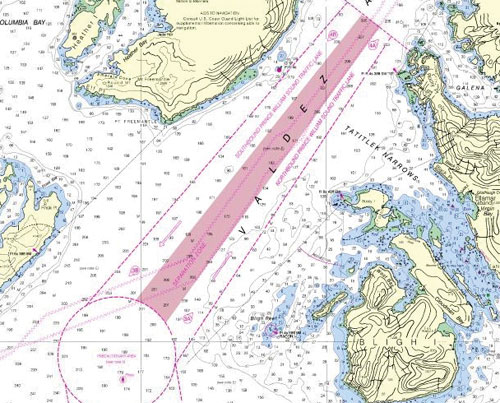
Figure 1. This figure shows the approximate trackline of the Exxon Valdez on NOAA chart 16708. Small icebergs were pushing into the traffic lane from Columbia Bay.
(Click the image to enlarge.)
Paper Nautical Chart Limitations: A Look at the Exxon Valdez
In high traffic shipping areas, inbound and outbound traffic lanes have been established to reduce the number of collisions and groundings. These lanes are clearly marked on nautical charts and mariners chart their courses to stay within these lanes.
In the case of the Exxon Valdez, just before midnight on March 23, Captain Hazelwood received permission from the U.S. Coast Guard to alter the ship's course in order to avoid icebergs reported to be in the ship's path out of Prince William Sound. His plan was to maneuver the ship across the zone separating inbound and outbound traffic lanes, and then turn right to proceed outbound within the limits of the inbound traffic lane.
After explaining this plan to the third mate, the captain retired below deck at 11:53 pm. In the next several minutes, the ship passed through the traffic separation zone and crossed into the inbound traffic lane. Rather than turning and proceeding along the inbound lane as planned, the ship continued to head south and out of the traffic lane. The third mate, who was perhaps occupied with sighting bearings or measuring radar ranges and then plotting fixes on a paper chart, was unaware that the vessel was off course until it was too late.
Minutes before the grounding, the third mate manually plotted a fix indicating that the Exxon Valdez was out of the traffic lane and needed to turn right. At approximately the same time, a lookout reported seeing a signal light in a position that indicated great peril for a supertanker that was out of its lanes and accelerating through shallow waters. Eventually, realizing that the ship was in serious trouble, the mate phoned the captain to report the danger. The conversation ended at 12:04 AM with a shock to the vessel: the ship was aground and leaking oil.
Electronic Navigational Charts: The Way It Is
Throughout the 1990s, advancements in technology transformed the appearance, use, and functionality of nautical charts, fueling dramatic improvements in navigational safety. A first step in this transformation was creating digital images of paper nautical charts, called raster charts. Raster charts could be viewed on the bridge of a ship using a simple computer. Raster charts advanced maritime navigation by allowing mariners to quickly observe a vessel's position by using global positioning system (GPS) data with charts. However, raster charts do not address all of the limitations associated with paper charts, mainly that they do not provide danger warnings to the mariner.
To address the limitations of paper and raster charts, in 1997 NOAA's Office of Coast Survey started building a vector charting database. A vector chart is a series of points, lines, and polygons that represent features on the chart. Chart information is stored in a database and specific characteristics are identified for each chart feature. For example, database information for a buoy on a chart might include characteristics such as latitude, longitude, color, and number.
NOAA's vector charts are called Electronic Navigational Charts (NOAA ENCs®) and conform to international charting standards (Figure 2). An ENC is a digital file that contains all chart information shown on paper charts needed for safe navigation. NOAA is the official producer of ENC data for U.S. waters. Mariners use ENC data in sophisticated Electronic Chart Display and Information Systems (ECDIS), which are installed on the bridge of a ship.
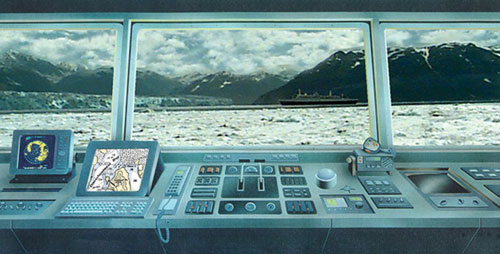
Figure 2. Electronic Charts are now commonplace aboard vessels.
Advantages of Electronic Navigational Charts
NOAA ENCs® are often called "smart charts" because of their vector capability. The database nature of vector charts means that specially designed electronic chart software can be programmed to recognize certain features on a chart, giving vector charts an inherent "intelligence." For example, software can be used to recognize charted water depth; if a vessel is in danger of entering shallow water, a warning can be issued well in advance. An electronic chart using vector data can also detect if a vessel is crossing an important maritime boundary, such as a traffic separation zone.
ENCs offer several other advantages over static paper charts (Figure 3). Users can tell a computer to display only the information desired, while the computer can continue to process all available information, whether displayed or not. Navigation system software can continuously monitor the ship's position relative to all NOAA ENC® features and sound alarms if a hazardous situation is detected. The software can check that planned routes will provide safe passage for the vessel by checking for proximity to dangers and crossing areas with insufficient depth. Additionally, ENC data may be updated weekly, allowing mariners to view up-to-date charts at all times.
Electronic charts that utilize NOAA ENCs® are the one of the greatest advancements in maritime safety since the introduction of radar to ships. NOAA will continue to produce paper charts for those users who do not choose to use electronic charts.
NOAA ENCs® can be downloaded for free from the Internet. http://chartmaker.ncd.noaa.gov/MCD/enc/index.htm
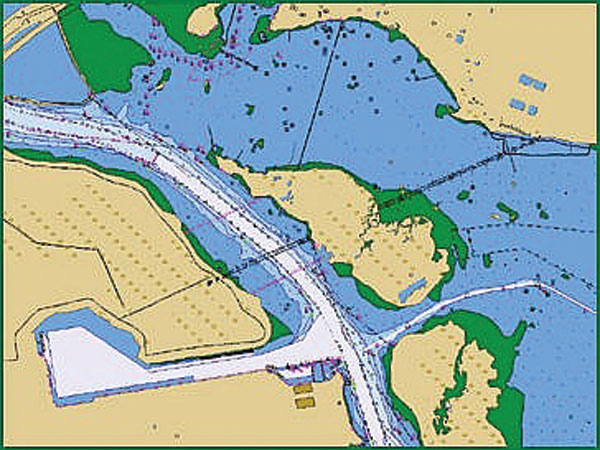
Figure 3. Vector charts displaying NOAA ENC offer several advantages over paper charts. In this image, the triangle on the chart represents an area for which, if the vessel enters the area, a warning will be given.
(Click the image to enlarge.)
Conclusion: Could ENCs Have Prevented the Exxon Valdez Grounding?
Had the Exxon Valdez been equipped with navigation software to view a NOAA ENC® of Prince William Sound, a warning might have sounded when the ship crossed the traffic lanes. If the operator had chosen to use the warnings capability, a warning could also have been issued when the software predicted that, based on course and speed, the ship was on track to enter dangerously shallow waters. Additionally, on many of today's commercial ships, electronic charting displays are mounted in different locations aboard the ship, including in the captain's cabin. It is possible that the captain of the Exxon Valdez, who had retired to his cabin just before the grounding, would have noticed the ship's dangerous track on his own electronic chart display and given orders to turn the ship earlier.
No one can say for certain that today's electronic chart technology could have prevented the grounding of the Exxon Valdez in 1989. Human error is a major cause of maritime accidents today, just as it was in 1989. However, one thing is certain: NOAA has played a pivotal role in developing electronic charting technology over the last twenty years. These technological advancements have made navigation in U.S. waters safer and have reduced the probability of other supertanker groundings.
Raster Charts
Throughout the 1990s, advancements in technology transformed the appearance, use, and functionality of nautical charts, fueling dramatic improvements in navigational safety. A first step in the transformation from paper to electronic charts was creating digital raster charts.
In 1994, NOAA's Office of Coast Survey digitally scanned its entire suite of 1,000 paper charts. These digital charts are called "raster charts."
Commercial companies created software that allowed mariners, using standard computers aboard ships, to display real-time Global Positioning System (GPS) vessel positions over an image of a chart. These systems, called Raster Chart Display Systems (RCDS), immediately proved to be a valuable new navigational tool: one glance at the raster chart display and a mariner could immediately determine vessel position relative to important geographic features. This eliminated the time-consuming process needed to establish a fix using a paper chart.
In addition to creating a new tool for mariners, the creation of a suite of raster charts also made NOAA's cartographic chartmaking more efficient. Charts could now be updated in timely manner using Computer Aided Design (CAD) software in lieu of the manual techniques of the past. Chart updates that once took months to deliver to the mariner could now be made available electronically through a weekly update service operated by NOAA and its private partner, Maptech.
Raster charts are still used by mariners today. Thanks to the development of raster chart technology, mariners can download raster charts and updates for free over the Internet. In addition, the same technology used to create raster charts fuels "Print on Demand" paper charts, providing up-to-date charts that can be immediately printed following purchase.
While raster charts advanced maritime navigation in the 1990s, they did not address all of the limitations associated with paper nautical charts. A raster chart is a direct copy of an existing paper nautical chart -- the chart is stored as one whole image and a computer displaying a raster chart recognizes only this one image. The computer is unable to differentiate between the items, such as a buoy and a shipwreck, or to recognize if a charted water depth is too shallow to clear a vessel. Because of the inability to distinguish information on a chart, raster systems are said to have no inherent "intelligence." This lack of intelligence means that raster charts have a minimal ability to provide danger warnings to the mariner (Figure 4).
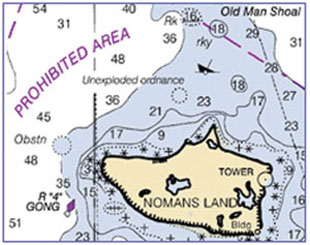
Figure 4. Raster Chart Display System on bridge of ship.
Bibliography
Arkenau, L., Black D., & Legeer, S. 2004. NOAA's digital update service, Print-On-Demand, and critical chart correction Web site. Retrieved May 12, 2006, from http://www.thsoa.org/hy01/13_1.pdf
Exxon Valdez Oil Spill Trustee Council. 2006. Exxon Valdez Oil Spill Trustee Council Web Page. Retrieved online April, 2006, from http://www.evostc.state.ak.us/index.htm.
Kelly, J. 2001. Prince William Sound: Paradise Lost? Retrieved online April, 2006, from http://library.thinkquest.org/10867/home.shtml.
Contacts
Nick Perugini, CAPT, NOAA (ret.): Nperugini@aol.com