Beyond ENCs: What Todays Technology Can Do for Tomorrows Navigational Product
LCDR Rick Brennan, NOAAs National Ocean ServiceA nautical chart depicts the nature and shape of the coast, water depths, and general topography of the ocean floor; locations of navigational danger; the rise and fall of tides; and locations of human-made aids to navigation. The nautical chart is one of the most fundamental tools available to mariners. NOAA and its predecessor agencies have been producing nautical charts for 200 years and NOAA's Office of Coast Survey continually updates its collection of over 1,000 current charts.
Introduction: Captain Vance
February 2, 2027, 0300 80 nautical miles due west of Port Major, USA. Captain Vance, the master of the 366-meter container ship Kobayashi Maru, hears a familiar beep and a synthesized womans voice say, "Captain, updated Navigational Data received - PORTS Real Time data link established." She checks her heads-up-display to see a blinking message that reads:
The following NOAA data has been received and loaded for Port Major:
- Electronic Navigational Chart
- Water Levels Forecast
- Currents Forecast
- Meteorological Forecast
- PORTS Real Time
Captain Vance has been monitoring the forecasts for her entire route across the Pacific. Before leaving Taiwan, the ship was loaded with extra cargo that lowered the ship in the water an additional 30 centimeters. This added draft means millions of dollars of extra goods the ship can carry to the United States and a potential bonus for the Captain at the end of the year.
The Captain and the ships agent had debated the virtues of loading this extra cargo. Weather forecasts had shown a high-pressure system moving over the area. Captain Vance had seen these systems move through Port Major before, pushing more than 40 centimeters of water out of the port. With the ship lower in the water because of its increased cargo, these 40 centimeters could make the difference between the ship arriving safely into port or running aground. Captain Vance would need to rely on NOAA data to navigate safely to shore.
The Captain started the transit simulator using the latest NOAA forecast data. Her display showed a detailed route for the Kobayashi Maru from the sea buoy to its berth in Port Major. Instantly, the entire channel was highlighted in green and a message on the dynamic navigational display, or "DND," read:
Kobayashi Marus draft = 17.68m
Minimum Water Depth (Port Major channel) = 17.79 m
Difference between forecast and observed water levels = +/- 2 cm
Clear for transit!
Captain Vance felt a wave of relief roll over her. The difference between the ship draft and the shallowest (minimum) water depth in the channel was sufficient for her to make it to port without the ship scraping the ocean floor. Had the difference been less than five centimeters, she would have had to wait for the higher-high tide to bring the ship into port and lose over 12 hours of time at anchor off shore. The forecast models had once again proven her wrong.
This article looks at navigational technology provided by NOAA today and how these products might evolve into the future navigational products used by Captain Vance in 20 years.
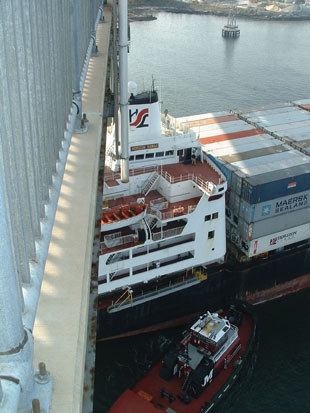
Figure 1. Mariners rely on a range of tools, including navigational charts, to bring cargoes safely to port.
Bringing in the New
Captain Vance was the last of the old school mariners in her shipping line. She still tells stories of static, paper nautical charts, listening to weather radio, calculating tides and currents from printed tables, and late nights reviewing the Coast Pilot. Things are different now.
All the NOAA information she used to obtain from multiple sources and methods are now downloaded right to the ships DND. The information is displayed in context, right on the display in front of the Captain. Winds and currents can be visually overlaid on the navigational data to highlight areas where sheering between the wind and current might be a problem.
Both forecast and real-time water levels can be coupled with the high-resolution bathymetry (i.e., maps of the sea floor) contained in the Electronic Navigational Chart (ENC). This optimizes the ships load based on the available water forecasted in the destination port at the scheduled time of arrival and shows, in real-time, where water is of sufficient depth for the ship to safely transit.
While this story of Captain Vance is purely fictional, the technology described on the Kobayashi Maru could be implemented with technology we possess today. For example, NOAA is working with its partners to develop heads-up display systems for marine navigation, which could be developed into the fictitious "DND" used by Captain Vance. Also, hydrodynamic models are being used to forecast water levels in nine ports and estuaries in the United States with 13 Physical Oceanographic Real Time Systems (PORTS®) deployed in major ports around the nation.
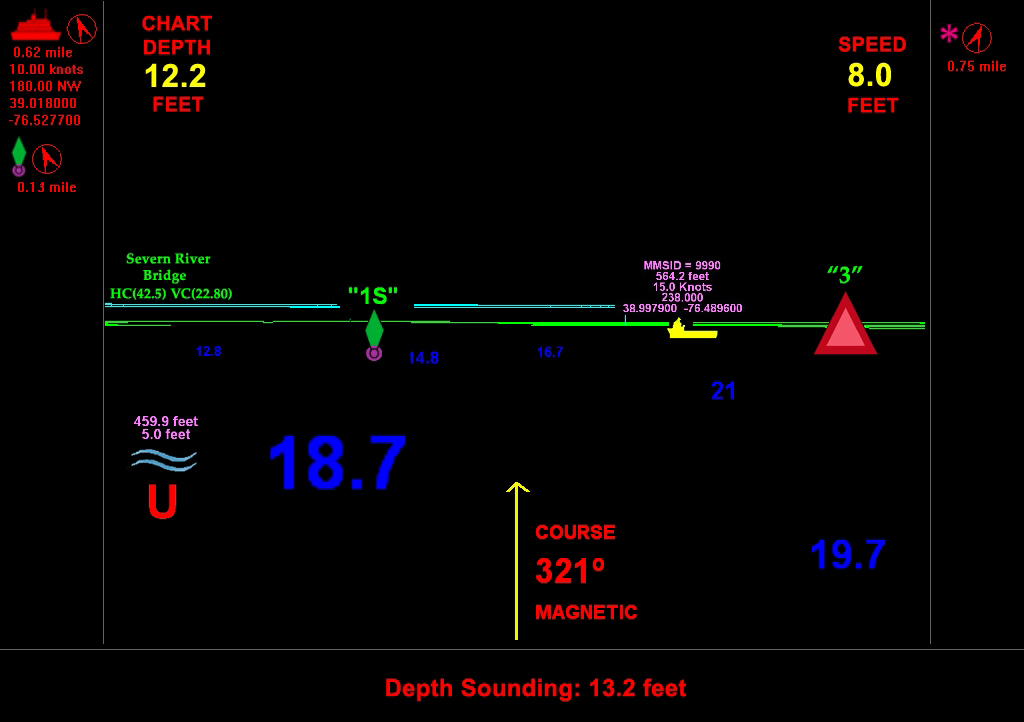
Figure 2. An image of the "head's up" display on board a ship, alerting the mariner as to the direction and speed of movement and water depth. Image courtesy of Mr. R. Glenn Wright of GMA Industries.
(Click the image to enlarge.)
The Automated Identification System (AIS)
The Automated Identification System (AIS) is a transponder carried onboard all commercial ships which is capable of transmitting information about its ships name and position, as well as receive the same information from other vessels in the area. All this information is transmitted via VHF radio and has been required on all vessels since 2004.
The AIS message format can also accommodate data on water level, water current, air-gap (i.e., the space between the top of a ship and the underside of a bridge), and weather conditions.
Once this information is transmitted to the ship, it is used by the shipboard navigation system to provide pertinent operational information, such as the information discussed below, in a navigation context, directly on a navigational chart.
Figure 3. AIS transponders automatically transmit/broadcast the position and velocity of the ship at regular intervals via a VHF radio built into the AIS. The position and velocity originate from the ship's global positioning system. The AIS also receives heading information from the ship's compass and transmits this at the same time. The signals are received by AIS transponders fitted on other ships or on land based systems. Image courtesy of the U.S. Coast Guard.
(Click the image to enlarge.)
Wind and Current Measurements
Wind and current measurements for points along a vessels route can be transmitted over AIS and displayed in the chart system to augment the mariners understanding of the environmental conditions beyond what is currently provided by NOAA weather radio. Real-time measurements of wind and current, provided within the navigational context of the chart, can aid the mariner in planning vessel maneuvers, such as various tug-assisted operations or docking, as well as improve the safety of the vessels as they pass within close proximity of each other or move through confined waterways.
Water Levels
Water level measurements transmitted over AIS are used to determine the elevation of the waters surface across a particular geographic region. Also, information on the waters surface can be combined with high-resolution bathymetry to produce a "tide aware" navigational chart that displays the actual water depth at any given instance.
Understanding how much water is available, or will be available, is part of the mariners decision-making equation. Another part of the equation is knowing where the vessel is in relation to the seafloor. Todays mariners determine their vessels position relative to the seafloor by using the waters surface as the reference. However, a vessels position in the water column is not static and changes with speed and the density of the water (i.e., the saltiness of the water).
Advances in global positioning system (GPS) technology, including new constellations of satellites equipped with additional broadcast frequencies, offer a solution to the dilemma associated with a vessels changing position. This next generation of GPS technology promises the possibility to obtain reliable vertical measurements relative to an ellipsoid model, which is a mathematical model which approximates the shape of the Earth and is the surface which all GPS measurements are referenced to, with accuracies better than 10 centimeters. Coupling this technology with high-accuracy surveys of the ships GPS antennas with respect to the keel, and nautical charts with the capability to display their depths (relative to the ellipsoid), will allow vessels to accurately determine where they are in relation to the seafloor.
Figure 4. The animation shown here demonstrates the added benefit provided to the mariner when high-resolution ocean depths (bathymetry) are combined with real-time water level measurements. The bathymetry is color coded to show those areas that are safe for the navigation of a vessel with a draft (or depth in the water) of 10 meters and a two-meter safety factor. The green areas shown in this animation are those areas that are deeper than 12 meters (the draft plus the safety factor). The yellow areas (which fringe the green areas) are areas where the depth is within the safety factor. Areas in red have water depths equal to, or less than, the draft of the ship and thus are areas where grounding is likely. One can see that as the tide goes in and out, the area available for a vessel to navigate expands and contracts. Being able to see what water is actually available to navigate (versus a static view of the bathymetry) based on the observed or predicted tides will provide more information to the mariner, so she can schedule and execute her transit.
AIS Capabilities of the Future
The scenarios described above are currently possible using the telemetry capabilities of existing AIS technology. As wireless technology continues to mature, it should be possible to transmit larger files to an underway vessel, thus opening the door to the use of a number of meteorological and oceanographic models to plan a ships voyage that are currently too large to be transmitted by AIS.
In addition, it should also be possible to transmit navigational chart data wirelessly to an underway vessel, providing the opportunity for near real-time chart updates upon completion of a new hydrographic survey.
Conclusion
In order to leverage these advances in navigational technology, NOAA needs to lay the foundations for future capabilities today. These advances include:
- Building seamless, integrated source and product databases for NOAA navigational chart data. Currently NOAAs chart data holdings are mostly graphical in nature, and are not suitable for use in more complex navigational solutions. Moving this data to a spatial database will allow it to be utilized in a more intelligent fashion.
- Adopting four-dimensional data formats that will support XYZ and time information, enabling dynamic data displays. Current data formats do not account for the time varying nature of the marine environment (for instance the tides are constantly changing the depth of the water). New formats under development will help enable the data NOAA acquires to more effectively utilized.
- Increasing the density of our real-time meteorological and oceanographic observations to support more accurate and higher resolution models. Most of our oceanographic and meteorological models rely on very sparse measurements to make their predictions. A greater density of actual observations (water level, current, wind, barometric pressure, etc..) will facilitate the computation of higher accuracy models.
- Acquiring shore-to-shore, high-accuracy, high-resolution, ellipsoidally-referenced bathymetry to match the increased vertical accuracy of GPS technology, which will be found on vessels in the next 20 years. High resolution bathymetric data is critical for making the chart information come to life with real time water levels, and to produce ship safe contours at any time and for any depth of water.
In addition, NOAA needs to continue forging new and innovative ways to deliver and display data to all segments of the world population. The rising popularity of Google Earth has provided geographic information system data to the masses and sparked a new appreciation for geo-referenced data of all types. The Google Earth concept presents a paradigm in which it is easy to imagine all navigational data and displays provided over the Internet and available to all people.
Providing data in this fashion will make NOAA products and services invaluable to mariners navigating U.S. waters and to all Americans.
Contributed by LCDR Rick Brennan, NOAAs National Ocean Service
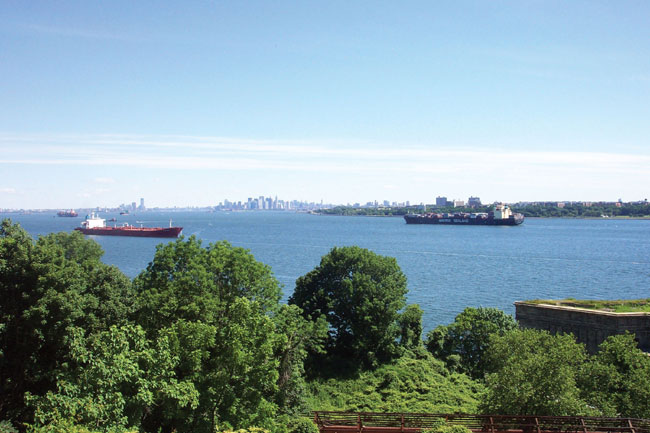
Figure 5. Ports handle over $700 billion in merchandise annually, making the safe passage of ships critical to our nations economy.
Works Consulted
U.S. Department of Transportation. May 9, 2002. St. Lawrence Seaway AIS Data Messaging
Formats and Specifications. Retrieved December 1, 2006, from: http://www.greatlakes-seaway.com/en/pdf/aisdata.pdf.
Hess, K., Schmalz, R., Zervas, C., Collier, W. (2004). Tidal Constituent and Residual Interpolation (TCARI): A New Method for the Tidal Correction of Bathymetric Data. Technical Report, NOS CS 4, National Oceanic and Atmospheric Administration.
Related Web Sites
NOAAs Office of Coast Survey: http://www.nauticalcharts.noaa.gov/
NOAA Electronic Navigational Charts: http://chartmaker.ncd.noaa.gov/mcd/enc/download.htm
Office of Coast Surveys Historical Map & Chart Collection: http://chartmaker.ncd.noaa.gov/csdl/ctp/abstract.htm