Eastern North Pacific Hurricane Season of 2005
John L. Beven II, National Hurricane Center/Tropical Prediction Center, NOAA/NWS Miami, FL
Introduction
Individual Storms
Acknowledgments
Fifteen named tropical storms occurred in the eastern North Pacific basin during 2005. Seven of the tropical storms became hurricanes, but only one (Kenneth) became a major hurricane (category three or stronger on the Saffir-Simpson hurricane scale) in the eastern North Pacific basin. One of the hurricanes (Jova) also reached major hurricane status after crossing into the central Pacific basin. As in 2004, the activity was below average in terms of the numbers of hurricanes and major hurricanes. The long-term seasonal averages are 15 tropical storms, nine hurricanes, and four major hurricanes. There was one additional tropical depression in 2005 that did not reach tropical storm intensity. Six of the named storms formed between 12-28 September. No system made landfall as a tropical storm or hurricane. However, Adrian made landfall in Honduras as a tropical depression.
Back to topThe vital statistics of the named storms of 2005 are given in Table 1, while the tracks are shown in Figure 1. The track of the one non-developing depression is shown in Figure 2. In the cyclone summaries given below, all dates are based on Universal Coordinated Time, although local time is implied with expressions such as "afternoon," "mid-day," etc.
| Storm Name | Class* | Dates** | Maximum Winds (kt) | Minimum Central Pressure (mb) | Deaths |
|---|---|---|---|---|---|
| Adrian | H | 17-21 May | 70 | 982 | 1 |
| Beatriz | TS | 21-24 June | 45 | 1000 | 0 |
| Calvin | TS | 26-29 June | 45 | 1000 | 0 |
| Dora | TS | 4-6 July | 40 | 1003 | 0 |
| Eugene | TS | 18-20 July | 60 | 989 | 0 |
| Fernanda | H | 9-16 August | 75 | 978 | 0 |
| Greg | TS | 11-15 August | 45 | 1000 | 0 |
| Hilary | H | 19-25 August | 90 | 970 | 0 |
| Irwin | TS | 25-28 August | 45 | 1000 | 0 |
| Jova | H | 13-24 September | 85*** | 973*** | 0 |
| Kenneth | H | 14-30 September | 115 | 948 | 0 |
| Lidia | TS | 17-19 September | 35 | 1005 | 0 |
| Max | H | 18-22 September | 75 | 981 | 0 |
| Norma | TS | 23-27 September | 50 | 997 | 0 |
| Otis | H | 28 September-3 October | 90 | 970 | 0 |
* TS - tropical storm, maximum sustained winds 34-63 kt; STS - subtropical storm, maximum sustained winds 34-63 kt; H - hurricane, maximum sustained winds 64 kt or higher.
** Dates based on UTC time and include tropical depression stage.
*** Jova later had maximum winds of 110 kt and a minimum pressure of 951 mb in the central Pacific basin.
Table 1. 2005 Eastern North Pacific Tropical Storms and Hurricanes.

Figure 1. Tracks of eastern North Pacific tropical storms and hurricanes of 2005.
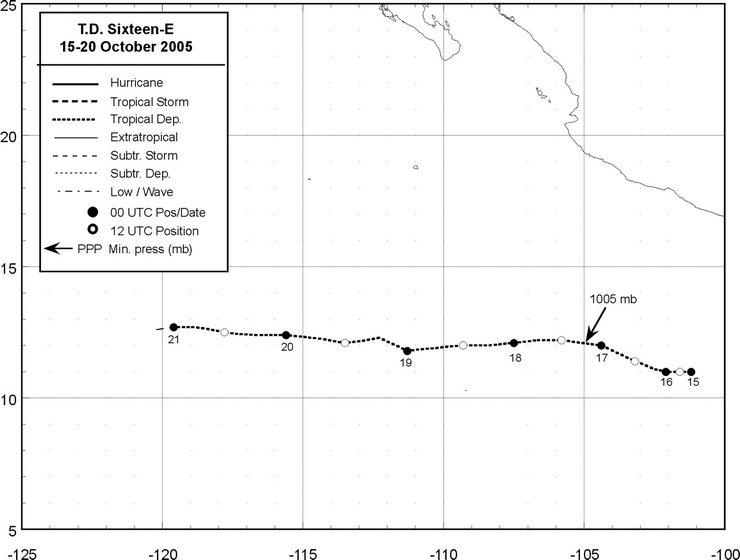
Figure 2. Best track positions for Tropical Depression Sixteen-E, 15-20 October 2005.
Adrian originated from the combination of a broad area of low pressure south of Acapulco, Mexico and a tropical wave that crossed Central America and entered the eastern North Pacific on 15 May. A tropical depression formed from these systems on 17 May while centered about 400 nmi west-southwest of El Salvador (Figure 1), and it strengthened into a tropical storm early the next day. The storm moved generally toward the east-northeast. Data from a U. S. Air Force Reserve reconnaissance aircraft indicate that Adrian reached hurricane strength with a peak intensity of 70 kts on 19 May about 75 nmi southwest of El Salvador. A post-storm analysis indicates that Adrian did not make landfall as a hurricane in El Salvador early on 20 May, as assessed operationally. Instead, southwesterly wind shear caused Adrian to weaken just offshore (Figure 3). Adrian was a weakening tropical storm early on 20 May as it moved eastward just off the coast of El Salvador, and later that day it entered the Gulf of Fonseca, east of El Salvador, as a tropical depression. The depression then made landfall on the Pacific coast of Honduras during the evening of 20 May, and by the end of that day the circulation had dissipated inland.
Two ships reported tropical storm-force winds from Adrian. The yacht SV-Carina reported 43 kts winds near 0400 UTC 20 May, while the Iver Expert (PCEX) reported 35 kts winds at 1200 UTC 20 May.
Even though the center did not make landfall in El Salvador, media reports indicate that heavy rainfall caused floods and mud slides there. Flooding from Adrian in Nicaragua caused one fatality, the only known death of the eastern Pacific season. Adrian was only the third eastern Pacific tropical cyclone since 1949 to make landfall in Central America (all were depressions), and no eastern Pacific hurricane has come closer to El Salvador that Adrian in at least 57 years.
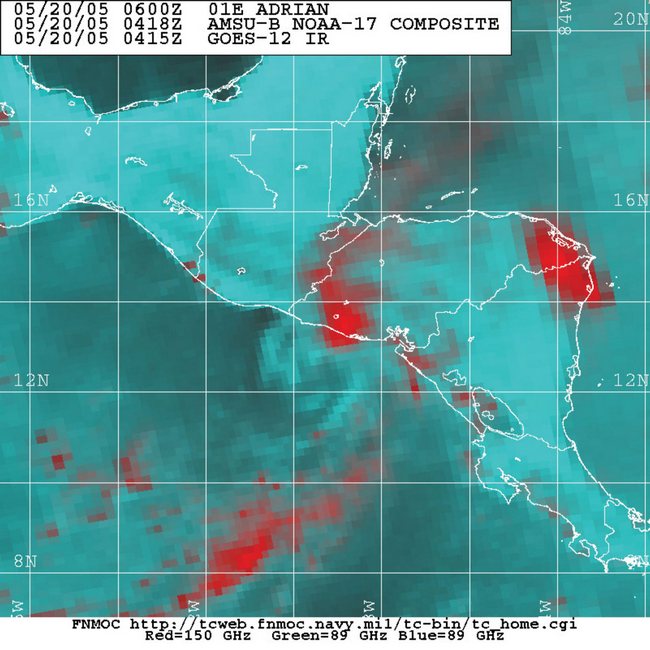
Figure 3. NOAA-17 89 GHz microwave image of Hurricane Adrian at 0418 UTC 20 May. The low-level circulation center is exposed to the southwest of the convection occurring over El Salvador. Image courtesy of the Fleet Numerical meteorology and Oceanography Center, Monterey, CA.
Beatriz developed from a tropical wave that crossed the west coast of Africa on 8 June and entered the eastern North Pacific basin on 17 June. The system became a depression on 21 June about 240 nmi south of Zihuatanejo, Mexico (Figure 1). The cyclone strengthened slowly as it moved west-northwestward, well offshore the Mexican coast, becoming a tropical storm on 22 June and reaching its estimated peak intensity of 45 kts early on 23 June. Easterly wind shear halted development, and Beatriz weakened to a depression over cooler waters early on 24 June. The cyclone degenerated into a non-convective remnant low later that day about 250 nmi south-southwest of Cabo San Lucas, Mexico on the southern tip of Baja California. The low dissipated two days later.
Back to topCalvin developed from a tropical wave that emerged from the west coast of Africa on 11 June and crossed Central America around 21 June. The area of disturbed weather associated with the wave moved slowly westward to the south of eastern Mexico for a few days, with unsteady development. A tropical depression formed on 26 June about 285 nmi south-southeast of Acapulco (Figure 1). The cyclone became a tropical storm later that day and reached its estimated peak intensity of 45 kts on 27 June. As with Beatriz, the cyclone’s development trend was reversed by easterly wind shear. Calvin weakened to a depression on 28 June and degenerated into a remnant low the next day. The remnant circulation continued toward the west-northwest while producing intermittent but disorganized deep convection through 2 July. The low then turned westward and dissipated on 3 July about 680 nmi west-southwest of Cabo San Lucas.
There were two ship reports of tropical storm-force winds from Calvin. The Saga Wind (VRUR7) reported 34 kts winds at 1800 UTC 26 June, while the ITB New York (WDVG) reported 34 kts winds at 0900 UTC 27 June.
Back to topDora originated from a tropical wave that moved off the west coast of Africa on 18 June and crossed Central America on 1 July. It became a tropical depression on 4 July about 145 miles south of Acapulco, and it became a tropical storm later that day about 90 nmi southeast of Zihuatanejo (Figure 1). Dora moved northwestward and its center came within 35 nmi of the Mexican coast near Zihuatanejo before turning west-northwestward and moving parallel to the coastline on 5 July. It weakened to a tropical depression later that day over cooler waters. Dora turned westward away from Mexico on 6 July and degenerated to a remnant low. The low dissipated late that day about 220 nmi west of Manzanillo, Mexico.
The Nikkei Phoenix (H9UY) reported 40 kts winds at 1500 UTC 4 July. This was the basis for the assessed peak intensity of Dora.
Back to topEugene formed from a tropical wave that reached the eastern Caribbean Sea on 10 July and entered the eastern North Pacific by 14 July. The system developed into a tropical depression early on 18 July about 265 nmi south of Manzanillo, and it became a tropical storm later that day (Figure 1). The storm moved generally northwestward and parallel to the coast of Mexico for about a day, and it reached its estimated peak intensity of 60 kts late on 19 July while located about 205 miles west-southwest of Cabo Corrientes. Eugene soon weakened to a tropical depression over cooler waters and was reduced to a remnant low early on 21 July. The remnant low continued northwestward and dissipated about 24 hours later.
While there were no ship reports of tropical storm-force winds from Eugene, a report of 30 kts from the Providence Bay (MSTM6) at 1200 UTC 18 July was instrumental in designating the cyclone as a tropical storm.
Back to topFernanda developed from a tropical wave that crossed the west coast of Africa on 25 July. It became a depression about 575 nmi south-southwest of Cabo San Lucas on 9 August and became a tropical storm on 10 August as it moved toward the west-northwest (Figure 1). Fernanda reached hurricane status on 11 August and attained its estimated peak intensity of 75 kts on 12 August before moving toward cooler waters and a hostile atmospheric environment. Thereafter, Fernanda moved toward the west-southwest and gradually weakened, dissipating on 17 August.
Back to topGreg originated from a tropical wave that emerged from the west coast of Africa on 27 July and crossed Central America on 6 August. The system developed into a tropical depression about 600 nmi south of Cabo San Lucas on 11 August, and it became a tropical storm later that day (Figure 1). Greg moved slowly to the west-northwest and reached its estimated peak intensity of 45 kts on 12 August. Ridging between Greg and Fernanda forced Greg to drift to the south and southwest while northerly shear weakened the cyclone. Greg weakened to a depression late on 14 August and then degenerated into a remnant low on 16 August about 650 nmi south-southwest of Cabo San Lucas.
Back to topThe genesis of Hilary was associated with a tropical wave that moved off the west coast of Africa on 4 August and entered the eastern North Pacific on 17 August. The system developed into a tropical depression about 140 nmi south of Puerto Angel, Mexico on 19 August (Figure 1). It moved westward and became a tropical storm the next day. For the next couple of days it took a path roughly parallel to the Mexican coast about 225 nmi offshore. It became a hurricane early on 21 August with a large area of tropical-storm force winds northeast of the center. Hilary edged away from the mainland and strengthened, reaching an estimated peak intensity of 90 kts on 22 August. A slow weakening trend ensued as Hilary moved generally northwestward over cooler waters. The cyclone weakened to a tropical storm on 24 August about 435 nmi west of Cabo San Lucas, and it weakened to a depression and then a non-convective remnant low the following day. The low continued westward for the next few days and dissipated early on 28 August.
Several ships reported tropical storm-force winds from Hilary (Table 2). The most notable observation was from the Chembulk Vancouver (DGVC), which reported 45 kts winds at 2100 UTC 21 August. Hilary brought tropical storm conditions to the coast of Mexico near Manzanillo, which reported sustained winds of 35 kts with a gust to 40 kts at 2145 UTC 21 August. There were no reports of damages or casualties.
| Date/Time (UTC) | Ship name/call sign | Latitude (°N) | Longitude (°W) | Wind dir/speed (kts) | Pressure (hPa) |
|---|---|---|---|---|---|
| 20 / 0000 | Mighty Servant I | 10.3 | 104.7 | 290 / 35 | 1008.2 |
| 21 / 2100 | Chembulk Vancouver | 18.6 | 103.9 | 130 / 45 | 1008.0 |
| 21 / 2100 | Green Dale WCZ523 | 19.3 | 105.6 | 120 / 37 | 1006.1 |
| 22 / 0000 | Green Dale (WCZ523) | 19.2 | 105.2 | 160 / 40 | 1008.0 |
| 22 / 0000 | MSC Diego (3FZP8) | 20.0 | 106.5 | 140 / 37 | 1005.0 |
| 22 / 0600 | Washington Highway | 20.3 | 107.9 | 110 / 36 | 1009.2 |
Table 2. Selected ship reports with winds of at least 34 kts for Hurricane Hilary, 19-25 August 2005.
Irwin likely originated from the southern portion of the tropical wave that emerged from the west coast of Africa on 10 August and then spawned powerful Atlantic Hurricane Katrina. The wave entered the eastern North Pacific on 22 August and led to the development of a tropical depression on 25 August about 135 nmi south of Manzanillo (Figure 1). The depression moved westward and became a tropical storm early on 26 August. Irwin reached its estimated peak intensity of 45 kts later that day, but then it slowly weakened on 27 August. The cyclone weakened to a depression early on 28 August and to a remnant low later that day while centered about 490 nmi southwest of Cabo San Lucas, and the remnant low persisted through 2 September.
The only report of tropical storm-force winds in Irwin was from a ship with the call sign WCY845, which reported 37 kts winds at 0300 UTC 26 August. However, the ship was far from the center at the time and the reliability of the report is uncertain.
Back to topJova was a long-track hurricane that crossed into the central Pacific basin and briefly threatened the Hawaiian Islands. Jova originated from a tropical wave that crossed the west coast of Africa on 28 August and entered the eastern North Pacific on 4 September. A tropical depression formed from this system nearly a week later, on 12 September, about 550 nmi south-southwest of Cabo San Lucas (Figure 1). However, upper-level winds hindered development and Jova did not reach tropical storm status until early on 15 September about 1150 nmi west-southwest of Cabo San Lucas. Jova continued on a track slightly south of due west for the next two days and gradually strengthened. It became a hurricane early on 16 September. Late on 17 September, Jova turned toward the northwest near 140°W longitude and slowly intensified, and it became a major hurricane in the central Pacific hurricane basin on 19 September (Figure 4). Jova maintained Category 3 status during the next two days. However, the northwestward motion took the hurricane over cooler waters, and steady weakening began early on 22 September when Jova was located about 410 nmi east of the Hawaiian Islands. Jova weakened to a tropical storm early on 23 September as increasing southwesterly vertical shear accelerated the weakening process, and it became a tropical depression early on 24 September. Jova dissipated on 25 August about 260 nmi north of Hilo, Hawaii.
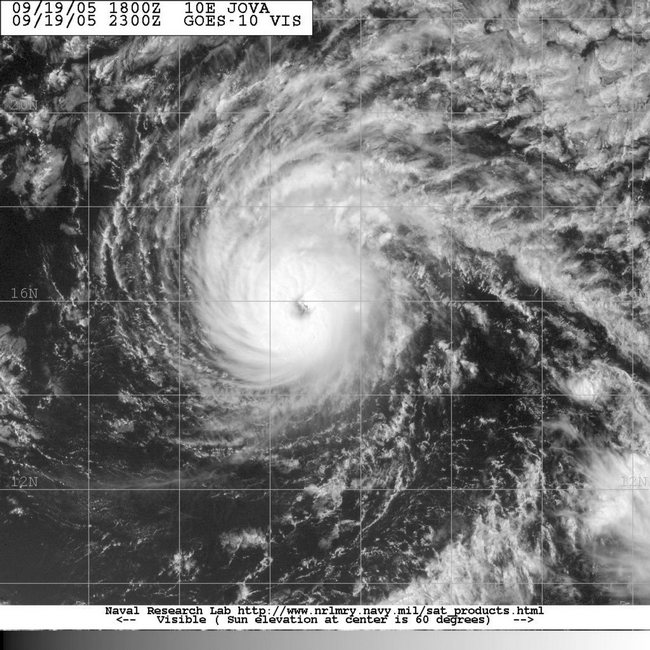
Figure 4. GOES-10 visible image of Hurricane Jova near peak intensity at 2300 UTC 29 September Image courtesy of the Naval Research Laboratory, Monterey, CA.
The long-lived Kenneth can possibly be traced back to a tropical wave that crossed into the eastern North Pacific by 9 September. This system moved westward within the Intertropical Convergence Zone (ITCZ) for several days. By 13 September, the disturbed weather associated with this system started showing signs of organization. On 14 September, the cloud pattern became sufficiently well organized to indicate the formation of a tropical depression about 780 nmi southwest of Cabo San Lucas, and the depression became a tropical storm the following day (Figure 1). Kenneth moved mainly westward and intensified into a hurricane on 16 September. The hurricane continued to strengthen and developed a well-defined eye, and it reached its estimated peak intensity of 115 kts on 18 September (Figure 5). Moving slowly, Kenneth gradually weakened to below hurricane strength on 20 September and to an estimated 45 kts on 21 September. The cyclone fluctuated in intensity over the next several days, but it eventually regained hurricane status on 25 September. Kenneth drifted southwestward across 140°W longitude and into the central Pacific basin on 26 September. Shortly thereafter, the cyclone weakened again to below hurricane strength. Kenneth turned northwestward and continued to weaken, and it became a tropical depression on 29 September about 350 nmi east of the island of Hawaii. It dissipated just east of the Big Island on 30 September. The remnants of Kenneth passed south of the Hawaiian Islands and produced some locally heavy rains there.
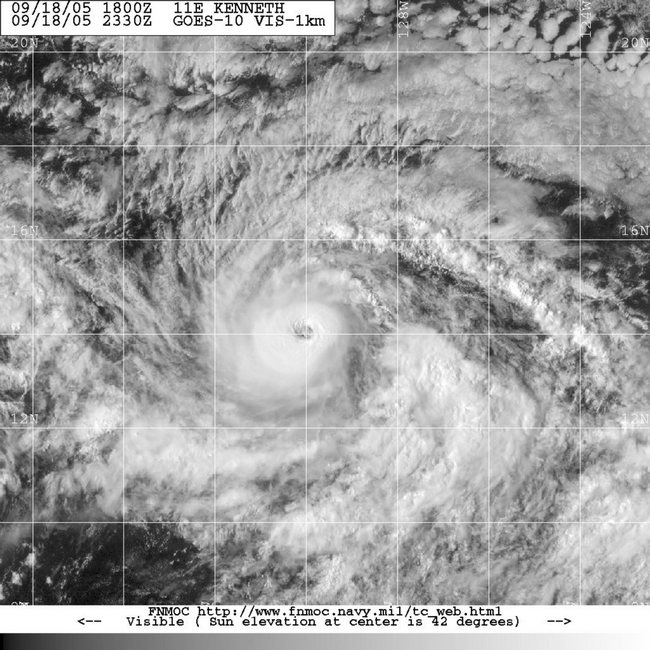
Figure 5. GOES-10 visible image of Hurricane Kenneth near peak intensity at 2330 UTC 18 September. Image courtesy of the Fleet Numerical Meteorology and Oceanography Center, Monterey, CA.
The short-lived Lidia developed from a tropical wave, although it is not certain which of the waves that entered the eastern North Pacific during 10-15 September was directly involved in the genesis of the cyclone. The system became a depression on 17 September about 725 nmi southwest of Cabo San Lucas and became a tropical storm later that day (Figure 1). Lidia moved very little and on 18 September it weakened back to a depression. It was absorbed by the much larger circulation of Tropical Storm (and later Hurricane) Max early on 19 September.
Back to topMax originated from a tropical wave that emerged from the west coast of Africa on 4 September and crossed Central America on 13 September. It became a tropical depression on 18 September about 500 nmi south-southwest of Cabo San Lucas (Figure 1). It reached tropical storm status later that day as it moved west-northwestward while absorbing the smaller circulation of Lidia. Max turned toward the northwest and strengthened on 19 September, and it reached hurricane intensity early on 20 September. Continuing northwestward, Max reached its estimated peak intensity of 75 kts later that day, but it soon began to weaken as it reached cooler waters. Max became a tropical storm and turned westward on 21 September, and it weakened to a tropical depression the next day. It degenerated to a remnant low later on 22 September about 700 nmi west of Cabo San Lucas. The low drifted southward for a few days and dissipated early on 26 September.
Back to topNorma developed from a large tropical disturbance that lingered a few hundred nmi south of Manzanillo for several days. A tropical depression formed there early on 23 September and strengthened into a tropical storm later that day (Figure 1). Moving slowly to the west-northwest, Norma gradually developed despite modest northeasterly shear, and it reached its estimated peak intensity of 50 kts on 24 September. The vertical shear increased and gradually caused Norma to weaken, and it became a tropical depression late on 26 September. Deep convection faded as Norma moved over cooler waters, and the cyclone degenerated to a remnant low later the next day about 410 nmi west of Cabo San Lucas. The low moved slowly southwestward and finally dissipated about four days later.
Back to topOtis originated from a tropical wave that moved westward from the coast of Africa on 9 September and that may have spawned Atlantic Hurricane Philippe. The wave reached the eastern North Pacific on 22 September and began to show signs of organization on 27 September. A tropical depression formed early the next day about 120 nmi south of Manzanillo (Figure 1). This depression was the sixth tropical cyclone to develop in the eastern North Pacific basin during the 17-day period starting on 12 September. The cyclone moved westward and became a tropical storm on 29 September. Otis turned northwestward and achieved hurricane status on 30 September, and it reached an estimated peak intensity of 90 kts on 1 October. It then weakened to a tropical storm the next day. A combination of low sea-surface temperatures and dry air caused continued weakening, and Otis became a depression on 3 October. It degenerated into a non-convective remnant low pressure area early on 4 October about 80 nmi northwest of Cabo San Lazaro, Mexico, and the low dissipated the next day.
Two ships reported tropical storm-force winds during Otis. The Volendam (PCHM) reported winds of 44 kts and a pressure of 1002.0 hPa at 0000 UTC 3 October, while the Star Harmonia (LAGB5) reported winds of 37 kts and a pressure of 1004.3 hPa at 0600 UTC 1 October.
While the core of Otis remained offshore, tropical storm-force winds occurred at higher elevations over portions of southern Baja California. An automated station at Cabo San Lucas (elevation 224 m) reported a 10-min average wind of 43 kts with a gust to 55 kts on 30 September. Locally heavy rains also occurred over portions of the Baja California Peninsula. There were no reports of casualties or damages.
Back to topThe only cyclone of the 2005 eastern North Pacific season that did not become a tropical storm formed from a tropical wave that reached the basin on 13 October. Gradual organization occurred as the wave moved westward, and a tropical depression formed on 15 October about 360 nmi south of Acapulco (Figure 2). The cyclone moved west-northwestward for a couple of days, then turned westward on 17 October. The system weakened to a non-convective low early on 18 October, then it re-developed into a depression on 19 October about 675 nmi south-southwest of Cabo San Lucas. This second life was short-lived, with the depression again becoming a non-convective low on 20 October. The low was absorbed into the Intertropical Convergence Zone on 21 October about 800 nmi southwest of Cabo San Lucas.
Back to topThe cyclone summaries are based on reports prepared by the authors and the other Hurricane Specialists at the National Hurricane Center (NHC): James Franklin, Richard Pasch, and Stacy Stewart. Additional material was contributed by Tropical Prediction Center/NHC colleagues Eric Blake and David Roberts. Ethan Gibney prepared the season track map.