Mean Circulation Highlights and Climate Anomalies
January through April 2006
A. James Wagner, Senior Forecaster, Climate Operations Branch, Climate Prediction Center /NCEP/NWS/NOAA.
January - February 2006
The circulation pattern over the Northern Hemisphere during January and February was characterized by strongly contrasting anomalies over the east Asian-Pacific sector and the Atlantic-Eurasian sector. From India eastward to the central Pacific, 500 hPa heights were above normal at middle and lower latitudes, while at high latitudes, especially from eastern Siberia across the Bering Sea to Alaska, heights were noticeably below normal. This resulted in strong westerlies at middle latitudes, with storms generally moving rapidly across the Pacific and most of the activity at higher middle latitudes. By contrast, from eastern North America to eastern Europe, 500 hPa heights were generally above normal at high latitudes and below normal at low latitudes. Storms were active over the western Atlantic, but tended to be displaced northeastward as they approached Europe, which was under the influence of abnormally cold anticyclones much of the time.
Thus, there was quite a contrast between the prevailing winter weather over North America and Eurasia. During January especially, record mild temperatures prevailed across much of the conterminous United States in the absence of any significant Arctic air in a pattern that did not favor the generation of high pressure over Canada. Mild air of Pacific origin swept across the U.S. and southern Canada most of the time. Even though air approaching the West Coast did not originate over the tropical Pacific, strongly enhanced onshore flow and a slightly deeper than normal trough near the coast provided copious moisture that had the beneficial effect of eliminating the remaining long-term drought over the northwestern U.S. while building a deep mountain snow pack, but had the harmful result of producing repeated flooding from western Washington south as far as northern California.
Changes in the pattern from January to February allowed seasonably cold air to cover much of the lower 48 States during February. The high latitude blocking, which had been concentrated mainly over Eurasia during January, retrograded to the Greenland and Davis Strait area, allowing the buildup of Arctic highs over northern Canada, some of which made their way south to the U.S. by mid-February. One major snow storm affected the Northeast, with a record storm total of almost 27 in of snow measured at New York City’s Central Park. Lake effect snow was also prevalent as Arctic air moved south and southeast across the still open waters of the Great Lakes, which normally have their maximum ice cover by the end of February.
Alaska experienced a marked climate reversal between January and February. In January, low 500 hPa heights to the east and south and flow from northeastern Siberia and the Arctic Ocean kept moisture and milder Pacific air out of most of the state, resulting in colder and drier than normal weather. During February, the westerlies shifted abnormally far to the north, flooding even the interior of Alaska with relatively mild and moist air from the north Pacific and Bering Sea. This resulted in well above normal temperatures and heavier than normal precipitation over much of the state, most notably in the normally rather dry and cold Interior Basin area.
Extreme cold prevailed over western Russia and eastern Europe, especially in January, with subzero readings as far west as Germany. This caused most of the precipitation to fall as snow, which resulted in persistent snow cover, even though fair weather prevailed much of the time due to the abnormally strong upper level ridge and surface high pressure.
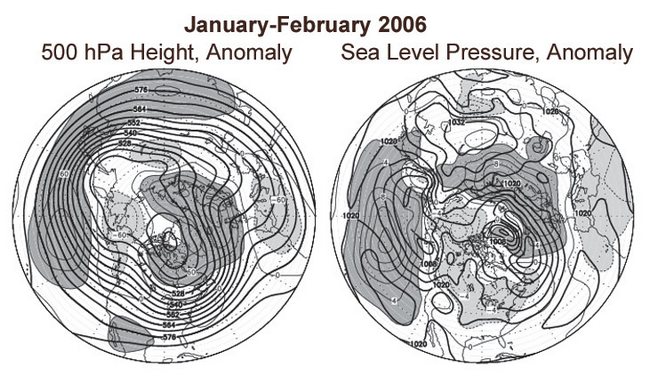
The charts on the left show the seasonal mean 500 hPa height contours at 60 m intervals in heavy solid lines, with alternate contours labeled in decameters (dm). Positive height anomalies are contoured in light solid lines at 30 m intervals, and negative height anomalies are shown by light dashed lines. Areas of mean height anomalies greater than 30 m above normal have heavy shading, and areas of mean height anomalies of more than 30 m below normal have light shading.
The charts on the right show the seasonal mean sea level pressure (SLP) at 4 hPa intervals in heavy solid lines, labeled in hPa at selected intervals. Anomalies of SLP are contoured in light lines at 2 hPa intervals, with dark shading and solid lines in areas more than 2 hPa above normal, and light shading with dashed lines in areas greater than 2 mb below normal.
March - April 2006
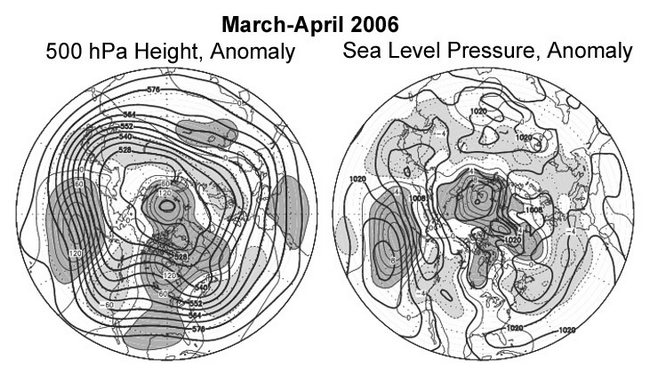
During March and April, the phases of the AO and NAO were both negative, with anomalously high 500 hPa heights and sea level pressure covering much of the Arctic Basin, northeastern Canada and Greenland. The Icelandic Low was split and there were two weak low pressure centers in the mean, one north of Scotland and the other near Newfoundland. Over the Pacific, the pattern was similar to that which prevailed during much of the preceding two-month period, with a large area of well above normal 500 hPa heights centered over the central North Pacific at middle latitudes. The trough over the eastern Pacific just off the west coast of North America became more amplified and the mean trough near Japan also strengthened. Storminess tended to be greatest over the western and eastern parts of the ocean, while cyclones crossing the central part of the Pacific did so at high latitudes and tended to move rapidly with the strong westerly flow. There is just a hint on the mean maps in the form of a weak low latitude trough at the 500 hPa level and a weak negative anomaly center on the sea level chart of the persistent Kona Lows that produced record-breaking heavy rains and floods in parts of Hawaii during March and early April.
A wide variety of spring weather was observed over the lower 48 States. Strong blocking over northern Canada kept seasonably cool but very dry air over much of the middle Atlantic and New England areas, where many locations had their driest March on record. During April, the high latitude blocking moved to the Eurasian side of the Arctic, cold Arctic highs were few and weak over North America, and temperatures averaged well above normal over most of the lower 48 States east of the Rockies due to the virtual absence of Canadian air. With the stronger than normal trough near the West Coast persisting through most of both months, above normal precipitation fell over much of California and extended into the Great Basin, with flooding at times in northern and central California and heavy snows falling at higher elevations. The mean sea level pressure map shows an extension of lower than normal pressure southeastward across the Rockies and Great Plains from the trough near the coast. This feature reflected the occurrence of several major storm systems that brought heavy snow to parts of the central and northern Great Plains and severe thunderstorms with tornadoes, heavy rains and large hail to the southern Plains and parts of the Mississippi, Ohio and Tennessee Valleys. The precipitation had at least one beneficial effect in bringing welcome drought relief to some areas of the parched southern Plains, much of which had experienced record dryness from Fall 2005 into early Spring 2006.
The Tropics
The first four months of 2006 featured a gradual transition from weak La Nina conditions back to a neutral state. The east-west contrast of above normal temperatures over the western equatorial Pacific and below normal SSTs over the eastern and central Pacific weakened throughout the period. Most weather and climate impacts during this period were typical of La Nina, with heavy rains producing mudslides in parts of Indonesia, and several tropical storms, one of which reached Category 5 intensity, affecting Australia. The heavy rains over Hawaii and the northern and central Pacific coast of the lower 48 States with a sharp transition to dry weather in the interior Southwest were also typical of La Nina. However, the climate over the eastern U.S. was influenced more by variations in the location and strength of blocking over high latitudes, which affected both the amount of available cold air and the paths and intensity of winter storms over the eastern U.S.