Marine Weather Review-North Pacific Area
January through April 2005
By George P. Bancroft, NOAA National Center for Environmental Prediction
Introduction
This period includes the stormy winter and early spring months in which hurricane-force storms were common. Due to the sheer number of storms, the focus in this article is mainly on hurricane-force storms, labeled as such by OPC surface analysts on the basis of QuikSCAT and other satellite imagery, surface observations, model guidance and trends. February in particular was quite active. The activity decreased in April, which had one hurricane-force storm and another coming close.
The storm track was mainly from near Japan northeastward toward the Bering Sea and, depending on varying amounts of blocking high pressure over the northeast Pacific and Alaska, sometimes caused the lows to slow down, turn west or even take a track more northward to the Kamchatka Peninsula.
Tropical cyclones are normally least active during this period. Two western Pacific tropical cyclones only briefly affected OPC's oceanic analysis area, one in mid-January and the other at the end of April.
Tropical Activity
Tropical Storm Kulap: Kulap moved northwest into OPC's radiofacsimile map area near 16N 151E at 1800 UTC January 17 with maximum sustained winds 60 kts with gusts to 75 kts. The cyclone slowly weakened in the following twenty-four hours, became extratropical near 19N 154E at 0000 UTC on the 19th, then dissipated as a stationary remnant low on the 19th.
Typhoon Sonca: Sonca passed about 750 nmi south of Japan and entered OPC's oceanic map area at 0600 UTC April 26, with maximum sustained winds 90 kts with gusts to 110 kts. The cyclone moved northeast and weakened to a tropical storm twelve hours later, before becoming extratropical near 26N 143E at 0000 UTC April 27. The weak remnant low that was Sonca drifted east and persisted to the end of the month.
Other Significant Events
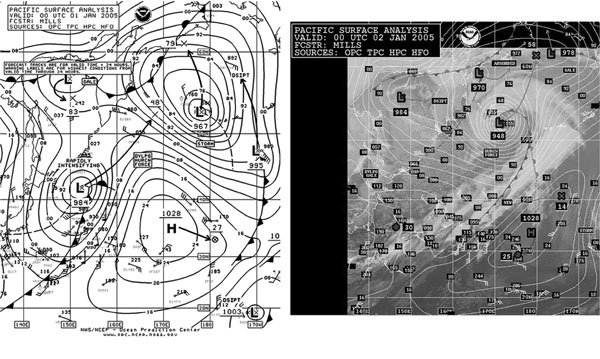
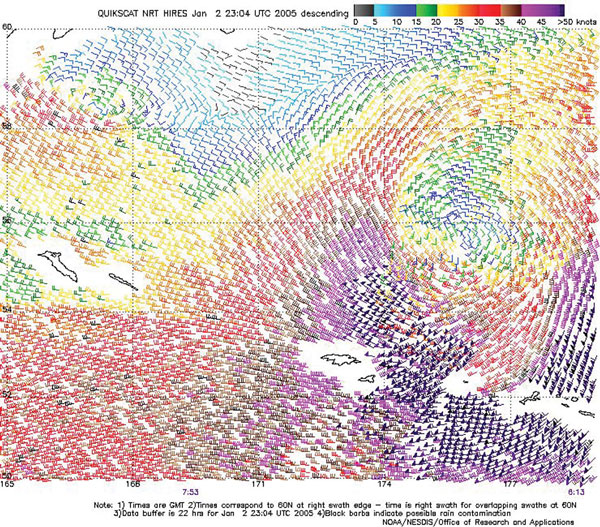
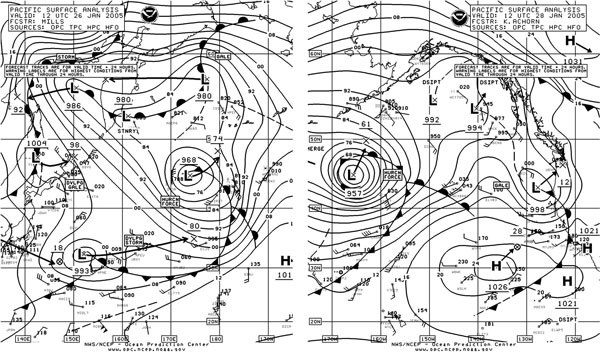
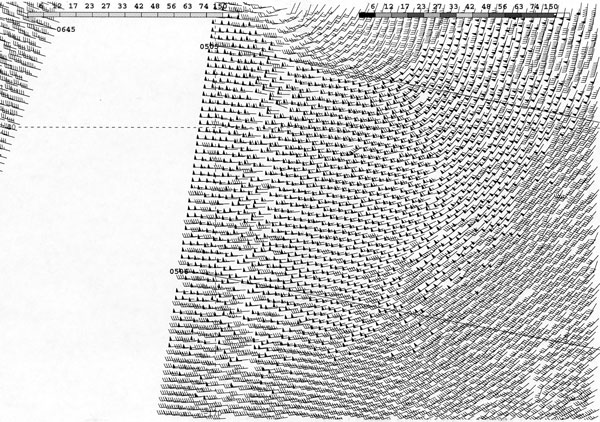
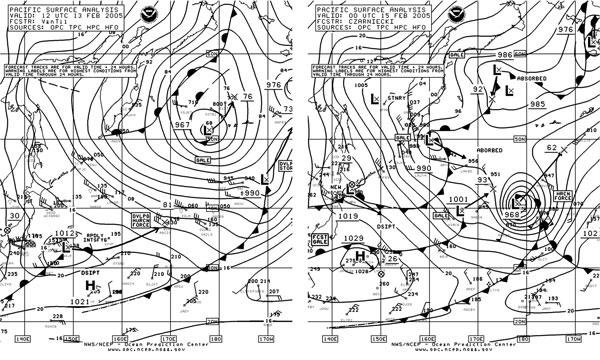
Northwest Pacific and Bering Sea Storm, January 1-3: The month began with storms tracking from near Japan to the western Bering Sea, while strong high pressure covered the northeast Pacific. Figure 1 shows the development of the strongest of these, the 948 hPa hurricane-force storm in the second part of the figure underlain with an infrared satellite image. The storm was at maximum intensity then, making it the second most intense (in terms of central pressure) in the North Pacific in the four-month period. The satellite image features the broad comma head, cloud spiral and well-defined center of an intense system (compare with Figure 4 for the North Atlantic, about a storm of similar intensity). The strongest winds reported by ship was a south wind of 55 kts from Soroe Maersk (OYKJ2) (39N 160E) and Oriental Bay (MKYJ8) (39N 163E) at 0600 UTC and 1200 UTC January 1, respectively. Buoy 46071 (51.2N 179.2E) reported southwest winds as high as 45 kts at 0600 UTC on the 2nd, along with 12.0 m seas (40 ft). The maximum significant wave height at this buoy was 16.0 m (52 ft) three hours later. In the Bering Sea, the buoy 46035 (57.1N 177.6W) reported maximum winds out of the southwest at 50 kts and seas of 9.5 m (31 ft) at 1900 UTC January 2, followed by maximum seas of 10.5 m (34 ft) one hour later. QuikSCAT imagery in Figure 2 reveals winds to 70 kts near the western Aleutians. The storm subsequently moved north of the area on the 3rd and weakened.
|
|
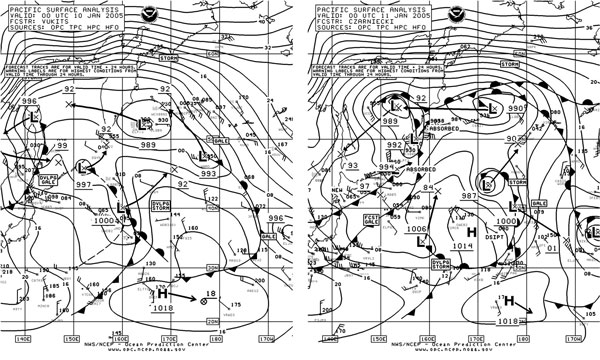
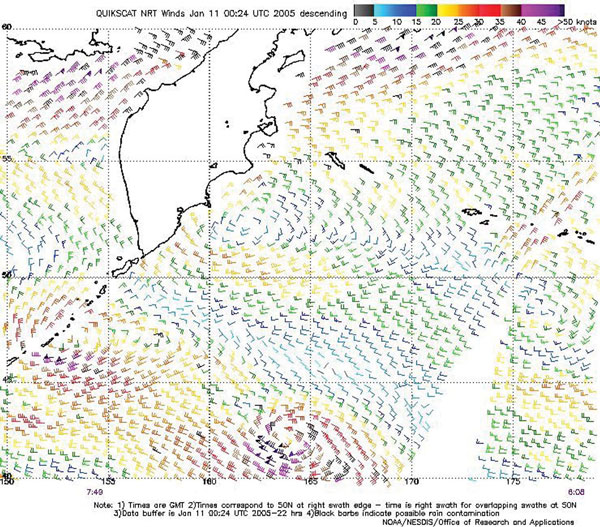
Western North Pacific Compact Storms, January 10-13: Two storms developed in close succession that were small but potent. Figure 3 displays the development of the first to maximum intensity in the twenty-four hour period ending at 0000 UTC January 11. In the absence of any ship data, a QuikSCAT pass from 0749 UTC on the 10th (Figure 4) reveals a small area of winds to 80 kts south of the center. The cyclone then moved to the central Aleutians as a gale on the 12th before turning northwest under the influence of blocking high pressure to the northeast. The development of the second storm is implied by the 24-hour forecast track of the developing storm 35N 159E. The actual intensity was 970 hPa at 0000 UTC January 12 with the center near 43N 163E. There was ship data, with one ship in particular, Manon (SIWN), encountering southwest winds of 75 kts near 42N 167E at 0900 and 1200 UTC January 12. Reported seas were 13.0 m at 0900 UTC on the 12th. Another ship, Ever Grade (3FOW2), reported southwest winds of 40 kts and 11.5 m seas (38 ft) near 42.5N 171.6E at 0000 UTC on the 13th. The system then turned north by the 13th and weakened as a stronger low passed to the south.
|
|
Western North Pacific Storm of January 11-16: This cyclone deepened rapidly at relatively low latitudes after passing east of Japan late on January 11, developing a 962 hPa central pressure near 39N 167E at 0600 UTC on the 13th. This was a drop of 32 hPa in twenty-four hours, impressive for that latitude. A QuikSCAT image valid at about this time suggested a marginal hurricane-force event. The cyclone then turned northeast and expanded in area while developing a lowest central pressure of 953 hPa at 0000 UTC on the 15th, near 42N 176E. Sally Maersk (OZHS2) (40N 168E) reported northwest winds of 50 kts six hours later. The system then drifted northeast while slowly weakening, and dissipating near the southwest Alaska coast by the 20th.
North Pacific Storm, January 26-29: The development of this major storm over a 48-hour period is depicted in Figure 5, as a more marginal hurricane-force event was beginning to wind down to the north near 45N 174E (first part of Figure 5). At 1200 UTC January 27 the Ville de Sagitta (DGCP) near 33N 173E reported northwest winds of 50 kts and 6.5 m seas (22 ft) as the hurricane-force storm was passing to the north. The second part of Figure 5 shows the storm near maximum intensity. Six hours later the ship Trade Foison (V2AI7) (42N 157W) encountered southwest winds of 45 kts and 7.5 m seas (24 ft). A QuikSCAT pass valid about 0500 UTC on the 28th (Figure 6) reveals winds to 75 kts on the southeast side of the center, which was near 43N 167W. The system subsequently turned more north and began to weaken, stalled near 50N 165W on the 29th, then dissipated late on February 2.
|
|
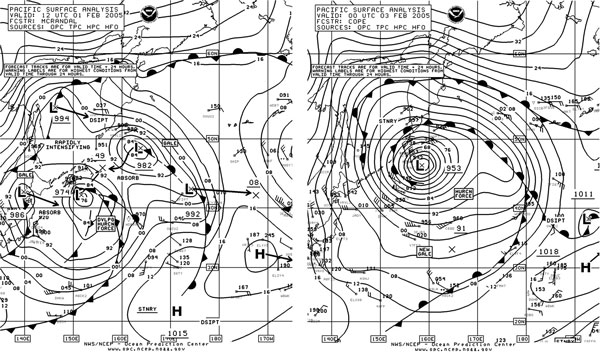 |
Figure 7. OPC North Pacific Surface Analysis charts (Part 2) valid 1200 UTC February 1 and 0000 UTC February 3, 2005. |
Northwest Pacific Storm, February 1-4: Figure 7 shows multiple low-pressure centers east and northeast of Japan consolidating into one intense storm in thirty-six hours, when it reached maximum intensity. The Zim USA (4XFO) is plotted in the second part of Figure 7 with a north west wind of 60 kts. Six hours later the same ship encountered west winds of 70 kts near 42N 157E. At 1200 UTC on the 3rd the Swift Arrow (C6NI7) reported northeast winds of 36 kts and a pressure of 958.7 hPa near 47.5N 158E. The Punjab Senator (DQVK) encountered west winds of 45 kts and 10.5 m seas (35 ft) near 41N 158E at that time. Blocked by high pressure to the north and northeast, the cyclone stalled and weakened to a gale on the 4th and dissipated early on February 8.
North Pacific Storm, February 4-7: Figure 8 shows a secondary low developing southeast of the old stalled system, and rapidly deepening to form the hurricane-force storm near the dateline twenty-four hours later. The central pressure dropped 33 hPa in this period, quite rapid for that latitude. The Zim USA (4XFO) reported northwest winds of 70 kts southwest of the storm center at 0600 UTC February 5 and is plotted in Figure 8. The Punjab Senator (DQVK) had west winds of 55 kts and 11.5 m seas (37 ft) near 39.5N 179E at this time. The system subsequently turned north into the Bering Sea on the 6th, where it stalled and weakened.
|
|
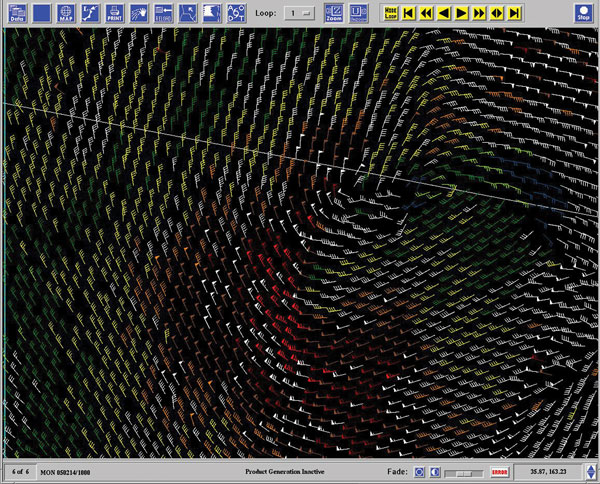 |
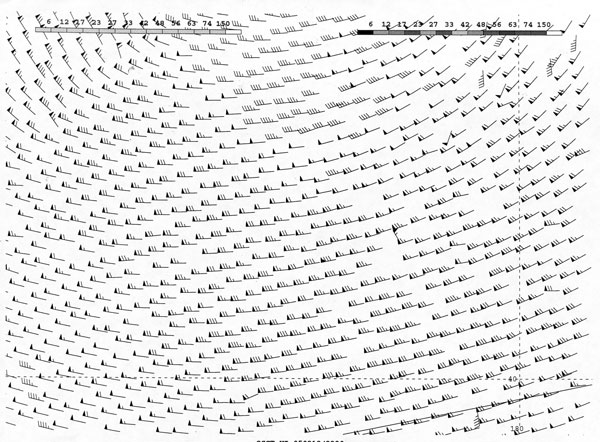
Figure 10. High-resolution QuikSCAT scatterometer Image of satellite-sensed winds around the southwest side of the storm in Figure9 , valid about 0748 UTC February 14, 2005, or about sixteen hours prior to the valid time of the second part of Figure 9. The type of image and source are the same as in Figure 6 |
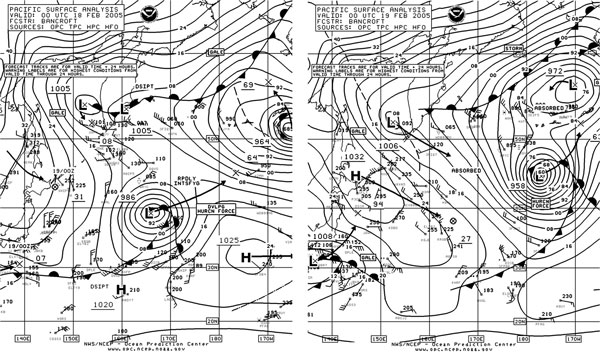
North Pacific Storm, February 13-16: Figure 9 shows the initial development of this storm over a 36-hour period. The central pressure dropped 37 hPa in the twenty-four hour period ending at 1800 UTC on the 14th. A QuikSCAT pass at 0748 UTC on the 14th is quite impressive, showing winds to 85 kts on the southwest side of the center (Figure 10). The ship (HREF) at 1200 UTC on the 14th reported west winds of 45 kts near 31N 167E, just outside the area of storm-force winds. As the storm's central pressure bottomed out at 964 hPa at 1200 UTC on the 15th, the SeaLand Pacific (WSRL) near 41N 172W reported southwest winds of 60 kts. The storm then moved into the eastern Bering Sea late on the 16th and weakened to a gale, followed by dissipation on the 17th.
North Pacific Storms, February 17-19: Two other storms followed similar tracks into the eastern Bering Sea as shown in Figure 11, with the first storm at maximum intensity as it entered the Bering Sea (first part of Figure 11). The ship Trade Rainbow (V2MH) (46N 172W) reported southwest winds of 60 kts at that time. Buoy 46075 (53.9N 160.8W) reported seas as high as 11.0 m (35 ft) at 1100 UTC on the 18th. A QuikSCAT image valid about 1600 UTC on the 17th revealed a small area of 65 to 75 kts wind south of the center. The stronger second storm is shown crossing the dateline in Figure 11 with a lowest central pressure of 958 hPa. Available ship data had winds 35 kts or less, with the Portugal Senator (DQVO) reporting the highest seas (11.5 m or 37 ft) near 49N 168W at 0000 UTC on the 20th. A QuikSCAT pass valid about six hours prior to the time of the second part of Figure 11 is much more revealing, showing a large area of 65 kts or greater south and southwest of the center (Figure 12). There is even a 90 kts wind barb near the dateline. The storm subsequently weakened to a gale near the eastern Aleutians on February 19, before becoming stationary in the southern Bering Sea on the 20th.
|
|
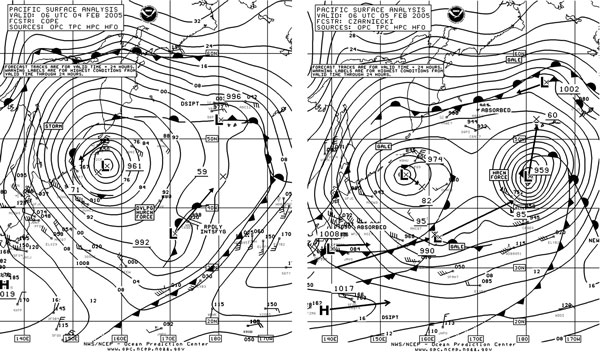
North Pacific Storm, February 24-27: This storm originated south of Japan early on February 24 and quickly developed hurricane-force winds as the center passed 36N 153E at 0600 UTC on the 25th. High-resolution QuikSCAT data was available for about that time and revealed winds up to 85 kts southwest of the center, but is not shown here since it resembles the image in Figure 10, for the February 13-16 event. The ship Canmar Promise (DGSG) (34N 157E) reported southwest winds of 55 kts at 1200 UTC on the 25th. The lowest central pressure was 965 hPa when the center was at 46N 178E at 1200 UTC on the 26th. The cyclone subsequently turned east along 45N and weakened to a gale on February 27.
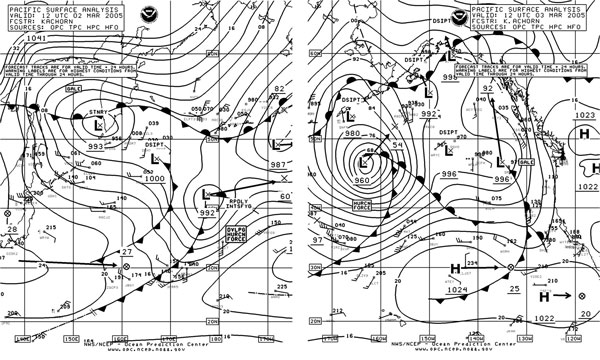 |
Figure 13. OPC North Pacific Surface Analysis charts valid 1200 UTC March 2 (Part 2) and 1200 UTC March 3, 2005 (Part 1). |
North Pacific Storms, March 2-8: Two storms took southwest to northeast tracks from east of Japan before crossing 50N south of Alaska, where they slowed and turned more northwest. Figure 13 shows the first storm in its period of most rapid deepening, when the central pressure dropped 32 hPa in twenty-four hours. Ship data was lacking, but a QuikSCAT pass at about 0600 UTC March 3 showed winds to 75 kts south of the center. The central pressure bottomed out at 953 hPa near 50N 158W at 0600 UTC March 4. It is interesting to note that OPC ran an experimental model retrieval of the sea-level pressure around this storm using QuikSCAT winds, and found a central pressure of 946 hPa (27.94 in) at 1800 UTC on the 3rd (Reference 1). That would be the lowest pressure of the period in the North Pacific. The storm subsequently weakened to a gale near the southwest Alaska coast later on the 4th and drifted west. The second storm was similar, developing a lowest pressure of 952 hPa near 45N 158W at 1200 UTC on March 7. The ship APL Sweden (9VYY5) (41N 175W) reported northeast winds of 55 kts and 10.5 m seas (35 ft) at 0600 UTC on the 6th. At 0000 UTC March 8 Hanjin Vienna (DIBZ) (42N 154W) encountered west winds 45 kts and 11.5 m seas (37 ft).
Eastern North Pacific Storm, March 8-10: A storm developed near the dateline near 32N and moved northeast, before turning north along 150W on the 9th. Winds briefly reached hurricane force southeast of the center late on the 9th, based marginal 65 kts wind barbs on the high-resolution QuikSCAT evening pass. The lowest central pressure was 956 hPa at 0600 UTC March 10 near 52N 149W. Six hours later the ship OOCL Friendship (VRWD3) (53N 151W) encountered southwest winds of 60 kts. The cyclone then moved inland and rapidly weakened late on the 10th.
Eastern North Pacific Storm, April 7-8: This event consisted of a southeastward redevelopment of a Bering Sea low, resulting in a storm at 45N 132W (993 hPa) at 0600 UTC on April 8 approaching the U.S. Pacific Northwest offshore waters. A high-resolution QuikSCAT pass valid about 0300 UTC April showed west winds up to 60 kts south of the center. The ship APL Philippines (WCX8884) (45N 135W) encountered northwest winds of 55 kts and 8.0 m seas (26 ft) at 1200 UTC on the 8th. Six hours later another ship, Sealand Developer (KHRH) (41N 130W), had northwest winds of 50 kts and 9.0 m seas (30 ft). By 0400 UTC on the 9th seas reached 7.5 m (25 ft) at Buoy 46014 near Point Arena. Later, a swell at 46047 (32.5N 119.5W) off southern California reached 6.5 m (21 ft).
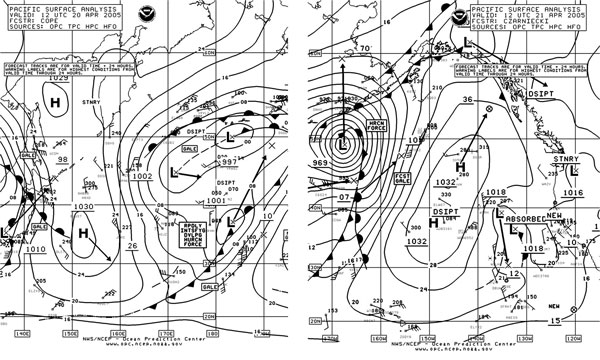
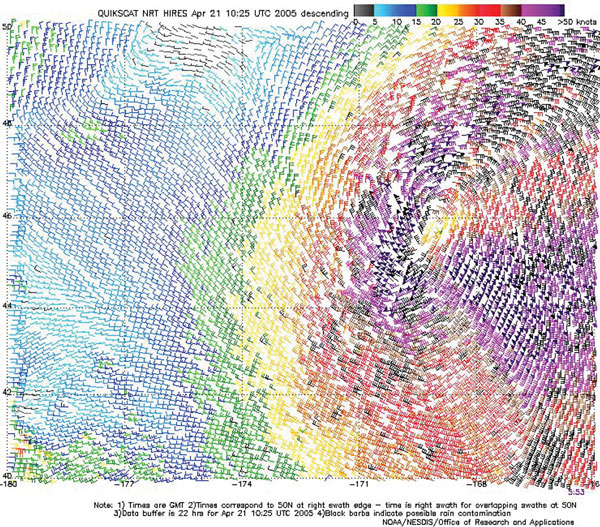
North Pacific Storm, April 20-22: This late-season hurricane-force storm originated down near 33N near the dateline and tracked northeast toward the eastern Aleutians. Figure 14 shows the period of most rapid intensification when the central pressure dropped 32 hPa in twenty-four hours. The lowest central pressure was 967 hPa near 53N 166W six hours later. The Sinuk (WCQ8110) encountered south winds of 70 kts near 57N 159W at 0000 UTC on the 22nd. The vessel Hanjin Philadelphia (A8CN8) (53.3N 160W) reported south winds of 55 kts and 10.5 m seas (35 ft) at the same time. Buoy 46075 (54N 160.8W) reported seas as high as 11.5 m (37 ft) at 2300 UTC April 21. A high-resolution QuikSCAT pass (Figure 15) shows a small area of 65 kts southwest of the well-defined storm center at 46N 169W. The cyclone subsequently weakened to a gale in the Bering Sea and then reached the Bering Strait late on the 22nd.
.
|
|
Reference
1. E-mail communication: Sienkiewicz, Joseph, SLP retrievals using QuikSCAT and UW PBL model, April 8, 2005.
Page last modified: