MEAN CIRCULATION HIGHLIGHTS AND CLIMATE ANOMALIES
September through December 2004
A. James Wagner, Senior Forecaster, Climate Operations Branch, Climate Prediction Center /NCEP/NWS/NOAA.
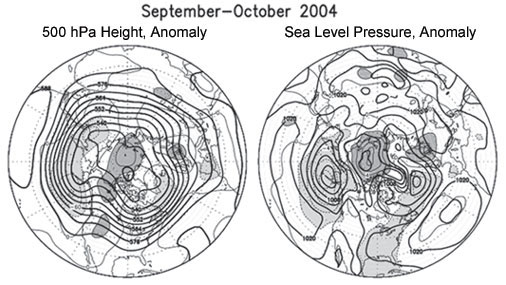
SEPTEMBER - OCTOBER 2004
The circulation pattern over the Northern Hemisphere during September and October was characterized by a stronger than normal 500 hPa ridge over western North America extending over the Arctic Basin. Middle tropospheric heights were below normal across northern portions of both the Atlantic and Pacific Oceans, producing stronger than normal middle latitude westerlies across both oceans. This two-month average obscured a rather dramatic change over the Atlantic in which the westerlies were far north of normal during September, north of a very strong Bermuda-Azores High, while during October below normal heights developed over subtropical latitudes. The strong high collapsed, and blocking developed over high latitudes of the Atlantic. A slightly stronger than normal ridge was located over northern Europe to the northeast of a somewhat amplified trough over the Iberian Peninsula for the two-month period in the mean. This trough was primarily a feature of the October circulation and was associated with some strong storms that struck parts of Western Europe during that month.
The generally weak mean 500 hPa height anomalies over most of the U.S. for the two-month period were associated with changeable weather patterns over North America. During September temperatures were substantially below normal over Alaska for the first time in several months, but by October they had returned to above normal levels. Over the CONUS, temperatures averaged above normal in September over the Northeast and the Central States, but were near to slightly below normal over the West and Southeast. By October, the greatest relative warmth had shifted to the upper Midwest and the southern and southeastern States, with near normal averages over the Northeast and slightly below normal over the Southwest.
Precipitation patterns showed even stronger changes from September to October, with a sudden end to the excessively heavy rains over the eastern U.S. from three landfalling hurricanes, two of them major, that struck Florida in September, while a strong trough that developed in late October near the West Coast brought unusually heavy early season rains to California and parts of the Southwest. Wet conditions across the northern Great Plains in September gave way to a more normal pattern in October.
The Tropics
Conditions over the equatorial Pacific made a gradual transition to a weak El Nino, with moderately above normal temperatures developing across most of the region near the Equator. However, strongest positive anomalies of 1C or greater were generally confined to the area near the Date Line, and SSTs failed to go significantly above normal near the South American Coast, making it likely that this would be a central Pacific event rather than a Basin-wide El Nino. Climate impacts at middle latitudes are generally stronger with Basin-wide events than with central Pacific episodes.
The Atlantic hurricane season was unusually active, with most of the storms crowded into the two months of August and September. By the end of September, when the Atlantic tropical activity abruptly ceased due to the change in circulation mentioned previously, there had been twelve tropical storms, or which eight were hurricanes and six attained major hurricane status. Circulation patterns and SSTs over the tropical Atlantic Basin all favored above normal activity this year, continuing the trend that began in 1995.
Although eastern Pacific tropical activity had been below normal this season, typhoons were active over the western Pacific, with a record ten striking Japan during the whole season through the end of October.
|
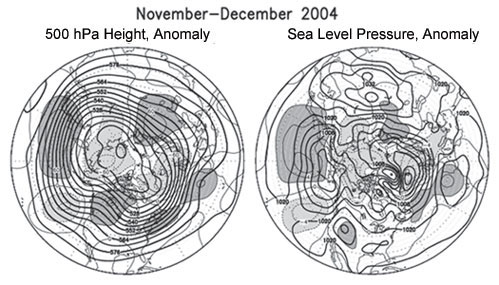
NOVEMBER - DECEMBER 2004
During the late fall months of November and December, an abnormally strong ridge persisted over western Canada, which together with a deeper than normal low over the Arctic basin to the north and northwest continued the spell of unusually mild weather over Alaska, interrupted only by a cooler than normal September. A stronger than normal trough over the eastern Pacific continued to steer unusually strong storms for so early in the season into the southwestern U.S. The two-month average again obscures important differences in the two months, as in November the trough was more of a low latitude feature near Baja California that steered moist air from the tropics northeastward across New Mexico and Texas, producing heavy rainfall from there into the southeastern part of the U.S.
November temperatures averaged above normal over the middle Atlantic area and over most of the northern and central parts of the country, while it was abnormally dry across the northern tier of states from the Pacific Northwest to the upper Mississippi Valley.
During December however, the trough redeveloped near the California coast, bringing a resumption of heavy rains to the Southwest, with heavy snows in the higher elevations of both the Sierras and the coastal ranges. Very little true Arctic air was in evidence, except for a brief cold wave in the eastern U.S. in the latter half of December. A slightly stronger than normal trough over eastern North America brought near to slightly below normal temperatures to most of the eastern third of the U.S., while the Pacific Northwest, Great Basin, and most of the Great Plains enjoyed relatively mild weather. Although the unusually heavy precipitation in the Southwest helped to relieve long-term drought in that area, the rainy season did not yield much precipitation over the Pacific Northwest and the northern Rockies, which continued in long-term drought with little relief. Conditions also continued on the dry side over much of the Great Plains and Mississippi Valley.
The Tropics
Although weak El Nino conditions continued to prevail over the equatorial Pacific, temperatures were not high enough to trigger the anomalous convection along the equator east of the Date Line that is often seen in stronger events. Throughout most of the boreal summer into the fall, convection was concentrated along a pronounced ITCZ near 10 N, but did not take on an El Nino configuration, with the maximum near the equator. It should also be noted here, due to a popular misconception, that the heavy precipitation that had triggered mudslides in some locations over southern California was not due to the weak El Nino but to an unusual mid-latitude circulation pattern that produced a strong trough near the California coast. By late December, the intensity of the Madden-Julian waves began to pick up again, and these systems moving slowly eastward through the equatorial belt or the eastern Indian Ocean and western Pacific were tending to override any influence of the weak El Nino, giving variable forcing and contributing to frequent changes in the middle latitude circulation over the Pacific and North America.
The typhoon season remained active over the southwestern Pacific, where tropical cyclone development continued to be favored by deep easterlies south of the stronger than normal subtropical ridge over most of the western and central Pacific. The storms remained at low latitudes, affecting the Philippines and Southeast Asia primarily in November, but giving Japan a welcome respite.
Figure legends and description of units:
The charts on the left show the seasonal mean 500 hPa height contours at 60 m intervals in heavy solid lines, with alternate contours labeled in decameters (dm). Positive height anomalies are contoured in light solid lines at 30 m intervals, and light dashed lines show negative height anomalies. Areas of mean height anomalies more than 30 m above normal have heavy shading, and areas of mean height anomalies more than 30 m below normal have light shading.
The charts on the right show the seasonal mean sea level pressure (SLP) at 4 hPa intervals in heavy solid lines, labeled in hPa at selected intervals. Anomalies of SLP are contoured in light lines at 2 hPa intervals, with dark shading and solid lines in areas more than 2 hPa above normal, and light shading with dashed lines in areas greater than 2 hPa below normal.
|
Page last modified: