Overview of the 2003 Central North Pacific Tropical Cyclone Season
Andy Nash, Science & Operations Officer, Hans Rosendal, Tim Craig and Robert Farrell, Hurricane Forecasters Central Pacific Hurricane Center, Honolulu HawaiiTotal tropical activity for the season was below normal, with two named systems occurring within the area of responsibility of the Central Pacific Hurricane Center (CPHC). One tropical cyclone (01-C) developed within the central Pacific, with one system (Jimena) moving into the area from the eastern Pacific. A third tropical system, Guillermo, weakened to a remnant low just to the east of CPHC's area of responsibility, and although CPHC issued one advisory on the system it will not be considered in the final count of tropical activity for the central Pacific for the season. The season was generally quiet, but Hurricane Jimena still managed to take the spotlight. Jimena, at one point a category two hurricane, was the first direct threat to Hawaii in several years. Although it ended up passing about 100 nmi south of the Big Island as a rapidly weakening tropical storm, it had the potential of coming closer as a hurricane.
| Name | Dates | Min.
Pressure
hPa ) |
Maximum Sustained Winds KT |
|---|---|---|---|
| Remnants of Tropical Depression Guillermo | Aug 12 - 13 | n/a | 25 |
| Tropical Depression 01-C | Aug 15 - 17 | 1009 | 30 |
| Hurricane Jimena | Aug 30 - Sep 5 ** | 970 | 90 |
| Table 1. List of Tropical Cyclones. ** denotes information for only that portion of the storm's lifetime in the central north Pacific (CPHC's area of responsibility. | |||
Remnants of Tropical Storm Guillermo 12-13 August 2003
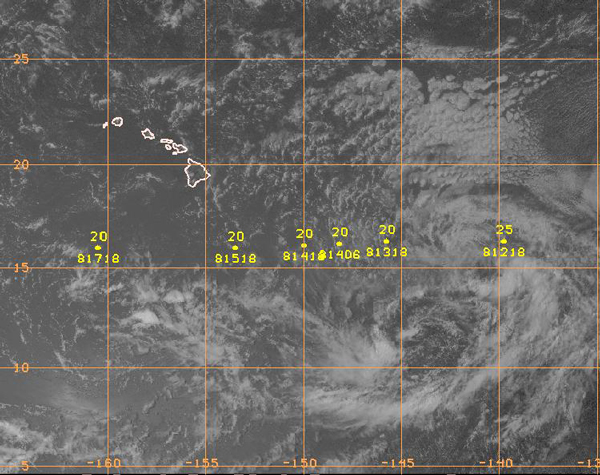
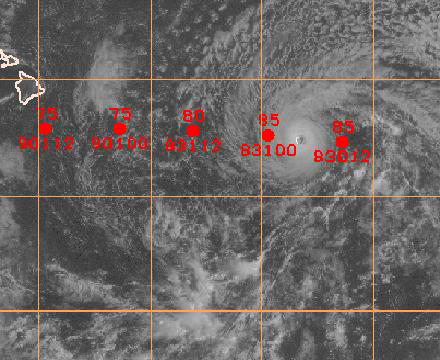
History. Remnants of an eastern Pacific Tropical Storm, Guillermo, moved west into the central Pacific across 140W between 1800 UTC 12 August and 0000 UTC 13 August. Real-time operational evaluation of the system classified it as a weak Tropical Depression, so the Central Pacific Hurricane Center (CPHC) issued a forecast advisory on Guillermo before downgrading it further. Post storm analysis indicated that the system had in fact weakened sufficiently 6 to 12 hours earlier to be classified as a remnant low at 139.8W, east of the CPHC area of responsibility. The remnant low cloud swirl remained intact for a few more days as it drifted southwest and interacted with another weak low level circulation that ultimately developed into Tropical Depression 01-C.
|
Figure 1. - Visible satellite image of Guillermo taken at 0030 UTC 13 August. Dots on the image are the initial and forecast positions from the forecast bulletin. Plotted values are the maximum forecast winds (above dot) and position valid date/time (below dot) in MDDHH format. |
Tropical Depression One-C 15-17 August 2003
History. The first tropical cyclone of the season in the central Pacific, Tropical Depression (TD) 01-C, developed within an active portion of the monsoonal trough that formed in mid August to the southeast of the Hawaiian islands. The first CPHC advisory on TD 01-C was issued at 1800 UTC 15 August with the center near 13.8N 151.0W and estimated 30 kt winds in a small area north of the center. The depression was moving west at 10 kt remaining well south of the Hawaiian Islands with little effect on the islands' weather. TD 01-C never strengthened further as it moved generally westward. By 0000 UTC 17 August, TD 01-C had weakened into a remnant low level circulation.
|
|
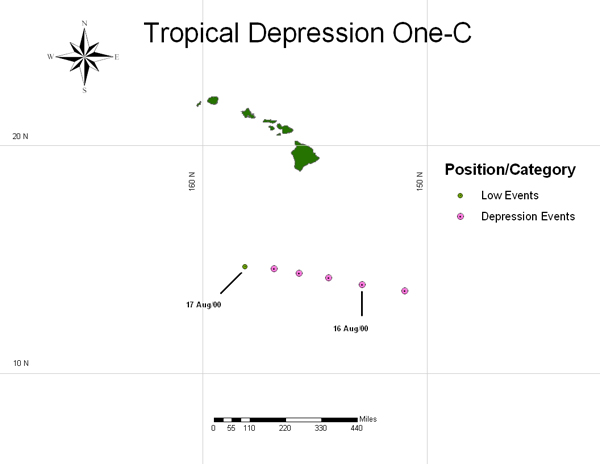
This weak remnant circulation did maintain itself for several more days as it moved west toward the Dateline with deep convection occasionally flaring up. It passed just south of Johnston Atoll at 1800 UTC 18 August and crossed the International Dateline near 16N into the western Pacific on 20 August. By 0000 UTC 17 August, TD 01-C had weakened into a remnant low level.
Synoptic Factors. Vertical wind shear was unfavorable for the development of TD 01-C as was the upper flow pattern that featured a large upper tropospheric trough to the northeast. The trough extended its cyclonically curved flow southwestward down over the depression.
TD 01-C therefore did not develop beyond the tropical depression stage, and it commenced weakening on 16 August as the deep convection dissipated.
| Date/Time (UTC) | Latitude
(°N) |
Longitude (°W) | Pressure hPa | Wind Speed KT | Stage/Notes |
|---|---|---|---|---|---|
| 15 / 1800 | 13.6 | 151.0 | 1009 | 30 | tropical depression |
| 16 / 0000 | 13.9 | 152.9 | 1009 | 30 | " |
| 16 / 0600 | 14.2 | 154.4 | 1009 | 30 | " |
| 16 / 1200 | 14.4 | 155.7 | 1009 | 30 | " |
| 16 / 1800 | 14.6 | 156.8 | 1009 | 25 | " |
| 17 / 0000 | 14.7 | 158.1 | 1009 | 25 | remnant low |
| Table 2. TD-01C Best Track Data | |||||
Hurricane Jimena 28 August - 5 September 2003
|
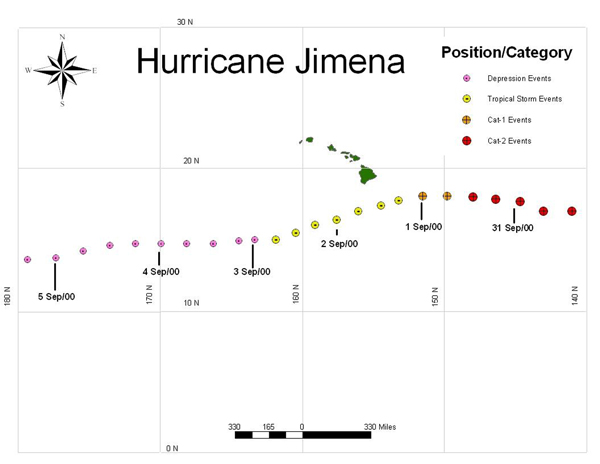
Figure 4. - Best Track for Jimena |
History. Tropical Depression 10-E formed around 0600 UTC 28 August from an area of convection some 1500 nmi east southeast of Hilo, Hawaii. The depression gained tropical storm intensity at 1800 UTC 28 August and was named Jimena. Tropical Storm Jimena continued the rapid strengthening trend and reached hurricane force just 18 hours later at 1200 UTC 29 August about 1200 miles east-southeast of Hilo.
Hurricane Jimena continued to develop as it moved just north of due west and directly toward the Hawaiian Islands. Jimena crossed 140W and entered the CPHC's area of responsibility at 0600 UTC 30 August, with maximum winds of 85 kt. Jimena continued its intensification for another six hours, reaching 90 kt, category 2 on the Saffir-Simpson scale, at 1800 UTC 30 August while about 700 nmi east of the Big Island of Hawaii. Jimena began to slowly weaken after 0600 UTC 31 August while continuing to move west- northwestward toward the Big Island of Hawaii.
Jimena lost strength dramatically beginning about 1800 UTC 31 August as it came under strong upper level shear from the south. At about that time, the first of a series of flights by the 53rd Weather Reconnaissance Squadron of the U. S. Air Force Reserve Command commenced. Data from the first flight indicated the strongest flight-level (700-hPa) wind speed was 71 kt with the lowest pressure measured by dropwindsonde of 990-hPa. Jimena began to turn and track south of due west after 0000 UTC 1 September, and weakened further, rapidly dropping below hurricane force by 0600 UTC 1 September when it was located a few hundred miles south-southeast of the Big Island of Hawaii. Tropical Storm Jimena passed about 105 nmi south of South Point on the Big Island of Hawaii about 1500 UTC 1 September. Tropical Storm Jimena continued to weaken as it moved west-southwest, well south of the remainder of the Hawaiian Islands. Jimena dropped below Tropical Storm strength by 0000 UTC 3 September, when it was about 400 miles southwest of Kauai. Tropical Depression Jimena continued to track westward, eventually crossing the Dateline and out of CPHC's area of responsibility after 0600 UTC 5 September.
| Date/Time (UTC) | Latitude
(°N) |
Longitude (°W) | Pressure hPa | Wind Speed KT | Stage/Notes |
|---|---|---|---|---|---|
| 30 / 1200 | 17.3 | 141.3 | 972 | 85 | hurricane |
| 30 / 1800 | 17.3 | 142.9 | 970 | 90 | |
| 31 / 0000 | 17.6 | 144.4 | 976 | 90 | |
| 31 / 0600 | 17.8 | 146.1 | 980 | 90 | |
| 31 / 1200 | 18.0 | 147.8 | 984 | 85 | |
| 31 / 1800 | 18.2 | 149.6 | 991 | 75 | |
| 01 / 0000 | 18.1 | 151.3 | 1000 | 65 | |
| 01 / 0600 | 17.8 | 153.0 | 1000 | 55 | tropical storm |
| 01 / 1200 | 17.4 | 154.5 | 1002 | 45 | |
| 01 / 1800 | 17.0 | 156.1 | 1002 | 40 | |
| 02 / 0000 | 16.5 | 157.6 | 1005 | 35 | |
| 02 / 0600 | 16.1 | 159.0 | 1006 | 35 | |
| 03 / 0000 | 15.1 | 163.4 | 1009 | 30 | tropical depression |
| 03 / 0600 | 14.9 | 164.9 | 1009 | 30 | |
| 03 / 1200 | 14.7 | 166.5 | 1009 | 25 | |
| 03 / 1800 | 14.7 | 168.2 | 1009 | 25 | |
| 04 / 0000 | 14.7 | 170.0 | 1009 | 25 | |
| 04 / 0600 | 14.7 | 171.8 | 1009 | 30 | |
| 04 / 1200 | 14.6 | 173.6 | 1009 | 30 | |
| 04 / 1800 | 14.2 | 175.5 | 1010 | 30 | |
| 05 / 0000 | 13.7 | 177.4 | 1009 | 30 | |
| 05 / 0600 | 13.6 | 179.4 | 1009 | 30 | moving out of central Pacific |
| Table 3. Jimena Best Track Data (Central Pacific only) | |||||
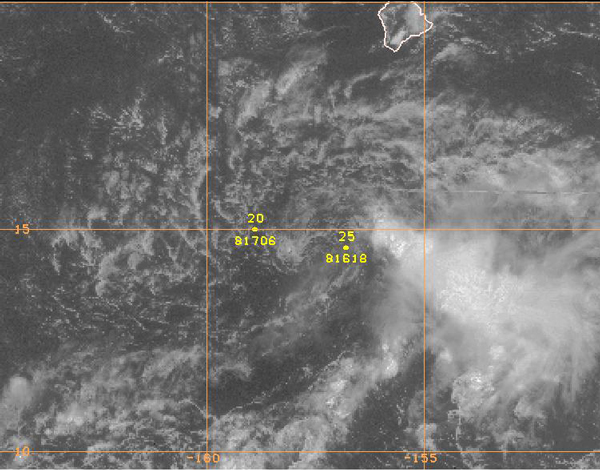
Synoptic Factors. Deep easterlies controlled Jimena's movement in the early days of her development through 1200 UTC 31 August when Hurricane Jimena, with winds up to 90 kt, was moving in the direction of the Big Island of Hawaii. Beyond this time, Jimena moved into an area of strong shear ahead of a trough sitting over the western Hawaiian Islands. This shear rapidly weakened the storm and allowed the surface center to begin moving west-southwestward with the lower level east northeasterly trade flow. Jimena continued to move with this low-level trade wind flow, further weakening to a tropical depression, again well south of the Hawaiian Islands. The trough over the Hawaiian Islands retarded any possible redevelopment. The storm passed westward south of 15N and across the Dateline before dissipating to a remnant low.
|
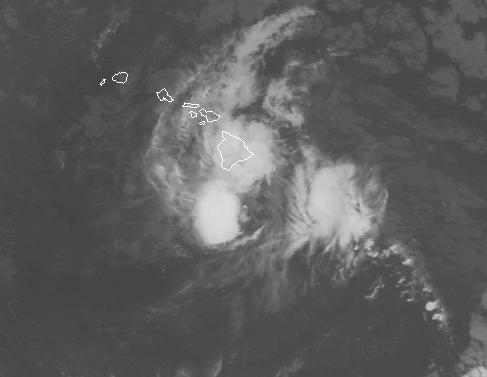
Figure 5. - Visible satellite image taken at 1900 UTC 31 August. Dots on the image are the initial and forecast positions from the forecast bulletin. Plotted values are the maximum forecast winds (above dot) and position valid date/time (below dot) in MDDHH format. |
Impacts. Jimena was the first tropical storm or hurricane to pose a considerable threat to Hawaii since Daniel in 2000. Based upon forecasts initially by the Tropical Prediction Center (TPC) and continued by the CPHC of Jimena passing about 50 nm south of the Big Island, a Hurricane Watch was posted at 0000 UTC 31 August for the Big Island. This was followed by a Tropical Storm Warning posted at 0300 UTC 1 September. Ultimately the center of Jimena passed a little more than 100 nmi south of the Big Island as a weakening and increasingly disorganized tropical storm. Thus the effects on the Big Island were minimal. Highest wind gusts were 46 kt at South Point and 50 kt on Kahoolawe which is exposed to accelerated winds flowing between Maui and the island of Hawaii. Jimena produced rainfall amounts of 6 to 10 inches, with higher isolated amounts, across the windward sections of the Big Island. No significant flooding occurred. High surf with heights of 6 to 12 feet was reported along the southeast-facing shores of the Kau district and up to 11 feet along the coast just north of Hilo on the island of Hawaii. The Hurricane Watch was discontinued at 1500 UTC 1 September with the Tropical Storm Warning cancelled at 2100 UTC 1 September.
|
|
Page last modified: