Tropical Atlantic and Tropical East Pacific Areas September through December 2010
Marshall Huffman and Scott Stripling
Tropical Analysis and Forecast Branch,
National Hurricane Center, Miami, Florida
NOAA National Center for Environmental Prediction
The National Hurricane Centers (NHC) Tropical Analysis and Forecast Branch (TAFB) issued 19 non-tropical cyclone warnings in their Atlantic High Seas Area of Responsibility (AOR) and 13 warnings in their Pacific High Seas AOR during the period from 1 September to 31 December 2010. Tables 1 and 2 summarize the warning events of this period. The TAFB Tropical Atlantic AOR extends from 7° to 31°N west of 35°W, including the Caribbean Sea and Gulf of Mexico.
Atlantic Warnings
September proved to be a very active
period for tropical cyclone formation
with 8 named systems during the month,
which required a multitude of tropical
cyclone related warnings, culminating
in the transition of tropical storm Nicole
to an area of broad low pressure with
widespread minimal gales on the 29th.
Interestingly, the one storm force wind
event from this period occurred during
the extra tropical transition phase of
Hurricane Tomas on 8 November. See
the NHC web site for a summary of
seasonal tropical cyclone activity at:
http://www.nhc.noaa.gov/2010atlan.
shtml.
La Nina conditions developed across the tropical Pacific by August 2010 and contributed to the very active Atlantic Hurricane Season, as well as the very inactive East Pacific Hurricane Season. La Nina conditions persisted through December, and continued to influence weather patterns across the Atlantic Basin (Reference 1). This influence was amplified by the development of an upper atmospheric blocking pattern across the North Atlantic, known as the negative phase of the North Atlantic Oscillation (NAO). A detailed description of the NAO can be found at http://www.cpc.ncep.noaa. gov/data/teledoc/nao.shtml. The NAO can strongly affect winter weather patterns across North America, the North Atlantic, and Western Europe by evolving into one of two prevailing modes. These two modes, termed the positive and negative phase of the NAO, are most readily identified by persistent middle to upper atmospheric patterns that dominate the North Atlantic. Figure 1 shows a graphical representation of these negative and positive NAO phases. During the last week of November, the negative phase of the NAO became strongly established across the Atlantic and persisted beyond the end of December. Figure 2 shows the mean 500 hPa heights across the Atlantic basin during December and exhibits a classic negative NAO pattern. The upper air pattern during this period resulted in a succession of low pressure systems that moved from the eastern U.S. across the northwest Atlantic, and dragged cold fronts east and southeastward across the southeast U.S. and much of the TAFB Atlantic AOR. Unseasonably cold air followed several of these fronts across the region during the end of November and December, resulting in below normal temperatures across much of the southeast U.S. During this five week period, a succession of six cold fronts swept across the Gulf of Mexico and then into the Atlantic and Caribbean, resulting in 12 of the 19 TAFB warning events.
| Onset | Region | Peak Wind Speed | Duration | Forcing | ||||||
|---|---|---|---|---|---|---|---|---|---|---|
| 0000 UTC 02 Jan | SW N Atlc | 40 kts | 36 hr | East of Cold Front | ||||||
| 0000 UTC 26 Oct | Central Atlc | 35 kts | 24 hr | N of Low | ||||||
| 0000 UTC 28 Oct | Central Atlc | 35 kts | 12 hr | E of Low | ||||||
| 1200 UTC 29 Oct | Gulf of Mexico | 35 kts | 18 hr | W of Cold Front | ||||||
| 1200 UTC 04 Nov | Gulf of Mexico | 35 kts | 24 hr | W of Cold Front | ||||||
| 0000 UTC 08 Nov | SW N Atlc | 50 kts | 42 hr | Post-tropical Tomas | ||||||
| 1200 UTC 25 Nov | SW N Atlc & Central Atlc | 35 kts | 84 hr | Either Side of Cold Front | ||||||
| 1200 UTC 26 Nov | Gulf of Mexico | 35 kts | 12 hr | W of Cold Front | ||||||
| 1200 UTC 30 Nov | Gulf of Mexico | 40 kts | 24 hr | W of Cold Front | ||||||
| 0000 UTC 02 Dec | Central Atlc | 35 kts | 54 hr | S of Low | ||||||
| 0600 UTC 05 Dec | SW N Atlc | 35 kts | 12 hr | E of Cold Front | ||||||
| 1800 UTC 08 Dec | Gulf of Mexico | 35 kts | 12 hr | W of Cold Front | ||||||
| 1200 UTC 12 Dec | Gulf of Mexico | 35 kts | 30 hr | W of cold Front | ||||||
| 1800 UTC 12 Dec | SW N Atlc & Central Atlc | 35 kts | 54 hr | Either Side of Cold Front | ||||||
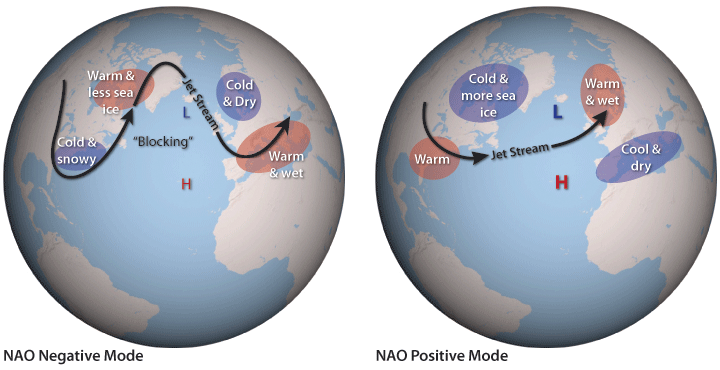
Figure 1. Schematic depicting the Jet Stream pattern and resultant winter weather associated with Negative and Positive phases of the NAO. Source: http://www.ncdc.noaa.gov/sotc/2010/13
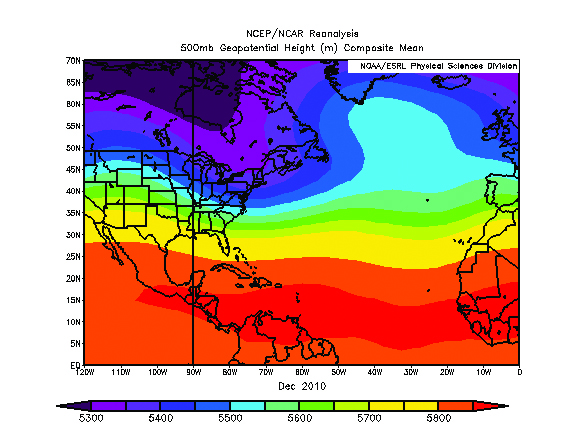
Figure 2. Mean 500 hPa heights across the Atlantic during December 2010 depicting classic NAO negative phase blocking pattern. Graphic provided by the NOAA Earth Systems Research Lab (ESRL) Physical Sciences Division (PSD) from the NCEP/National Center for Atmospheric Research (NCAR) Reanalysis dataset.
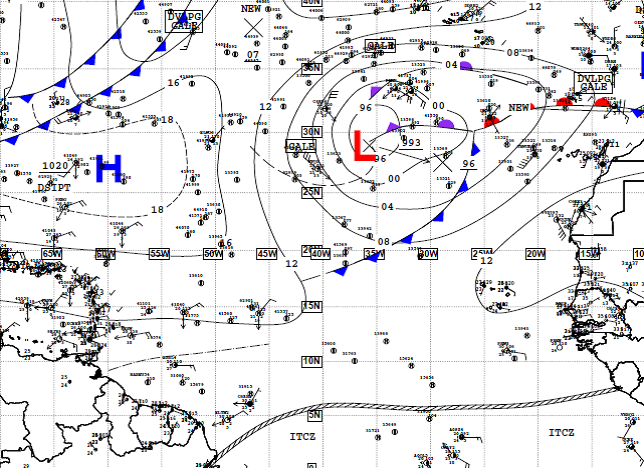
Figure 3. National Weather Service (NWS) Unified Surface Analysis for 1200 UTC 28 Nov 2010.
Three of the cold fronts during this period were responsible for extended gale force wind events which continued beyond 3 days (>72 hours) across the TAFB AOR. The first of these three extended gale events began on 25 November when a deepening storm system across the North Atlantic increased the pressure gradient on both sides of an associated cold front stretching across north portions of the TAFB AOR. Minimal gales of 35 kts continued near this frontal boundary as it moved southeastward over the next few days. A new area of low pressure developed along the front, north of the TAFB AOR across the central Atlantic, which shifted southeastward into the Eastern Atlantic, where it then deepened and became occluded, bringing northerly gales across the western semicircle of the low into the TAFB AOR from 0600 UTC 28 Nov through 0000 UTC 29 November. Figure 3 shows the NWS unified surface analysis for 1200 UTC 28 November with gale center over the Eastern Atlantic.
The strongest winds observed across the Gulf of Mexico during this period occurred with a cold front that swept across the Gulf from 30 Nov through 1 Dec, and produced northerly gales to 40 kts across the central Gulf behind the front. Figure 4 shows these gale force winds captured by a 30 Nov 1524 UTC high resolution ASCAT pass. A 0900 UTC 1 December observation from cargo ship H A Skelnar (C6CL6) reported N-NW winds at 45 kts near 24.2N 87.3W, located in the strong wind band occurring within 150 nmi behind the cold front across the central Gulf of Mexico. This observation was considered slightly high based on other observations across the area and an ASCAT pass from 6 hours previous that only showed winds 30 to 35 kts. This event was one of seven gale events across the Gulf of Mexico during the period, and the only event with verified winds to 40 kts.
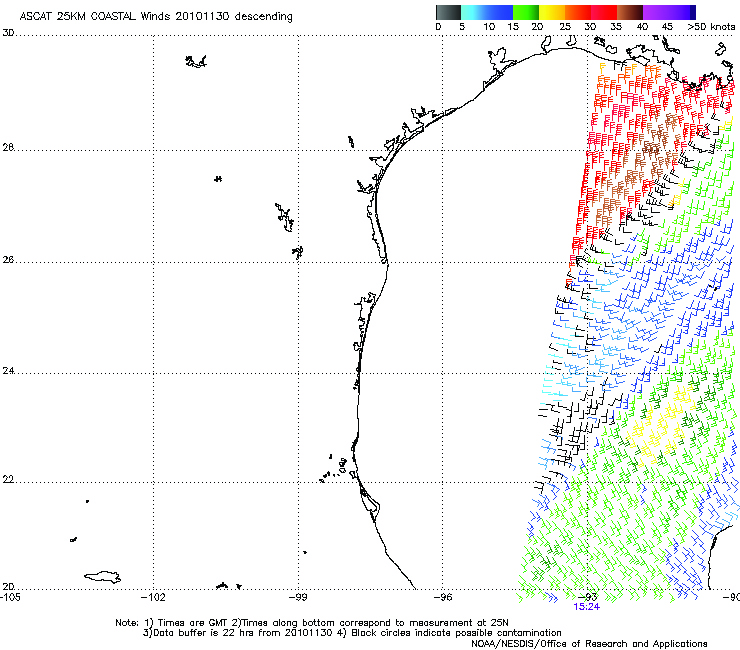
Figure 4. 30 Nov 1524 UTC ASCAT pass with brown wind barbs south of the Louisiana coast revealing 35-40 kts winds behind cold front.
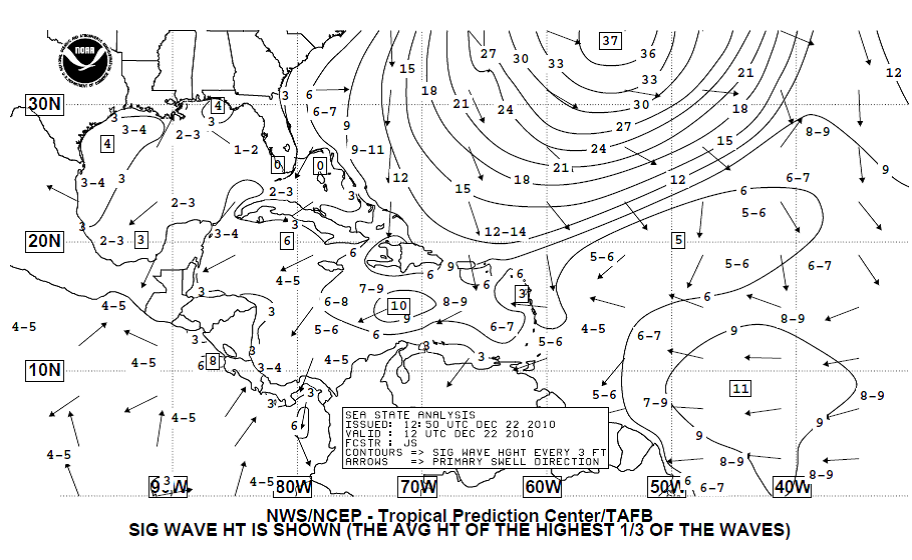
Figure 5. TAFB Atlantic Sea State chart (in feet) from 1200 UTC 22 December showing large wave field spreading from NW Atlantic south and southeastward into TAFB AOR.
A second long lived gale and large swell event evolved during the third week of December as two distinct low pressure centers developed near a lingering frontal boundary that stretched from the northern Gulf of Mexico east northeastward into the central Atlantic. On 18 December, a low center over the northeast Gulf of Mexico, and a second center offshore of the North and South Carolina coasts both shifted northeastward and intensified, with the southernmost low deepening to a 1002 hPa low near 27N69W, located just east of the cold front on 1800 UTC of the 19th. This low produced gales across its northeast and eastern semicircles as it shifted northeastward and out of the TAFB AOR. Westerly gales of 35 to 40 kts were reported by the cruise liners Celebrity Eclipse (9HXC9) and Grand Princess (ZCBU5) between 1200 and 1800 UTC as they transited just east of the central Bahamas and moved through the south semicircle of this low. The northernmost low moved northeastward across the northwest Atlantic and deepened steadily over the next 48 hours, eventually producing hurricane force winds across its southwest quadrant on the 21st outside of the TAFB AOR. The resultant broad wind field to the west of this second low and the associated cold front that moved southeast across the TAFB AOR produced very large long period swell that affected the entire Atlantic AOR. Gale force winds continued west of the cold front until 1200 UTC 23 December, extending this gale event to 90 hours. Seas north of 28N and behind the cold front maximized at 30 to 33 ft on 22 and 23 December, Figure 5.
A third long lived gale event began at 0600 UTC 26 Dec as a cold front shifted east out of the Gulf of Mexico and entered the west Atlantic, with southerly gales occurring across northwest portions of the TAFB AOR, east of the coastal front and a developing low pressure center along the Georgia coast. The cruise liners Norwegian Dawn (C6FT7) and Carnival Fascination (C6FM9) reported these southerly gales ahead of the front between 0400 and 0700 UTC. The low lifted northeastward along the eastern seaboard and rapidly intensified to storm force during the next 48 hours, while the associated cold front shifted southeastward through the Bahamas to eastern Cuba and the northwest Caribbean. Gale force winds occurred across north portions of the AOR on both sides of the front through 00 UTC 28 December before shifting exclusively west of the progressing front through 18 UTC 29 Dec. Numerous vessels transiting these waters reported west to northwest gales, including Norwegian Spirit (C6TQ6), Saudi Diriyah (HZZB), S/R Wilmington (WBVZ), and Prince of Seas (A8JI5). Gales associated with this event lasted 84 hours.
Caribbean Sea Warnings
There were no non tropical cyclone warnings issued for the Caribbean during this period, although several events of widespread northeast to east trades of 25 kts across central portions occurred, as well as the typical enhanced northeasterly trades to 30 kts along the coast of Colombia. The pattern transition to the negative phase of the NAO also affected the Caribbean by allowing Gulf of Mexico and West Atlantic cold fronts to progress southeastward into portions of the Caribbean. During the last 6 weeks of the year, three cold fronts moved into the northwest Caribbean but did not progress east of 70W, and gradually dissipated, while an additional six fronts swept through the northwest and central Caribbean and reached the northeast Caribbean and Leeward Islands. One of these six fronts continued southeast to the Windward Islands then sank slowly southward into the southeast Caribbean on 23 December, where it transitioned to a shear line extending from the tropical north Atlantic through the Windward Isles to just north of Aruba, Bonaire and Curacao (also known as the A-B-C Islands). From there the front became stationary and dissipated within 48 hours. Recent climatology would suggest that this frequency of early season cold fronts moving into the Caribbean is higher than typically normal.
Eastern North Pacific Ocean to 30N and East of 140W
All but two of the eastern North Pacific non-tropical cyclone warning events observed from 1 September 2010 to 31 December 2010 found between 30N and the equator east of 140W were in the Gulf of Tehuantepec, driven by midlatitude cold frontal passages through the narrow Isthmus of Tehuantepec. There were eleven occurrences of gale force winds, with five of those events producing winds of storm force. These events are cataloged in Table 2.
The first non-tropical cyclone warning event of the period occurred over the open waters of the eastern North Pacific Ocean. This gale event was associated with an area of low pressure located in the vicinity of 20N108W that continued to drift northwestward during the period of gale force winds. Winds reached gale force beginning at 1800 UTC 20 September according to the Advanced Scatterometer ASCAT data and the ship, Zim San Francisco (FDZA2) which reported 35 kts at 0300 UTC 21 September within 75 nmi north-northwest of the low center. While gale force wind warnings were in effect for this system in the TAFB High Sea Forecast area, post-analysis in the Tropical Cyclone Report for Georgette (Reference 2) indicated that indeed a tropical cyclone had formed at the onset of gale conditions.
The other gale force wind event not related to the Gulf of Tehuantepec region was a very short lived Gulf of California gale that lasted 6 hours beginning 0600 UTC 1 December.
| Onset | Region | Peak Wind Speed | Gale/Storm Duration |
|---|---|---|---|
| 1800 UTC 20 Sep | High Seas near 20N108W | 35 kts | 18 hr / transitioned to a tropical cyclone |
| 1200 UTC 03 Oct | Gulf of Tehuantepec | 35 kts | 84 hr |
| 1800 UTC 13 Oct | Gulf of Tehuantepec | 50 kts | 78 hr / 48 hr |
| 0600 UTC 29 Oct | Gulf of Tehuantepec | 40 kts | 48 hr |
| 0600 UTC 04 Nov | Gulf of Tehuantepec | 50 kts | 108 hr / 12 hr |
| 1800 UTC 18 Nov | Gulf of Tehuantepec | 45 kts | 42 hr |
| 1200 UTC 27 Nov | Gulf of Tehuantepec | 35 kts | 12 hr |
| 0600 UTC 01 Dec | Gulf of Tehuantepec | 50 kts | 60 hr / 30 hr |
| 0600 UTC 01 Dec | Gulf of California | 35 kts | 06 hr |
| 1200 UTC 06 Dec | Gulf of Tehuantepec | 40 kts | 24 hr |
| 0000 UTC 09 Dec | Gulf of Tehuantepec | 50 kts | 36 hr / 18 hr |
| 1800 UTC 12 Dec | Gulf of Tehuantepec | 50 kts | 48 hr / 12 hr |
| 0600 UTC 26 Dec | Gulf of Tehuantepec | 40 kts | 42 hr |
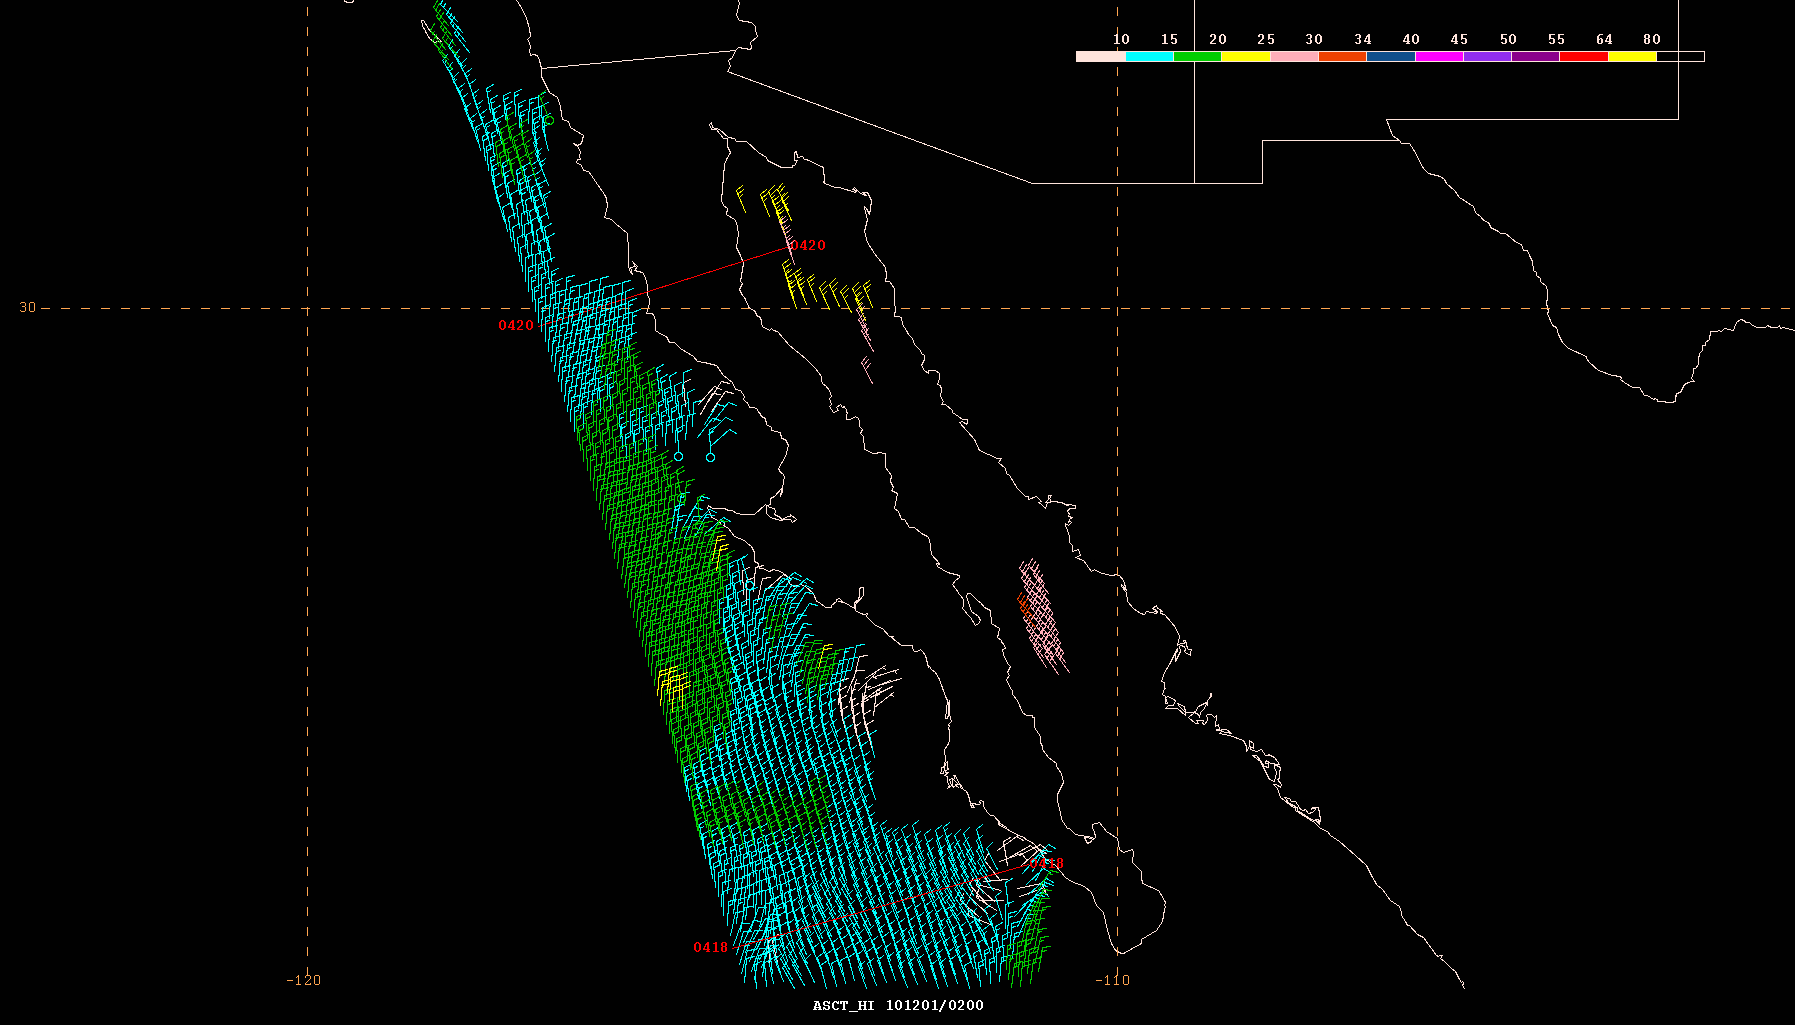
Figure 6. Ocean vector wind retrievals from the ASCAT pass on 0418 UTC 01 December 2010. Note the area of near gale force winds in the Gulf of California extending from 22N to 29N.
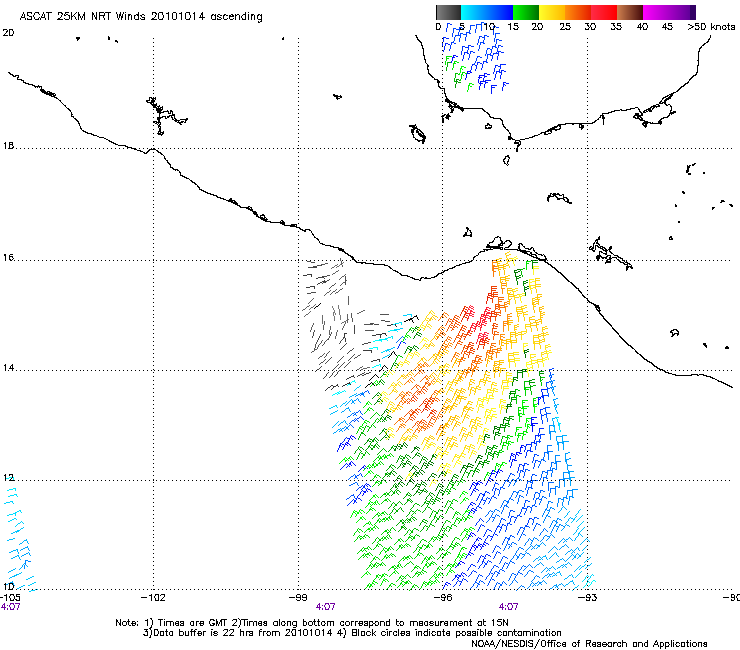
Figure 7. Ocean vector wind retrievals from an ASCAT pass on 0407 UTC 14 October 2010. Note the large swath of winds to gale force in the Gulf of Tehuantepec and area extending southsouthwest.
A recent study, Cohen et al. 2010 (Reference 3), showed from special observations that gales may be more frequent in the Gulf of California than previously recognized. Strong surface troughing along the eastern coast of the Gulf of California was responsible for a tight pressure gradient over the Gulf of California between this trough and a ridge anchored by a 1028 hPa high centered over the northeast Pacific Ocean near 36N126W. This resulted in strong northerly flow across the entire Gulf of California. A 0418 UTC 1 December ASCAT pass traversed the gulf waters and indicated a large area of 30 kts wind barbs over the central Gulf of California. A gale warning was issued through 1200 UTC 1 December because the ASCAT instrument is known to have a low bias on wind speed measurements near gale force and greater (Reference 4) and is not able to fully sample the narrow Gulf. Figure 6
The remainder of the non-tropical cyclone warning events pertains to the Gulf of Tehuantepec region. The first gap wind event to reach storm force began at 1800 UTC 13 October. Figure 7 shows the ASCAT pass from 0407 UTC on 14 October 2010. Winds in the 30 to 40 kts range were observed in the Gulf of Tehuantepec by this scatterometer pass. Winds reached storm force in the Gulf of Tehuantepec by 0000 UTC 14 October, with storm force conditions lasting 48 hours, the longest duration of any storm force event for the September to December period of 2010. Ship observations from the Norwegian Star (C6FR3), the Sea Princess (ZCBU3), the Leverkusan Express (DEHY), and the Coral Princess (ZCDF4) were vital for monitoring the event. The Norwegian Star (C6FR3) reported a north wind of 52 kts at 0100 UTC on 14 October 2010 near 15N95W with maximum seas of 5.7 m (19 ft). Likewise, the Coral Princess (ZCDF4) reported a north wind of 50 kts between 0300 and 0700 UTC in the vicinity of 16N94W and maximum seas of 5.4 m (18 ft). Winds in the region gradually tapered off after 0000 UTC on 17 October when the gale warning ended.
The longest non-tropical cyclone warning period in the eastern North Pacific began at 0600 UTC 04 November and lasted four and a half days. While this gale period began with the passage of a weak cold front through western Gulf of Mexico and the Isthmus of Tehuantepec, it lasted longer than average due to a complex area of low pressure over the northern Gulf of Mexico and an associated reinforcing cold frontal passage through the Isthmus of Tehuantepec early on 05 November 2010. Figure 8 shows the 0600 UTC 04 November, 1200 UTC 04 November, and 0600 UTC 05 November NWS Unified Surface Analyses indicating passage of the first weaker cold front and further development of the low pressure area over the Gulf of Mexico that quickly raced east-northeastward.
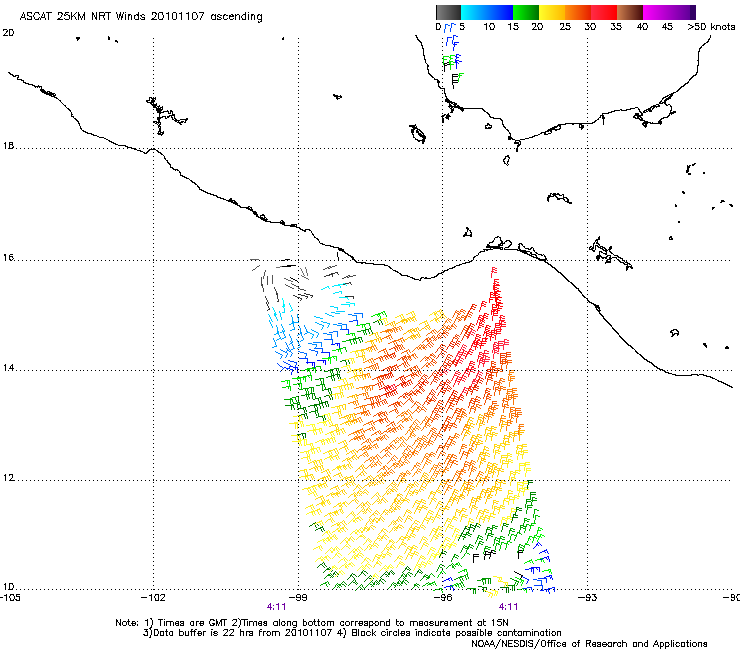
Figure 9. Ocean vector wind retrievals from the ASCAT pass on 0411 UTC 07 November 2010. Note the area of winds to gale force extending south-southwest from the Gulf of Tehuantepec.
The strong reinforcing cold front brought 12 hours of storm force conditions to the Gulf of Tehuantepec region beginning 1200 UTC 05 November. Three ships, the Dresden Express (DHDE), the CCNI Rimac (DPTS), and the Conti Salome (A8LL8), participating in the World Meteorological Organizations (WMO) Voluntary Ship Observing Program (VOS) reported winds above gale force during the event. Maximum seas reported by the CCNI Rimac (DPTS), at 1700 UTC on 06 November 2010 near 14N97W reached 5.0 m (16 ft). Also the Conti Salome (A8LL8) reported maximum seas of 6.4 m (21 ft) near 14N96W at 0300 UTC 08 November 2010. The ASCAT pass from 07 November 2010 in Figure 9 continued to show winds above 34 kts extending well south-southwest of the Gulf of Tehuantepec. Gale force conditions ended after 1800 UTC 08 November 2010 as the pressure gradient relaxed over southern Mexico and much of the Gulf of Mexico.
The final storm force event in the Gulf of Tehuantepec in 2010 began at 1800 UTC on 12 December. One observing ship, the Norwegian Star (C6FR3), reported winds of 55 kts during the event as noted on the NWS Unified Surface Analysis from 0600 UTC 13 December 2010 seen in Figure 10
A strong cold front moved southeastward across southern Mexico and the Yucatan Peninsula, fracturing as northerly winds rushed through the isthmus and drained into the Gulf of Tehuantepec. Figure 11 highlights ocean wind vector retrievals from the ASCAT instrument on 1537 UTC 14 December 2010 shortly before the gale warning was lifted. Note the veering winds across the southwestern Gulf of Mexico, indicating the wind field passing through the Chivela Pass into the Gulf of Tehuantepec from the north would continue to diminish in magnitude.
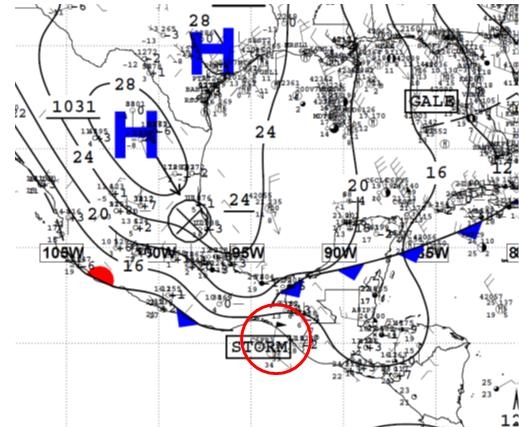
Figure 10. The National Weather Service Unified Surface Analyses at 0600 UTC 13 December 2010. Note the fractured cold front across southern Mexico due to storm force winds rushing through the Chivela Pass and into Gulf of Tehuantepec with ship observation of 50 KT circled in red near 15N94W.
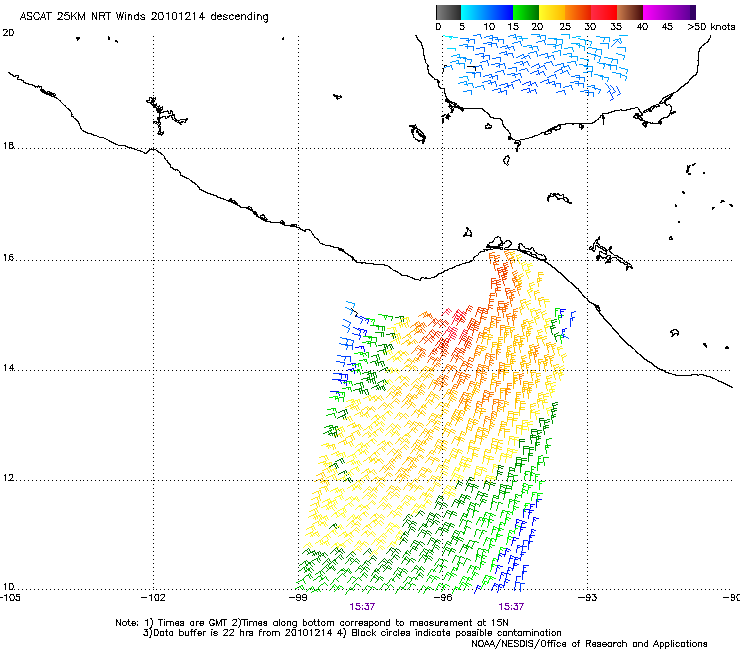
Figure 11. Ocean vector wind retrievals from the ASCAT pass on 1537 UTC 14 December 2010. Near the end of the event, north to northeast winds were beginning to diminish below gale force as winds over the southwest Gulf of Mexico veered east and southeast.
References
- Bell. G. et al, The 2010 North Atlantic Hurricane Season A Climate Perspective (2011).
http://www.cpc.ncep.noaa.gov/products/expert_assessment/hurrsummary_2010.pdf
- Brennen, Michael J. ed. Tropical Cyclone Report Tropical Storm Georgette (2010)
http://www.nhc.noaa.gov/pdf/TCR-EP122010_Georgette.pdf
- Cohen, Ariel E. and Cangialosi, John P., 2010: An Observational and High-Resolution Model Analysis of Gale Wind Events in the Gulf of California. Wea. Forecasting, 25, 613-626.
- Brennen, Michael J., Cobb III, Hugh D., and Knabb, Richard D., 2009: Observations of Gulf of Tehuantepec Gap Wind Events from QuikSCAT: An Updated Event Climatology and Operational Model Evaluation. Wea. Forecasting, 25, 646-658.