Operational Formulas for Estimating Wind and Waves During a Hurricane
Professor S. A. Hsu, Louisiana State University, email: sahsu@lsu.eduIn the December 2006 issue of this journal Hsu (2006a and b) proposed several formulas for operational use, Eqs.(1) through (5) as follows:
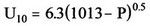 (1)
(1) (2)
(2) (3)
(3)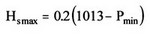 (4)
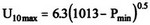
(4)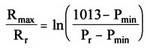 (5)
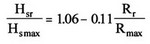
(5)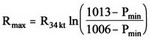 (6)
(6)In April 2007, Powell and Reinhold (2007) published their paper which presented a list of 19 hurricanes with four major parameters including the radius of maximum wind (Rmax), minimum sea-level pressure (Pmin), maximum sustained wind (Vmax = U10 max) and the distance from the eye where 34 kts (or 17 m/s) winds were located (R34 kts). These parameters are listed here in Table 1. Using this information, Eqs.(2) and (5) may be further validated.
First, to verify Eq.(2), we divide the left hand side by the argument containing Pmin on the right. The ratio (A) should be around 6.3 if it is to be acceptable. From Table 1, this value is found. Thus we can say that Eq.(2) is further verified.
Now, to verify Eq.(5), we need to get Pr and Rr which are the pressure and corresponding distance at r. Since a tropical storm begins at 34 kts or 17 m/s, we substitute U10 = 17 m/s into Eq.(1) and get Pr = 1006 hPa. Then we substitute Rr = R34 kts and Pr = 1006 hPa into Eq.(5). Using the dataset provided in Table 1, the ratio (B) of the argument on the left hand side and that on the right should be approximately one if Eq.(5) is operationally useful. It can be seen that B = 1.0. For operational applications, Eq.(5) is converted to Eq.(6). Since R34 kts and Pmin are both available from the Tropical Cyclone Advisories issued by the National Hurricane Center or Joint Typhoon Warning Center, the wave height at any distance r from the eye can be estimated using Eq.(3) with the input of Eqs.(4) and (6).
References
Hsu, S. A., (2006a), Nowcasting the significant wave height during a hurricane. Mariners Weather Log, 50(3), December 2006, pp. 6-7.
Hsu, S. A., (2006b), Estimating the wind speed during a hurricane at sea, Mariners Weather Log, 50(3), December 2006, pp. 8-9.
Powell, M. D. and Reinhold, T. A., 2007, Tropical cyclone destructive potential by integrated kinetic energy, Bulletin American Meteorological Society, 88(4), April 2007, pp. 513-526.
Table 1. Validations of Eqs. (2) and (5) based on data provided in Powell and Reinhold (2007).
| Storm | Year | Month | Time | Rmax | Pmin | Vmax | R34 kt | A | B |
|---|---|---|---|---|---|---|---|---|---|
| Day | UTC | (km) | (hPa) | (m/s) | (km) | Eq.2 | Eq.5 | ||
| Andrew | 1992 | 24-Aug | 900 | 19 | 922 | 68 | 191 | 7.1 | 1.2 |
| Camille | 1969 | 18-Aug | 430 | 15 | 909 | 65 | 230 | 6.4 | 0.9 |
| Charley | 2004 | 13-Aug | 1930 | 7 | 941 | 63 | 156 | 7.4 | 0.4 |
| Dennis | 2005 | 10-Jul | 1930 | 9 | 946 | 51 | 296 | 6.2 | 0.3 |
| Emily | 2005 | 20-Jul | 130 | 24 | 948 | 54 | 291 | 6.7 | 0.7 |
| Fabian | 2003 | 5-Sep | 1330 | 67 | 941 | 51 | 380 | 6 | 1.7 |
| Frances | 2004 | 5-Sep | 130 | 52 | 960 | 46 | 319 | 6.3 | 1.2 |
| Hugo | 1989 | 22-Sep | 400 | 37 | 934 | 58 | 317 | 6.5 | 1.3 |
| Iris | 2001 | 9-Oct | 130 | 8 | 948 | 43 | 165 | 5.3 | 0.4 |
| Isabel | 2003 | 18-Sep | 1630 | 87 | 957 | 47 | 532 | 6.3 | 1.2 |
| Ivan (AL) | 2004 | 16-Sep | 730 | 35 | 946 | 49 | 326 | 6 | 1 |
| Ivan (Jamaica) | 2004 | 11-Sep | 1330 | 17 | 925 | 70 | 314 | 7.5 | 0.7 |
| Jeanne | 2004 | 26-Sep | 330 | 48 | 950 | 46 | 317 | 5.8 | 1.3 |
| Katrina (FL) | 2005 | 25-Aug | 2230 | 15 | 984 | 33 | 115 | 6.1 | 0.5 |
| Katrina (LA) | 2005 | 29-Aug | 1200 | 65 | 920 | 52 | 454 | 5.4 | 1.8 |
| Katrina Peak Wind | 2005 | 28-Aug | 1200 | 26 | 909 | 71 | 349 | 7 | 1.1 |
| Keith (Belize) | 2000 | 1-Oct | 2230 | 19 | 959 | 50 | 154 | 6.8 | 0.9 |
| Michelle | 2001 | 4-Nov | 1930 | 28 | 949 | 50 | 335 | 6.3 | 0.7 |
| Opal | 1995 | 4-Oct | 2235 | 98 | 942 | 50 | 353 | 5.9 | 2.7 |
| Rita | 2005 | 24-Sep | 730 | 30 | 937 | 49 | 357 | 5.6 | 0.9 |
| Wilma Peak Wind | 2005 | 19-Oct | 1930 | 7 | 892 | 62 | 326 | 5.6 | 0.4 |
| Wilma (FL) | 2005 | 24-Oct | 1030 | 72 | 951 | 51 | 380 | 6.5 | 1.6 |
| Wilma (Mexico) | 2005 | 22-Oct | 130 | 20 | 930 | 59 | 394 | 6.5 | 0.6 |
| Mean | 6.3 | 1.0 | |||||||
| Standard Deviation | 0.59 | 0.56 | |||||||