Marine Weather ReviewNorth Pacific Area
September through December 2007
By George P. Bancroft, NOAA National Center for Environmental Prediction
Introduction
The weather pattern over the North Pacific became increasingly active as the four-month period progressed, with storm tracks initially in September to early October running northeast or east into the Bering Sea more typical of late summer or early fall. From October on, cyclones progressed from southwest to northeast with some entering the Bering Sea, depending on the strength of the eastern Pacific high pressure area. Most of the hurricane-force systems were in the central and northeastern Pacific waters from October on. Their numbers ranged from one in September (in the northwest Pacific) to three in October, five in November and eleven in a very busy December. Two of these, in late October and early in December, had tropical origins.
Tropical activity in the western Pacific was concentrated in the month of September and October, during which four named tropical cyclones appeared on Ocean Prediction Centers (OPCs) oceanic analysis east of 130E during each of those months. Three of these became typhoons. One of these, Faxai in late October, redeveloped as a powerful extratropical storm. The cyclones tracked in the direction of Japan and either recurved near or southeast of Japan or moved west of 130E while staying south of Japan. Two weak cyclones formed in November south of Japan and remained tropical no more than two days each, with the second occurring in late November remaining a depression, not strong enough to be named.
Tropical Activity
Typhoon Fitow: Fitow, originating August 18 well southeast of Japan (Reference 1) continued on into September as a typhoon, centered 700 nmi southeast of Tokyo by early on September 1 with maximum sustained winds 70 kts with gusts to 85 kts. Fitow moved northwest and attained a maximum intensity of 85 kts with gusts to 105 kts at 0600 UTC on the 6th with the center near 33N 138E. The ship Nippon Maru (JFMC) reported south winds of 40 kts near 32N 142E at that time. The cyclone then moved to near Tokyo as a minimal typhoon (65 kts sustained with gusts to 80 kts) at 1800 UTC that day. Fitow continued to weaken while turning northeast, becoming an extratropical gale near 41N 141W at 1200 UTC on the 7th. The ship APL Peru (V2OE2) (35N 141E) reported southwest winds of 40 kts six hours prior to this. The remains of Fitow then reintensified to a storm as it moved into the Bering Sea early on the 10th with the central pressure down to 967 hPa late on the 10th in the central Bering Sea. A vessel with the SHIP identifier (60N 172W) reported east winds of 50 kts at 0000 UTC on the 11th. The ship Star Gran (LADR4) (54N 165W) reported southeast winds of 45 kts and 6.5 m seas (21 ft) at that time. The cyclone then began a weakening trend the next day while moving northeast.
Tropical Storm Danas: Danas originated from a non-tropical low near 26N 157E late on September 6 and was named as a tropical storm early on the 7th. Danas tracked northwest over the next three days while slowly intensifying, becoming a strong tropical storm near 39N 152E early on the 10th with maximum sustained winds of 60 kts with gusts to 75 kts. The ship MOL Sunrise (A8JK4) (39N 150E) reported southeast winds of 40 kts and 5.5 m seas (18 ft) at 1800 UTC on the 9th. The cyclone then turned northeast and became extratropical, weakening to a gale late on the 11th while passing well south of the western Aleutians. Reintensification to a stormforce low occurred, briefly, as the cyclone moved into the Gulf of Alaska late on the 14th, followed by an eastward drift and dissipation over Southeast Alaska on the 16th.
Typhoon Nari: Tropical Depression 12W formed 700 nmi south of Japan September 12 and moved northwest while rapidly intensifying to a typhoon in a twenty-four hour period. At 1800 UTC on the 13th Typhoon Nari was near 24N 130E with maximum sustained winds 65 kts with gusts to 80 kts. Nari then passed west of OPCs surface map area later that day.
Tropical Storm Wipha: Tropical Depression 13W formed near 20N 133E at 0600 UTC September 15 and drifted west, intensifying to a tropical storm with maximum sustained winds 45 kts with gusts to 55 kts by 0600 UTC on the 16th. The cyclone then passed west of OPCs map area on the 16th.
Tropical Storm Haiyan: Tropical Storm Haiyan formed from a non-tropical low near 29N 171E late on October 5 and moved north, with maximum sustained winds 40 kts with gusts to 50 kts. Eighteen hours later Haiyan weakened to a tropical depression near 32N 170E with sustained winds 25 kts and gusts to 35 kts. Haiyan became extratropical by 0000 UTC on the 7th.
Tropical Storm Lingling: Lingling formed as a tropical storm from a nontropical low near 25N 173E at 0600 UTC October 12 with maximum sustained winds 40 kts with gusts to 50 kts, and moved northwest, maintaining its strength for the next twenty-four hours. The cyclone then weakened to a depression on the 13th before becoming an extratropical gale center on a front near 34N 173E at 1800 UTC on the 14th. The remains of Lingling then moved northeast, re-intensifying as a storm-force low in the U.S. Pacific Northwest offshore waters early on October 18 with a central pressure down to 984 hPa. The ship Liberty Wave (KRHZ) (42N 125W) reported a south wind of 50 kts at 1200 UTC on the 18th. The cyclone weakened inland later that day.
Typhoon Kajiki: Tropical Depression 19W formed from a non-tropical low near 20N 144E late on October 18 and moved northwest while rapidly intensifying. It became Tropical Storm Kajiki six hours later with maximum sustained winds 55 kts with gusts to 70 kts. At 1800 UTC on the 19th Kajiki became a typhoon near 21N 141E and turned north while continuing to strengthen. The cyclone reached maximum intensity twenty-four hours later near 26N 142E with maximum sustained winds of 110 kts with gusts to 130 kts. This made it a major typhoon at Category 3 on the Saffir- Simpson scale of intensity (Reference 3), and the strongest western Pacific tropical cyclone of the period to appear on OPCs surface analysis charts. Weakening followed as Kajiki accelerated toward the northeast, and became an extratropical storm-force low at 1800 UTC on the 21st near 34N 154E, and a gale-force low at 1800 UTC on the 23rd near 40N 174W. The remains of Kajiki later re-intensified to a storm south of the eastern Aleutians near 50N late on October 24, with the vessel CSCL Los Angeles (A8AX8) (42N 159W) reporting a south wind of 50 kts at 0000 UTC on the 25th. The cyclone then became absorbed by a larger Bering Sea system late on the 25th.
Tropical Storm Faxai: Tropical Depression 20W formed 600 nmi south of Japan late on October 25 and moved northeast, becoming Tropical Storm Faxai 29N 136E at 0000 UTC on October 27 with maximum sustained winds 50 kts with gusts to 60 kts. The Nikkei Tiger (3FMH7) near 31N 139E reported south winds of 40 kts at that time, followed six hours later by a report of southwest winds of 50 kts near 31N 139E. The second part of Figure 1 shows extratropical Faxai at maximum strength as far as winds are concerned. Figure 2 is a high-resolution QuikSCAT image of satellite-derived winds around the storm. The east winds appearing on the north side of the storm may be unreliable due to the wind directions being off and possible contamination. However, the northwest winds up to 70 kts appearing west of the center on the lower left side of the image look reasonable. The cyclone then underwent some weakening on the 28th with hurricane-force winds lasting until 1800 UTC on the 28th. The ship Westwood Ranier (C6SI3) (44N 157E) reported northeast winds of 50 kts at 1200 UTC October 28. The cyclone later passed just south of the eastern Aleutians on the 29th and began to re-intensify while maintaining storm-force winds through the 30th, with the central pressure bottoming out at 957 hPa at 1800 UTC October 30 when the center was at 59N 150W. The ship OOCL Los Angeles (DBUQ) (55N 156W) encountered northwest winds of 60 kts at 0600 UTC on the 30th. The cyclone then weakened inland over Alaska by the end of the month.
Tropical Storm Tapah: Tropical Depression 22W formed from a non-tropical low early on November 11 near 20N 140E and drifted northeast, briefly strengthening into Tropical Storm Tapah early on November 12 near 23N 143E with maximum sustained winds 35 kts with gusts to 45 kts, before weakening and merging with a frontal zone late on the 12th.
Tropical Depression 25W: This cyclone formed near 25N 132E at 1800 UTC November 27 and moved northeast 23 kts, with maximum sustained winds 25 kts with gusts to 35 kts. This system became extratropical near 29N 140E late on November 28 with gales north of the center due to strong high pressure to the north of the cyclone.
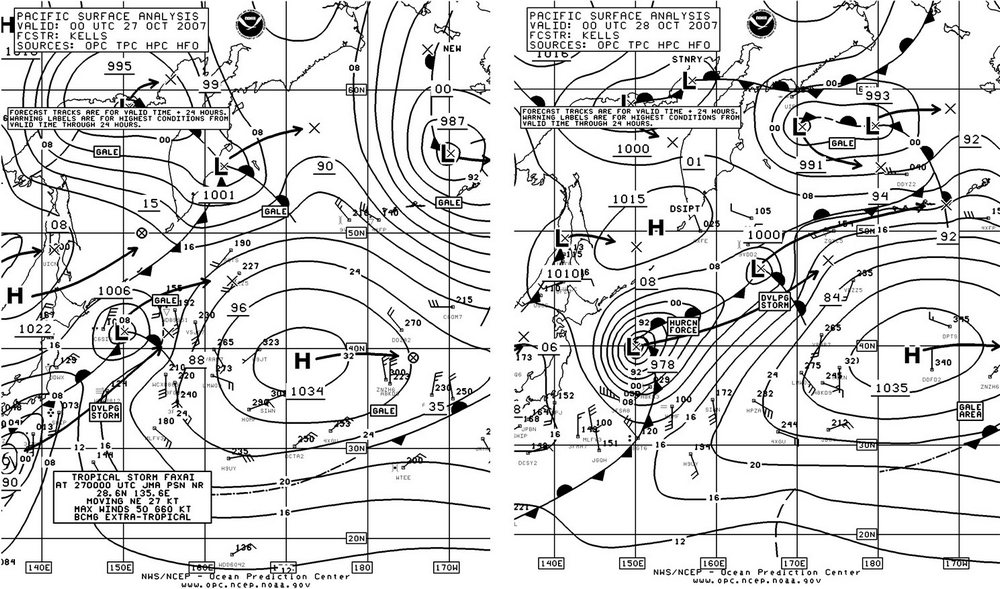
Figure 1. OPC North Pacific Surface Analysis charts (Part 2 - west) valid 0000 UTC October 27 and 28, 2007, showing
Tropical Storm Faxai becoming extratropical. The arrows are 24-hour forecast tracks of surface pressure centers to the
24-hour forecast positions with forecast pressures given with the last two whole digits in millibars.
(Click to enlarge)
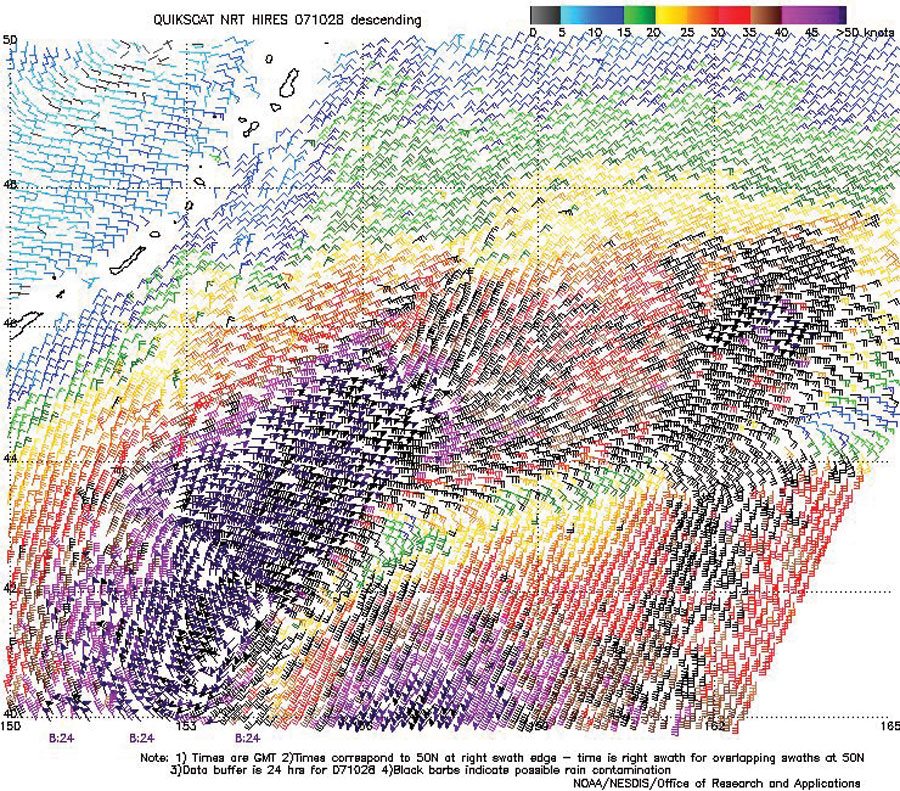
Figure 2. High-resolution QuikScat
scatterometer image of satellite-sensed winds around extratropical hurricane-
force low, former Tropical Storm Faxai, shown in Figure 1. The resolution is
12.5 km, versus 25 km in the coarser-resolution version of QuikScat imagery.
The valid time of the pass is 0824 UTC October 28, 2007, or more than eight
hours later than the valid time of the second part of Figure 1
Image is
courtesy of NOAA/NESDIS/ Office of Research and Applications
(Click to enlarge)
Other Significant Events
Northwest Pacific Storm, September 2123: This complex development initially consisted of a western center in the Sea of Okhotsk dropping southeast and developing hurricaneforce winds behind it while a second center moved northeast from the kurile islands while rapidly intsnsifying (Figure 3). The first storm center briefly developed hurricane-force winds to 70 kts southwest of the center as it dropped southeast (Figure 4), developing a central pressure of 981 hPa (53N 155E) by 1200 UTC on the 22nd , when OPC briefly labeled it as a hurricane-force low. This was the first cyclone of non-tropical origin to develop hurricane-force winds during this period. The central pressure of the eastern center dropped an impressive 31 hPa during the twenty-four hour period covered by Figure 3. The Arctic Sun (ELQB8) near 49N 156E, south of the western storm center, reported west winds of 50 kts at 1900 UTC on the 22nd and again four hours later near 49N 158E. A ship reporting with the SHIP identifier (46N 160E) encountered west winds 35 kts and 8.0 m seas (26 ft) at 2100 UTC on the 22nd. The Polar Eagle (ELPT3) reported southeast of the second storm center (53N 177E) with a southwest wind of 50 kts at 0900 UTC September 23. Three hours prior to this, the same ship reported 8.0 m seas. The second storm center developed a lowest central pressure of 961 hPa at that time, near 55N 171E. The two centers then combined to form a large gale in the central Bering Sea by the 24th while moving northeast with gradual weakening, and then contined to drift east through the remainder of September before re-forming in the Gulf of Alaska October and drifting east.
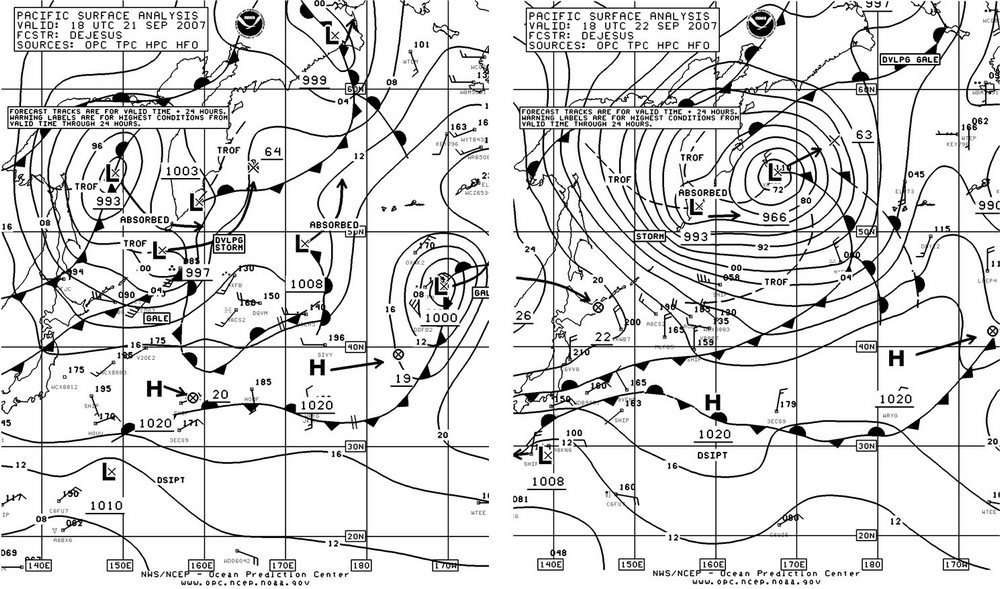
Figure 3. OPC North Pacific Surface Analysis charts (Part 2) valid 1800 UTC September 21 and 22, 2007.
(Click to enlarge)
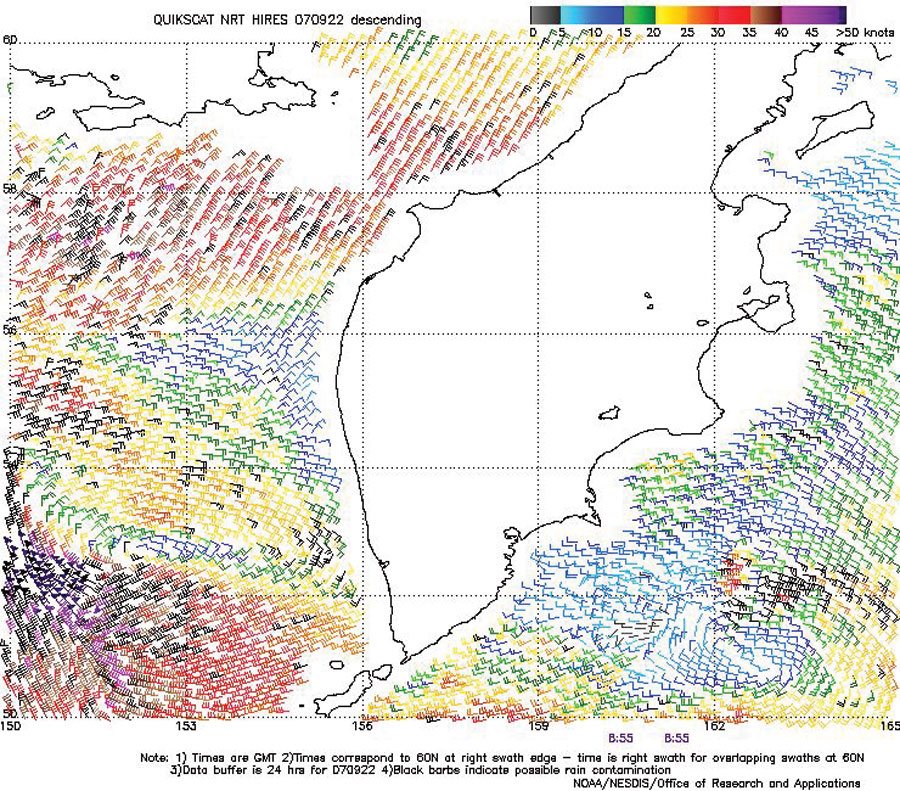
Figure 4. High-resolution QuikScat
scatterometer image of satellite-sensed winds around the storm shown in the
second part of Figure 3. The valid time of the pass is 0855 UTC September 22,
2007, or about nine hours prior to the valid time of the second part of Figure
3.
Image is courtesy of NOAA/NESDIS/ Office of Research and Applications.
(Click to enlarge)
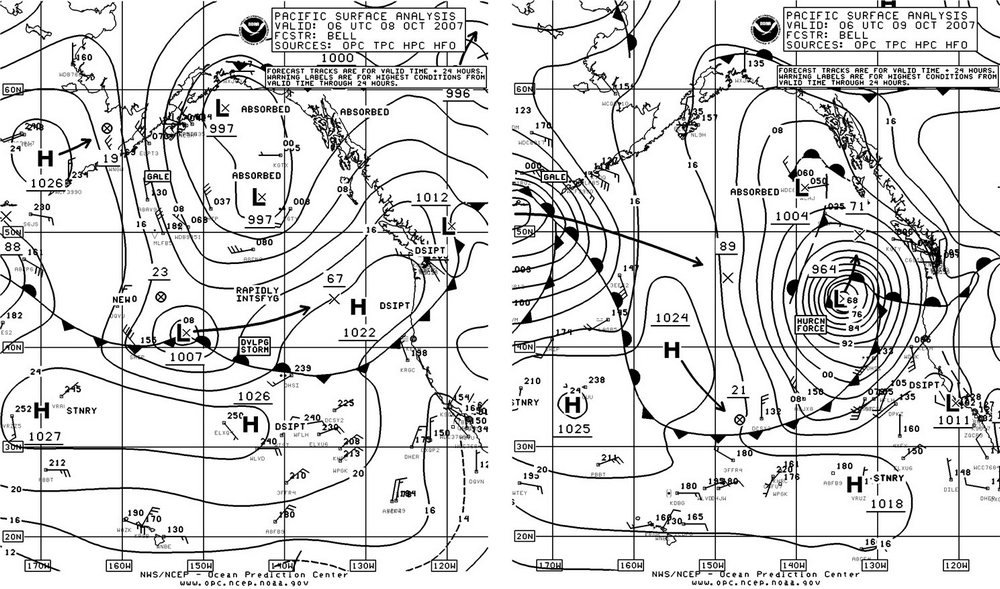
Figure 5. OPC North Pacific Surface Analysis charts (Part 1 - east) valid 0600 UTC October 8 and 9, 2007.
Eastern North Pacific Storm, October 810: The next significant storm developed well to the east as shown in Figure 5, with the explosive deepening of a frontal wave of low pressure. The central pressure fell 43 hPa during the twenty- four hour period of Figure 5, by far the highest rate of intensification of a non-tropical low of the period in the North Pacific. The second part of Figure 5 shows the cyclone at high-resolution scatterometer image in Figure 6 reveals hurricane-force winds up to 75 kts around the center except on the northeast side. Table 1 contains selected ship, buoy and coastal automated station reports taken during the storm. The cyclone subsequently weakened, becoming a gale near the Queen Charlotte Islands early on the 10th before passing inland over Southeast Alaska late on the 10th.
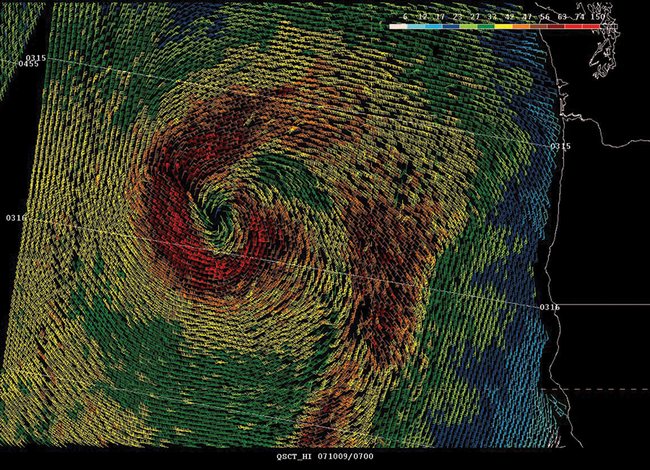
Figure 6. High-resolution QuikScat scatterometer image of satellite-sensed winds around the storm
depicted in the second part of Figure 5. In this version of the imagery adapted to OPC operational use,
the numbered diagonal lines are time lines denoting the satellite track. The resolution is 12.5 km, versus
25 km in the coarser-resolution version of QuikScat imagery. The valid time of the pass is about 0316
UTC October 9, 2007, or almost three hours prior to the valid time of the second part of Figure 5.
Image is courtesy of NOAA/NESDIS/ Office of Research and Applications.
| OBSERVATION | POSITION | DATE/TIME(UTC) | WIND | SEAS(m/ft) | |
|---|---|---|---|---|---|
| SHIP | 51N 130W | 10/0000 | SE 55 | 9.0/30 | |
| Zim U.S.A. (4XFO) | 49N 137W | 10/0000 | NW 50 | 6.0/19 | |
| SHIP | 51N 129W | 10/0600 | SE 60 | ||
| North Star (KIYI) | 49N 129W | 10/0900 | SW 45 | 10.0/33 | |
| Buoy 46006 | 40.9N 137.5W | 08/1900 | SW 41 | G52 Peak 62 | |
| 09/1100 | maximum | 8.5/ 28 | |||
| Buoy 46036 | 48.4N 133.9W | 09/1100 | NE 39 G51 | ||
| 09/1500 | maximum | 7.5/25 | |||
| Buoy 46005 | 46N 131W | 09/1300 | S 47 G60 | 11.0/36 | |
| 09/1200 | Peak gust 62 | ||||
| 09/1400 | maximum | 12.0/39 | |||
| Buoy 46002 | 42.6N 130.5W | 09/0300 | S 39 G47 Peak 54 | 6.0/20 | |
| 09/0500 | maximum | 7.5/25 | |||
| Buoy 46050 | 44.6N 124.5W | 09/1900 | SE 35 G41 Peak 43 | 5.0/16 | |
| 09/2100 | maximum | 6.5/21 | |||
| Buoy 46089 | 45.9N 125.8W | 09/1700 | SE 39 G51 | 6.5/21 | |
| 09/1900 | maximum | 7.5/25 | |||
| Buoy 46204 | 51.4N 128.8W | 10/1200 | SW 29 G37 5 | 6.0/20 | |
| 10/0500 | maximum | 6.5/21 | |||
| Buoy 46207 | 50.9N 129.9W | 10/0400 | SE 41 | G52 8.5/28 | |
| 10/0600 | maximum | 9.5/31 | |||
| Buoy 46183 | 53.6N 131.1W | 10/1200 | SE 45 G56 | 6.0/20 | |
| 10/1700 | maximum | 7.0/23 | |||
| Destruction Island | 47.7N 124.4W | 10/0100 | SE 37 G42 Peak 52 | ||
Table 1. Ship, buoy and coastal automated station observations taken during the passage of the storm of October 8-10 in the eastern North Pacific.
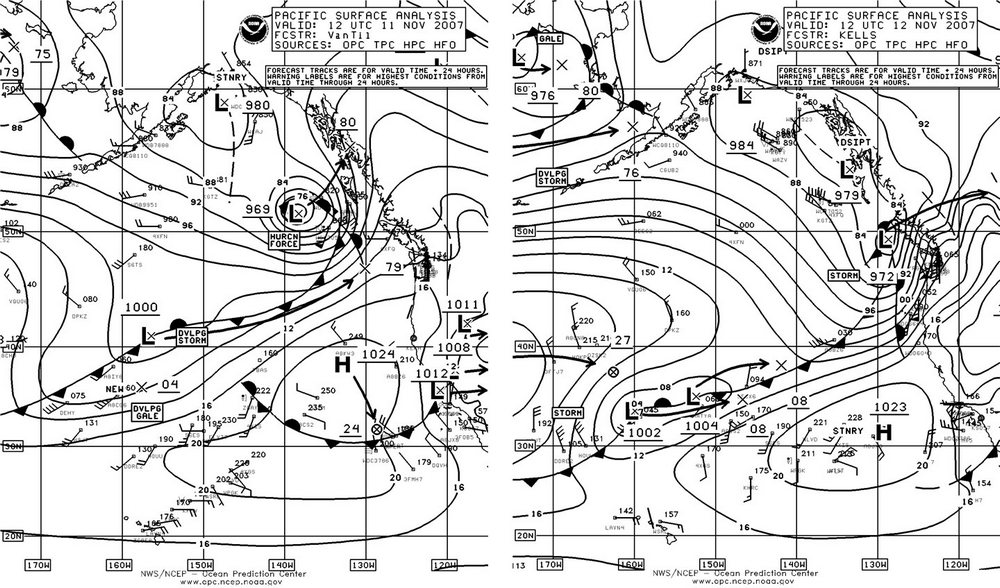
Figure 7. OPC North Pacific Surface Analysis charts (Part 1) valid 1200 UTC November 11 and 12, 2007.
(Click to enlarge)
North Pacific Storm, October 1719: This developing storm tracked east near 49N south of the Aleutians from October 15 to 17, briefly developing hurricane-force winds with a 977 hPa center near 49N 154W at 0600 UTC October 18. The cyclone then began to weaken and turned southeast late on the 19th, and dissipated near Vancouver Island on the 20th.
Eastern North Pacific Storms of November 1012: Two cyclones formed and moved northeast off the coast of Washington, Oregon and Vancouver Island during this period as depicted in Figure 7. The stronger initial storm which originated from a frontal wave of low pressure in the central North Pacific two days earlier is shown in the first part of Figure 7 near maximum intensity. The central pressure fell 26 hPa in the twenty-four hour period ending at 1200 UTC on the 11th. At this time the ship Seabulk Pride (WCY7052) (50N 135W) reported southwest winds of 70 kts. The second part of Figure 7 shows the second storm following close behind while the first low dissipated near the Queen Charlotte Islands, after having originated from the frontal wave of low pressure near 41N 157W twenty-four hours prior. This second storm moves inland shortly thereafter. Other ship reports along with some buoy and coastal station observations taken during these storms are listed in Table 2.
| OBSERVATION | POSITION | DATE/TIME(UTC) | WIND | SEAS(m/ft) |
|---|---|---|---|---|
| Polar Resolution (WDJK) | 53N 136W | 11/1200 | SE 50 | |
| Name unknown (WCY7052) | 51N 135W | 11/1800 | W 60 | 9.0/30 |
| Name unknown (C6JK) | 53N 136W | 11/2000 | SE 45 | |
| Zim China (4XFQ) | 51N 131W | 12/0000 | SW 50 | 10.0/33 |
| Sea Land Enterprise (KRGB) | 48N 125W | 12/1100 | SE 50 | |
| 48N 125.5W | 12/1200 | SE 55 | ||
| Manoa (KDBG) | 44N 125W | 12/1200 | S 60 | 6.5/21 |
| Buoy 46004 | 50.9N 136.2W | 11/0900 | SE 40 | 4.5/14 |
| 11/1600 W 50 | 7.5/24 | |||
| Buoy 46036 | 48.4N 133.8W | 11/1700 | SW 50 | 7.5/25 |
| Buoy 46005 | 46.0N 131.0W | 12/0900 | SW 35 | 8.0/26 |
| Buoy 46089 | 45.9N 125.8W | 12/1100 | SE 35 | 7.5/25 |
| 12/1400 | S 40 | 9.5/31 | ||
| Buoy 46002 | 42.6N 130.5W | 12/1100 | SW 35 | 7.5/24 |
| Buoy 46050 | 44.6N 124.5W | 12/2000 | S 35 | 10.0/32 |
| Buoy 46041 | 47.3N 124.7W | 12/1600 | S 35 | 8.5/28 |
| Buoy 46029 | 46.1N 124.5W | 12/1800 | S 35 | 9.0/29 |
| Buoy 46206 | 48.8N 126.0W | 12/1600 | SW 30 | 9.0/29 |
| Destruction Island | 47.7N 124.4W | 12/1600 | S 60 | |
| Tatoosh Island | 48.4N 124.7W | 12/1600 | S 50 |
Table 2. Ship, buoy and coastal automated station observations taken during the passage of the two cyclones of November 1012 in the eastern North Pacific.
Eastern North Pacific Storm, November 1417: This cyclone originated from an elongated storm system in the central waters in the vicinity of 43N on the 14th. One cyclone broke off from the complex and headed northeast while rapidly intensifying as depicted in Figure 8. The central pressure dropped to as low as 950 hPa six hours later at 0600 UTC on the 16th as the storm turned northward, making it the second deepest North Pacific cyclone of the period. A high-resolution scatterometer pass from 1518 UTC on the 15th revealed a small area near 48N 142W with 50 to 70 kts, less than nine hours before the valid time of the second part of Figure 8. At 0000 UTC on the 15th the ship Sea-Land Comet (WDB9950) (43N 147W) reported southwest winds of 55 kts. At 0000 UTC on the 16th the vessel Polar Resolution (WDJK) (51N 139W) also encountered southwest winds of 55 kts. Jason satellite altimetry (Figure 9) provided significant wave heights along a swath cutting through the south side of the storm in the second part of Figure 8, several hours later than the time of the second part of Figure 8. The maximum sea height along the swath appears to be 38 ft (11.5 m) near 49N 140W. The cyclone subsequently drifted northwest on the 16th and weakened to a gale on the 17th in the Gulf of Alaska, and then dissipated on the 19th.
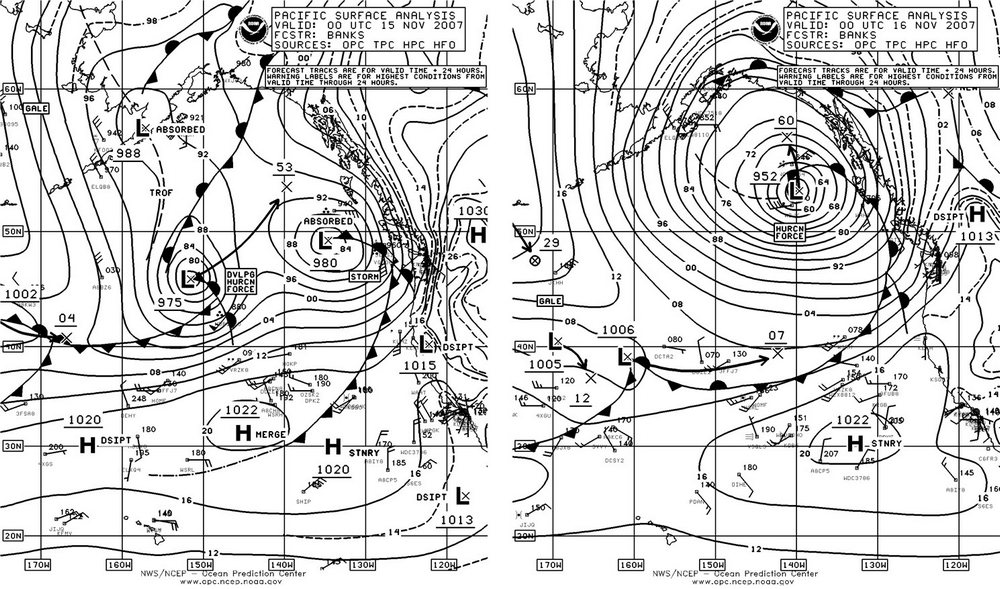
Figure 8. OPC North Pacific Surface Analysis charts (Part 1) valid
0000 UTC November 15 and 16, 2007.
(Click to enlarge)
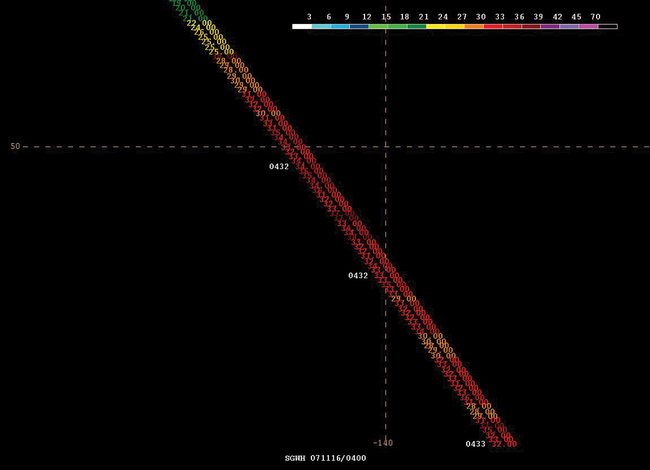
Figure 9. Jason satellite altimeter pass through the south side of the storm shown in the second part of Figure 8. The satellite track runs from northwest to southeast and the numbers along the track are remotely sensed significant wave height in feet, the highest value 38 ft (11.5 m) near the center of the image. The time of the pass is 0432 UTC November 16, 2007 taken from the widely scattered four-digit times given to the left of the track.
North Pacific Storm, November 1721: The initial development of this major storm over the southern waters over a thirty-six hour period is shown in Figure 10. In the initial rapid intensification of this cyclone the central pressure dropped 23 hPa in the twenty-four hour period ending at 1200 UTC November 18, and hurricane- force winds developed by this time. A QuikSCAT scatterometer image from near the valid time of the second part of Figure 10 (Figure 11) reveals winds of 50 to 75 kts southwest and west of the welldefined storm center with even an 80 kts wind barb. The newly-developed cyclone was rather compact at this time and far south over relatively warm waters, so the author believes that the winds were strongest near this time. The cyclone then continues to track toward the northeast and intensify, though not as quickly as before, and developed a lowest central pressure of 966 hPa at 0600 UTC on the 20th when the center was at 49N 155W. Hurricane-force winds with this system lasted until this time, for almost forty-eight hours, which is unusually long. At 1200 UTC on the 18th, the ship Hanjin Miami (DDZE2) (40N 179W) reported a northwest wind of 55 kts, and later at 0000 UTC on the 20th another ship, APL Coral (S6JS) encountered the same conditions near 51N 161W. The cyclone then moved to near 49N 155W 0600 UTC on the 20th with a lowest central pressure of 966 hPa, and then turned north and weakened, followed by dissipation over southwest Alaska early on the 21st.
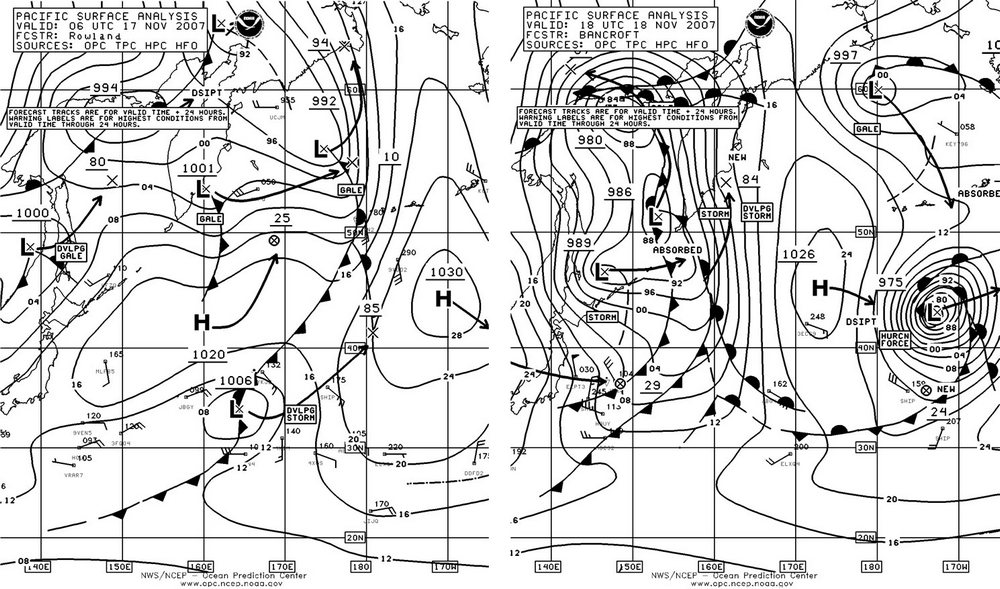
Figure 10. OPC North Pacific Surface Analysis charts (Part 2) valid 0600 UTC November 17
and 1800 UTC November 18, 2007.
(Click to enlarge)
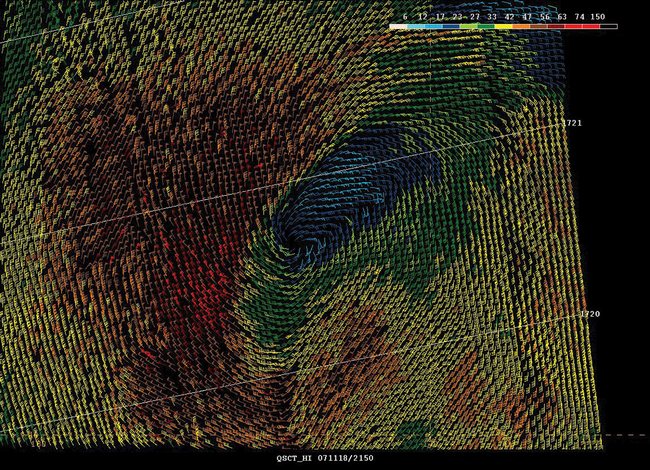
Figure 11. High-resolution QuikScat scatterometer image of satellite-sensed winds around the storm
shown in the second part of Figure 10. In this version of the imagery adapted for OPC use, diagonal
cross-track time lines are included. The valid time of the pass is about 1721 UTC November 18, 2007,
or less than one hour prior to the valid time of the second part of Figure 10.
Image is courtesy of NOAA/NESDIS/ Office of Research and Applications.
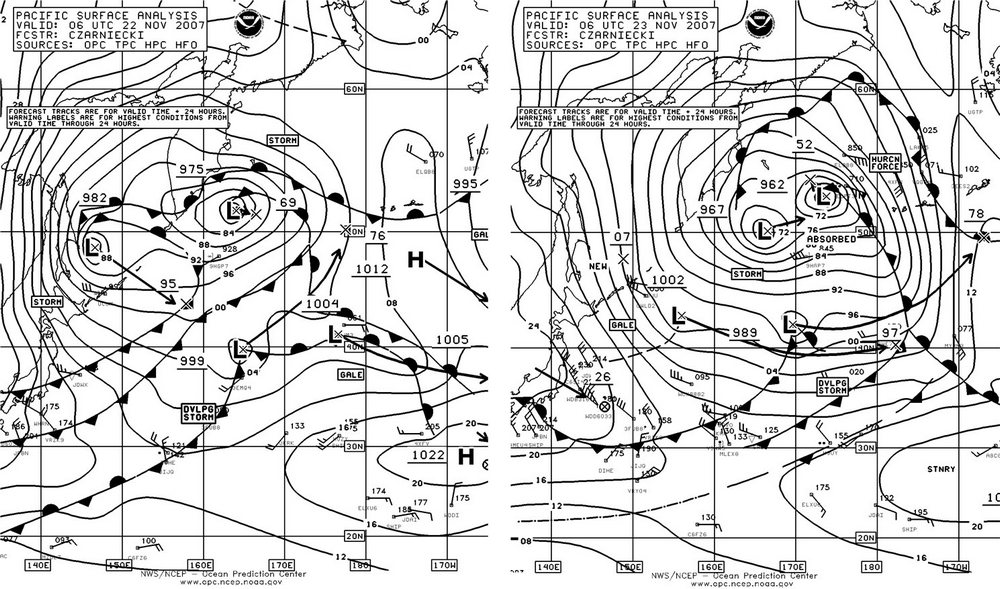
Figure 12. OPC North Pacific Surface Analysis charts (Part
2) valid 0600 UTC November 22 and 23, 2007.
(Click to enlarge)
Bering Sea Storm, November 2224: The initial rapid intensification of this cyclone is displayed in Figure 12, with the frontal wave of low pressure at 40N 165E tracking northeast and then turning northwest into the Bering Sea. The central pressure fell an impressive 37 hPa in the twenty-four hour period ending at 0600 UTC November 23. The Polar Eagle (ELPT3) near (54N 171E) reported an east wind of 76 kts at 0600 UTC on the 23rd ahead of the strong occluded front (plotted in Figure 12). The author was unable to confirm the accuracy of this report using scatterometer imagery, which was unavailable. Another ship in that area, the Arctic Sun (ELQB8), reported an east wind of 58 kts near 56N 175E three hours later. The buoy 46070 (55N 175.3E) reported an east wind of 41 kts at that time, followed by an observation of southeast winds 35 kts and 7.5-m seas (24 ft) fourteen hours later. The cyclone then intensified further, developing a central pressure as low as 948 hPa (27.99 inches) at 0000 UTC on the 24th when the center was near 54N 170W. The cyclone then stalled and slowly weakened and was replaced by another developing storm moving from near the northern Kurile Islands from late on the 26th through the 28th.
North Pacific Storm, November 24-26: This cyclone developed rapidly as it moved northeast from well south of the eastern Aleutians near 42N on the morning of November 24 to 180 nmi south of Kodiak Island at 1800 UTC on the 25th with the central pressure down to 959 hPa. The central pressure dropped 34 hPa in the twenty-four hour period ending at 1200 UTC on the 25th. The cyclone briefly developed hurricane- force winds just south of the center, up to 65 kts as revealed in scatterometer imagery, early on the 25th. The Polar Eagle (ELPT3) reported a northeast wind of 61 kts near 57N 156W at 0300 UTC on the 26th, while the ship WCZ7335 (60N 147W) encountered east winds of 60 kts. The buoy 46076 (59.5N 148W) reported an east wind of 47 kts with peak gusts to 58 kts at 0500 UTC November 26. The maximum significant wave height at this buoy was 10 m (33 ft) two hours prior. The buoy 46061 (60.2N 146.8W) reported east winds of 47 kts and peak gusts to 60 kts at 0600 UTC on the 26th, and maximum seas 8.0 m (26 ft) three hours later. Another buoy, 46080 at 58N 150.1W, reported east winds of 43 kts with gusts to 52 kts and 7.5-m seas (25 ft) at 2300 UTC on the 25th, followed four hours later by a report of maximum seas 9.0 m (30 ft). Augustine Island (AUGA2, 59.38N 153.35W) reported a northeast wind of 53 kts at 2300 UTC on the 25th. The cyclone subsequently moved north and weakened over the southern Alaska mainland on the 26th.
Eastern North Pacific Storms, December 1-3: The primary storm center appeared to have tropical origins back in late November as Tropical Depression 25 became an extratropical frontal wave of low pressure southeast of Japan. The developing storm moved northeast and rapidly intensified after passing east of 170W in the south-central North Pacific near 34N early on December 1. The cyclone developed a central pressure of 960 hPa near 38N 154W and hurricane-force winds at 1200 UTC on the 2nd. A secondary storm center formed to the east near 44N 132W by that time with a central pressure of 992 hPa. This secondary low developed hurricaneforce winds six hours later while moving northeast toward the coast, before weakening inland by 0000 UTC on the 3rd. Figure 13 is a full-ocean view valid 0000 UTC on the 3rd showing the primary cyclone (38N 150E) when it was most intense. The central pressure fell 39 hPa in the twenty-four hour period ending at 1800 UTC on the 2nd. High-resolution QuikSCAT imagery from 1615 UTC December 2 revealed north to northwest winds 50 to 75 kts and isolated 80 kts on the southwest and west sides, similar in appearance to Figure 11 (November 18 storm). Selected ship, buoy and automated coastal station observations taken during the two storms are listed in Table 3, with the earlier reports prior to 0000 UTC on the 3rd associated with the secondary center. Buoy 46050 was dislodged in the storm as it was moved from its normal position of 44.6N 124.5W to 46N 124.1W by 1300 UTC on the 4th. The cyclone subsequently moved northeast and weakened to a gale in the southeast Gulf of Alaska early on the 4th before moving inland north of Vancouver Island later on the 4th.
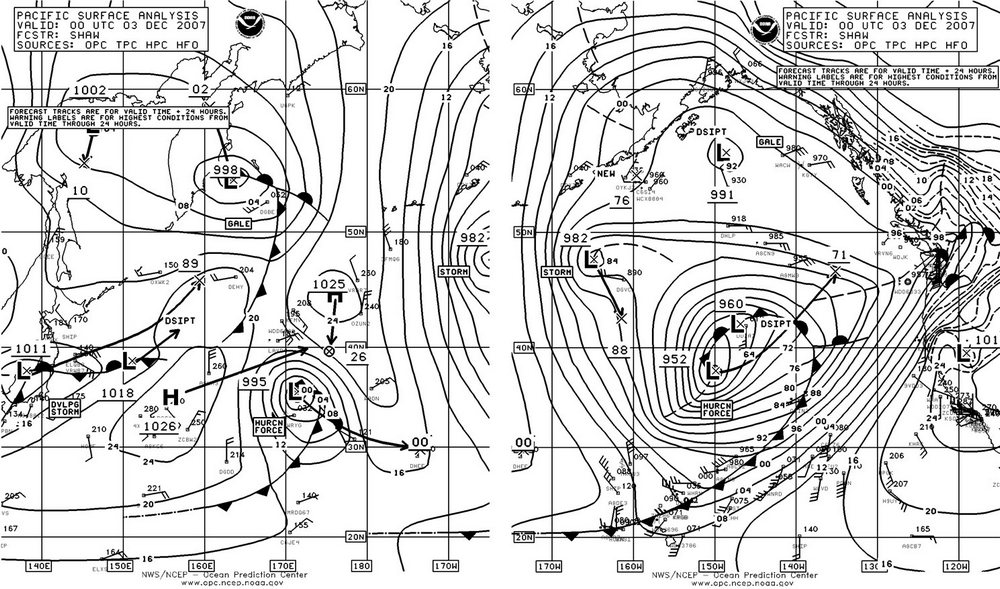
Figure 13. OPC North Pacific Surface Analysis charts (Parts 1 and 2) valid 0000 UTC December 2007.
| OBSERVATION | POSITION | DATE/TIME(UTC) | WIND | SEAS(m/ft) |
|---|---|---|---|---|
| Colorado Voyager (KLHZ) | 44N 126W | 03/1200 | S 65 | 13.0/43 |
| Dirch Maersk (OXQP2) | 43N 132W | 03/1800 | S 35 | 9.0/30 |
| Hanjin Dallas (DDZA2) | 40N 142W | 03/1800 | W 35 | 12.0/39 |
| Horizon Hawk (WDD6033) | 44N 127W | 03/1800 | S 60 | 13.0/42 |
| Marinus Green (PECS) | 45N 126W | 03/1800 | S 60 | 14.0/46 |
| Regina Maersk (OZIN2) | 35N 132W | 03/1800 | S 50 | 12.5/41 |
| Buoy 46050 | 44.6N 124.5W | 03/0600 | S 49 G62 | 4.5/14 |
| 02/2300 | Peak gust 66 | |||
| 03/0500 | 12.0/39 | |||
| Buoy 46089 | 45.9N 125.8W | 03/0800 | S 45 G58 | 9.5/31 |
| 03/1900 | maximum | 14.5/48 | ||
| Buoy 46029 | 46.3N 124.4W | 03/0800 | S 45 G58 | 12.0/39 |
| 03/1000 | maximum | 13.5/44 | ||
| Buoy 46041 | 47.3N 124.7W | 03/1900 | S 41 G54 | 11.5/38 |
| 03/1000 | Peak gust 60 | |||
| 03/1100 | maximum | 12.0/39 | ||
| Buoy 46022 | 40.8N 124.5W | 03/1900 | S 43 G54 Peak 60 | 7.5/25 |
| 04/0100 | maximum | 8.5/28 | ||
| Buoy 46015 | 42.8N 124.8W | 03/1400 | S 45 G58 | 9.5/31 |
| 03/1600 | Peak gust 60 | |||
| 03/1900 | maximum | 12.0/39 | ||
| Buoy 46002 | 42.6N 130.4W | 03/0400 | SW 39 G54 | 6.0/20 |
| 03/1800 | maximum | 9.5/31 | ||
| Buoy 46005 | 46.0N 131.0W | 04/0300 | SW 35 G49 | 9.0/30 |
| 04/0400 | maximum | 9.5/31 | ||
| Buoy 46206 | 48.8N 126.0W | 03/0900 | SE 35 G43 | 5.5/18 |
| 03/1400 | maximum | 8.5/28 | ||
| Destruction Island (DESW1) | 47.7N 124.4W | 03/1100 | S 64 G72 | Peak 81 |
| Cape Arago (CARO3) | 43.4N 124.3W | 03/2000 | S 51 G64 | Peak 78 |
| Newport, Oregon (NWPO3) | 44.6N 124.0W | 02/2200 | S 52 G61 | |
| 02/2300 | Peak gust 71 |
Table 3. Ship, buoy and coastal automated station observations taken during the storms in the eastern North Pacific on December 1-3, 2007.
Southwestern North Pacific Storm, December 23: The hurricane-force low at 36N 171E shown in Figure 13 originated from the merging of two weak lows, one near 38N 154E and the other near 32N 157E. The compact cyclone developed hurricane-force winds briefly late on December 2 and reached maximum intensity at that time, before dropping southeast into the central Pacific waters near Hawaii on the 5th. Scatterometer winds were available near the time of Figure 13 and appeared similar to those in Figure 15 with storm and hurricane-force winds in the south semicircle. The Tellus (WRYG) reported a west wind of 50 kts near 33N 171E at 0000 UTC on the 3rd.
North Pacific and Bering Sea Storm, December 36: This cyclone developed from the 1011 hPa frontal wave of low pressure shown in Figure 13 over Japan with its 24-hour forecast track also shown. By 1800 UTC on the 4th this storm developed hurricaneforce winds with the center near 52N 168E, and the central pressure dropped 39 hPa in the twenty-four hour period ending at this time. The central pressure was lowest six hours later, with 952 hPa. Hurricane-force winds lasted into early on the 5th and were mainly south of the center, similar to the wind pattern in Figure 15. The ship Skaubryn (LAJV4) (49N 162E) reported northwest winds of 45 kts at 1200 UTC on the 4th, and the APL Philippines (WCX8884) reported southwest winds of 40 kts and 10.0 m seas (32 ft) near 43N 179W fifteen hours later. The buoy 46073 (54.9N 172.1W) reported south winds of 40 kts and 8.5 m seas (28 ft) at 0400 UTC December 6. The cyclone then drifted northeast and weakened to a gale in the central Bering Sea early on the 6th.
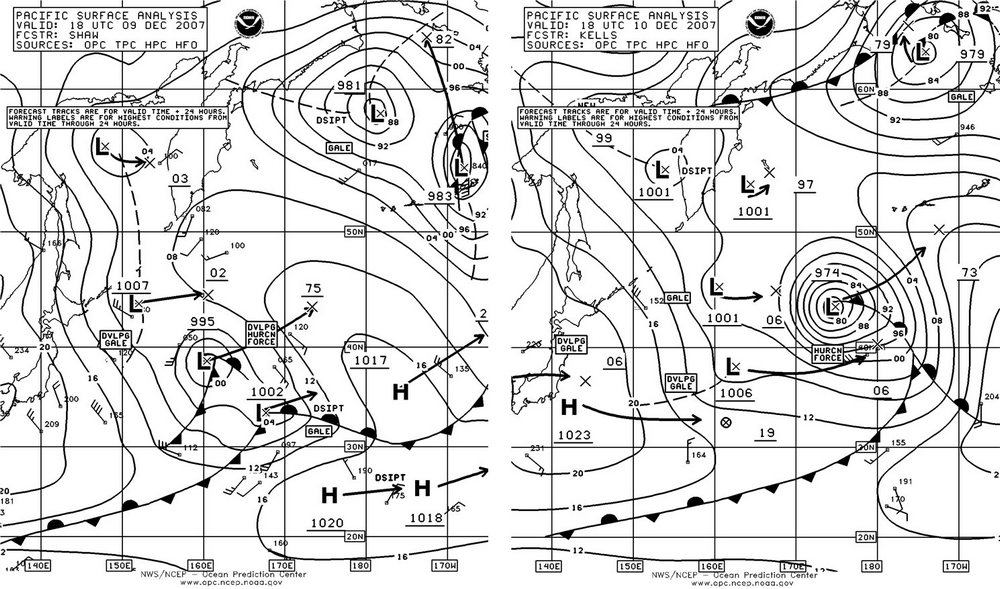
Figure 14. OPC North Pacific Surface Analysis charts (Part 2) valid 1800 UTC December 9 and 10, 2007.
(Click to enlarge)
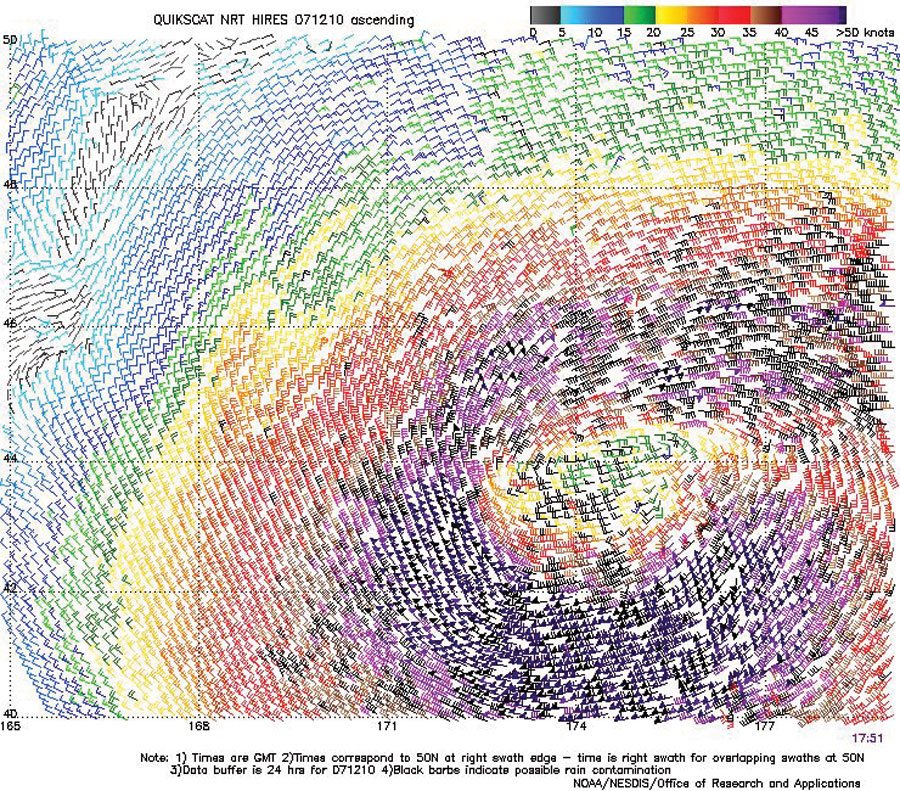
Figure 15. High-resolution QuikScat scatterometer image of
satellite-sensed winds around the storm shown in the second part of Figure 14.
The valid time of the pass is 1731 UTC December 10, 2007, or about one-half
hour prior to the valid time of the second part of Figure 14.
Image is
courtesy of NOAA/NESDIS/ Office of Research and Applications
(Click to enlarge)
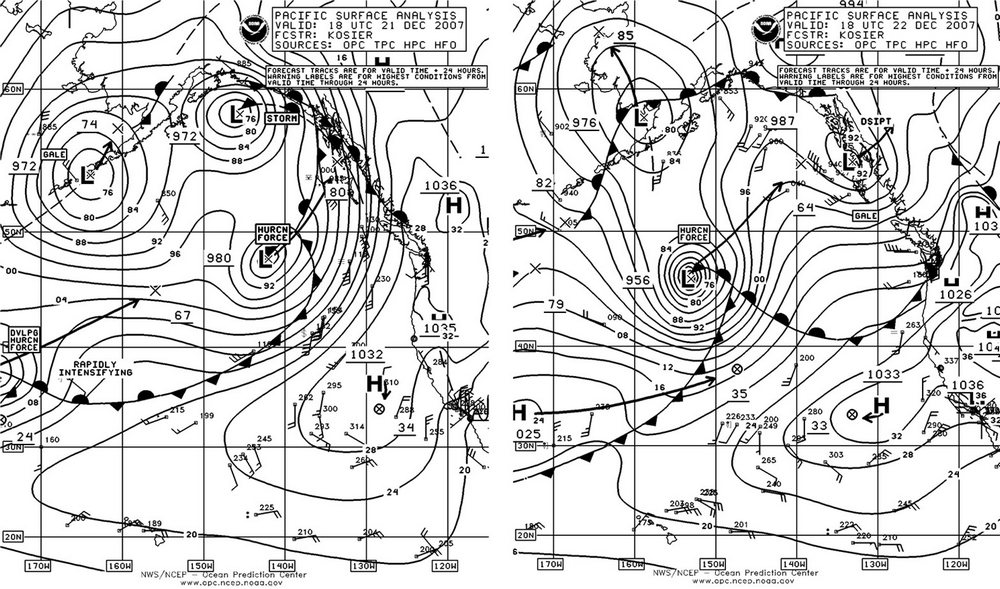
Figure 16. OPC North Pacific Surface Analysis charts (Part 1) valid 1800 UTC December 21 and 22, 2007.
(Click to enlarge)
North Pacific Storm, December 912: Like the earlier December event in the southwestern waters, this cyclone developed rapidly over a twenty-hour period from the merger of two lows as displayed in Figure 14. The second part of figure shows the cyclone near maximum intensity as it developed hurricane-force winds, seen in Figure 15 mainly south of the center where winds were up to 75 kts. The ship Clifton Bridge (JKRK) (40N 178W) reported west winds of 40 kts and 7.5 m seas (24 ft) at 0000 UTC on the 11th. Six hours later the ship Horizon Falcon (WDD6040) (43N 174W) encountered southwest winds of 40 kts and 11.0 m seas (36 ft). The system tracked northeast while maintaining hurricane-force winds into early on the 11th, and passed just south of the Alaska Peninsula as a weakening gale-force low early on the 12th.
North Pacific Storm, December 1821: This storm originated off Japan near 36N 145E at 1800 UTC on the 17th and tracked northeast to near 50N 180 at 1200 UTC on the 19th , where it developed hurricane-force winds similar to those in the December 36 event, and a central pressure of 968 hPa. The central pressure fell 31 hPa in the twenty-four hour period ending at this time. Hurricane-force winds lasted until late on the 19th. The cyclone passed near Adak in the Aleutians with a 966 hPa central pressure, before weakening and moving into the southeastern Bering Sea late on the 21st as shown in Figure 16.
Eastern North Pacific Storms, December 2123: Figure 16 shows two hurricane- force cyclones moving northeast across the eastern waters. The weaker eastern center came from near 42N 156W at 0600 UTC on the 21st when its central pressure was 998 hPa. The center moved to 50N 139W with a lowest central pressure of 972 hPa at 0000 UTC on the 22nd, accompanied by minimal hurricane- force winds. The second part of Figure 16 shows it moving inland over Southeast Alaska, while the second stronger cyclone was near maximum intensity with a central pressure of 956 hPa. This stronger system originated as a frontal wave of low pressure near 35N 170E at 0600 UTC on the 21st. The central pressure fell 34 hPa in the twenty-four hour period ending at 1800 UTC on the 22nd. Figure 17 shows standard 25 km QuikSCAT winds around this storm near the time of maximum intensity. Even at this coarser resolution, 75 kts wind barbs appear on the southwest side of the center. Hurricane-force winds lasted into the morning of the 23rd as the system began to weaken. The cyclone followed its predecessor into Southeast Alaska early on the 24th.
North Pacific Storms, December 2329: The first of two cyclones followed a track northeastward from south of the central Aleutians early on December 23 to the central Gulf of Alaska at 0600 UTC on the 25th with a lowest pressure of 972 hPa. This cyclone was similar to the weaker of the pair shown in Figure 16. The center then dissipated near the southern Alaska coast on the 26th. The second system followed a similar track northeastward to just south of the eastern Aleutians on the 27th and 28th, becoming a compact 956-hPa cyclone 0000 UTC on the 29th when it briefly developed hurricane-force winds. The storm turned east and weakened onshore north of Vancouver Island late on the 29th.
Northeast Pacific Storm, December 30, 2007 to January 1, 2008: The fourmonth periods final significant event developed as depicted in Figure 18 from a frontal wave of low pressure at 39N 153W. The central pressure dropped 34 hPa in the twenty-four hour period ending at 1200 UTC on the 31st. The second part of Figure 18 shows the cyclone as it was developing hurricane-force winds ahead of the occluded front moving into the Gulf of Alaska. Table 4 contains selected ship and buoy observations taken in this storm which actually lasted into the new year 2008 as it drifted north into the Gulf of Alaska.
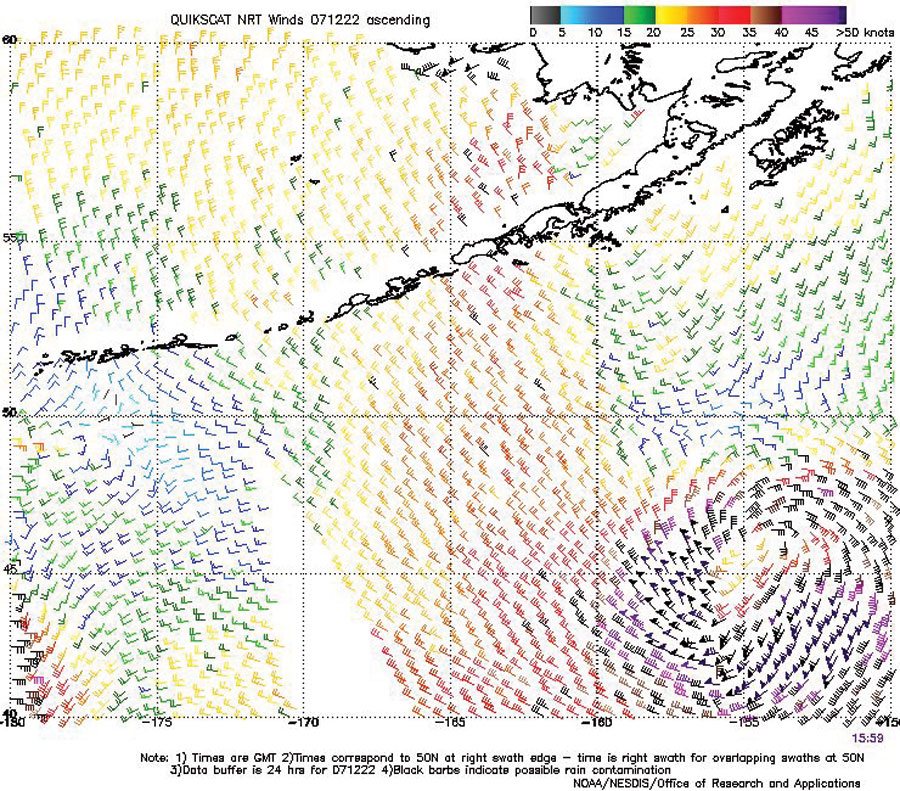
Figure 17. QuikScat scatterometer image of
satellite-sensed winds around the more intense storm center (46N 153W) shown
in the second part of Figure 16. The valid time of the pass is 1559 UTC
December 22, 2007, or about two hours prior to the valid time of the second
part of Figure 16. This is the standard version of the imagery with a
resolution of 25 km.
Image is courtesy of NOAA/NESDIS/ Office of Research and
Applications.
(Click to enlarge)
| OBSERVATION | POSITION | DATE/TIME(UTC) | WIND | SEAS(m/ft) |
|---|---|---|---|---|
| Alaskan Legend (WDD2074) | 53N 140W | 31/1700 | SE 55 | 13.0/43 |
| 54N 140W | 31/1800 | SE 60 | 9.0/30 | |
| 56N 143W | 01/0600 | E 75 | 12.5/41 | |
| SeaLand Anchorage (KGTX) | 52N 137W | 31/2200 | SE 65 | 9.0/30 |
| 52N 137W | 31/2300 | SE 60 | 10.0/33 | |
| 52N 137W | 01/0100 | SE 55 | 13.5/45 | |
| OOCL Korea (DMRG) | 56N 137W | 01/0000 | E 50 | 8.0/26 |
| 58N 143W | 01/1200 | E 50 | 10.0/33 | |
| Polar Resolution (WDJK) | 57N 143W | 01/0300 | E 55 | |
| OOCL Japan | 58.7N 145W | 01/1500 | E 70 | |
| Buoy 46633 | 47.2N 155.9W | 31/1400 | NW 40 | |
| Buoy 46004 | 50.9N 136.2W | 31/2200 | SE 45 | 8.5/28 |
| 01/0100 | SE 40 | 9.5/31 | ||
| Buoy 46184 | 53.9N 138.9W | 01/0000 | SE 50 | 8.5/28 |
| 01/0300 | SE 50 | 11.0/36 | ||
| Buoy 46085 | 55.9N 142.6W | 01/0400 | E 45 | 10.0/32 |
| 01/0900 | SE 35 | 13.0/43 | ||
| Buoy 46208 | 52.5N 132.7W | 01/1000 | SE 40 | 11.0/36 |
| Buoy 46001 | 56.3N 148.2W | 01/0900 | NE 40 | 10.0/33 |
Table 4. Ship and buoy observations taken during the storm of December 30, 2007 to January 1, 2008.
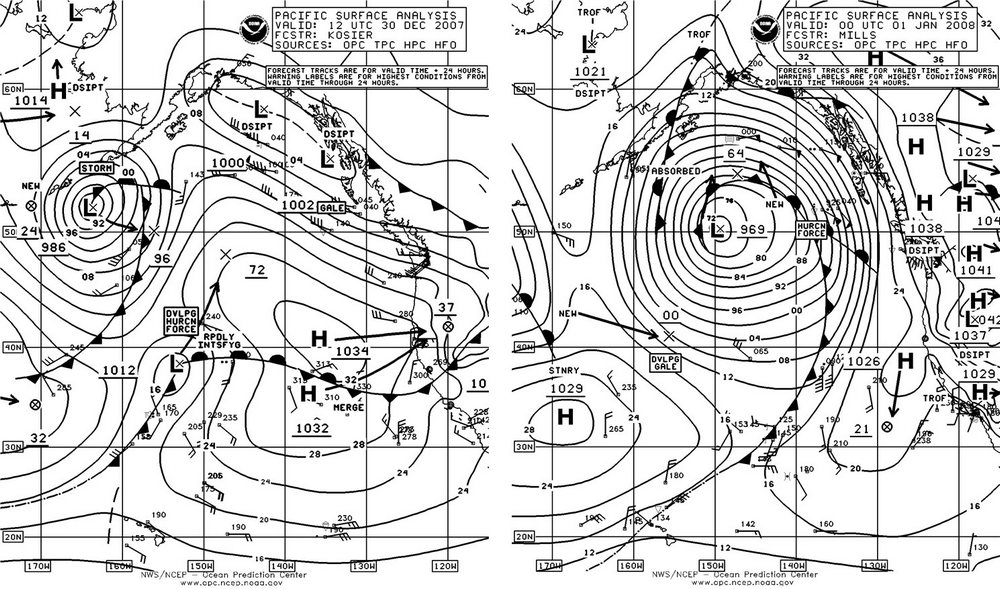
Figure 18. OPC North Pacific Surface Analysis charts (Part 1) valid 1200 UTC December 30,
2007 and 0000 UTC January 1, 2008.
(Click to enlarge)
References
1. Bancroft, George, "Marine Weather Review, North Atlantic Area, September to December 2006", Mariners Weather Log April 2007.
2. Joe Sienkiewicz and Lee Chesneau, "Mariner’s Guide to the 500-Millibar Chart", Mariners Weather Log Winter 1995.
3. From Tropical Prediction Center website, http://www.nhc.noaa.gov/aboutsshs.shtml.
Back to top