Mean Circulation Highlights and Climate Anomalies
September through December 2007
Edward A. O’Lenic, Chief, Operations Branch, Climate Prediction Center NCEP/NWS/NOAA.
September-October 2007
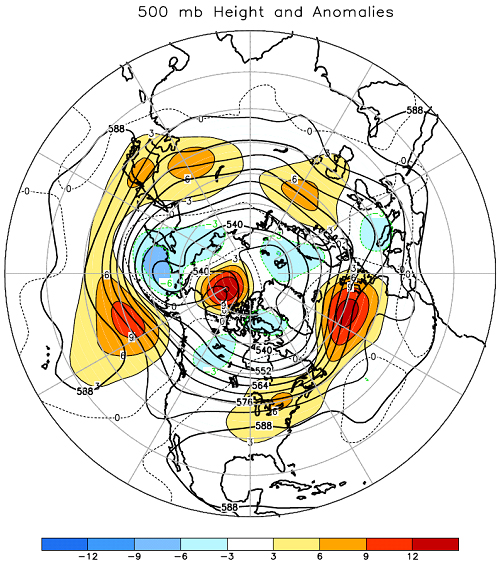
The 500-hPa height pattern during September reflected amplified meridional flow over much of the hemisphere with positive mean height anomalies covering large portions of the middle and high latitudes (Fig. 1), especially over the Arctic Ocean, Gulf of Alaska, eastern North America, the high latitudes of the North Atlantic, central Russia , and Mongolia , while small areas of negative height anomalies occupied the Bering Strait, western Canada , and southeastern Europe. Sea level pressure mirrors 500 hPa, with a strong trough in the Bering Sea and a strong high just to its south (Fig. 5).
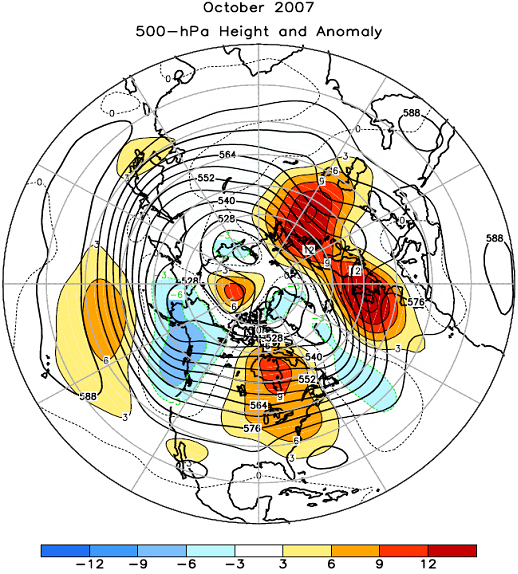
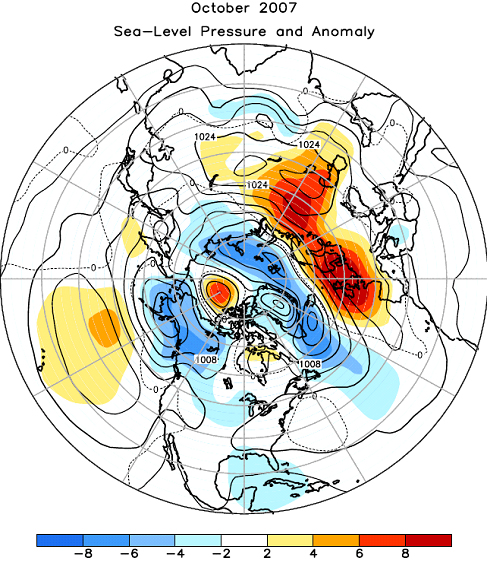
The October 500 hPa height pattern featured mean positive anomalies over the central North Pacific Ocean, eastern North America, and from the high latitudes of the eastern North Atlantic to central Russia. Negative anomalies occurred over Alaska, the Gulf of Alaska, western Canada and the central North Atlantic Ocean and Greenland. In North America, there was a complete disappearance of the mean Hudson Bay Low (Fig. 2). A train of positive and negative SLP anomalies stretched from north of Hawaii, across the pole to northern Europe and Asia (Fig. 6).
The Tropics
During September 2007 negative sea surface temperature (SST) anomalies in the equatorial Pacific Ocean continued to expand westward. The SST anomalies became increasingly negative in all of the Niño regions, with the Niño-3.4 index dropping to -0.8°C and the Niño-4 index dropping to -0.4°C. The sub-surface temperature departures also became increasingly negative across the eastern equatorial Pacific. There was a strengthening and eastward expansion of the low-level easterly wind anomalies across the central and eastern equatorial Pacific, and an equatorial SOI +1.6, all indicating La Nina conditions. Eight (three) tropical storms formed in the Atlantic (East Pacific).
La Niña continued to strengthen during October 2007, reflected by a drop in the monthly Niño-3.4 index to -1.4°C and a drop in the Niño-4 index to -0.6°C The equatorial SOI remained significantly positive (+2.0), and the Tahiti Darwin SOI was slightly above-average (+0.6). Two (one) tropical storms formed in the Atlantic (East Pacific).
November-December
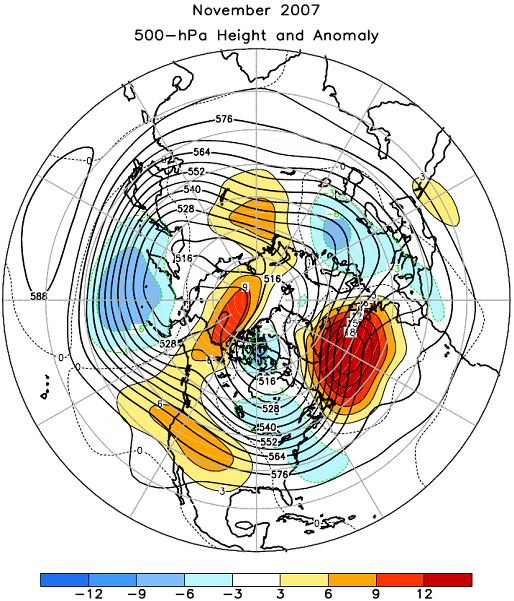
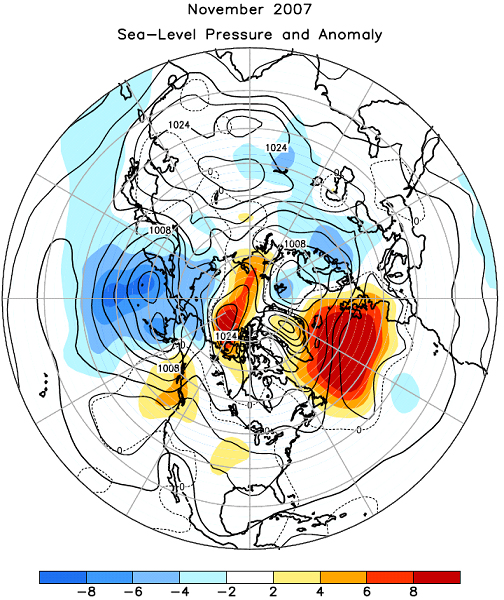
The 500-hPa height field during November featured positive anomalies over the western half of the U.S., the high latitudes of the North Atlantic Ocean, and central Russia, and negative anomalies over the high latitudes of the central North Pacific Ocean, eastern Canada, and eastern Europe (Fig. 3). This pattern was associated with anomalous southerly flow into Alaska. Negative SLP anomalies covered the northern North Pacific Ocean, while a strong blocking high occupied the northern North Atlantic (Fig. 7).
The 500-hPa heights during December 2007 featured positive anomalies over the central and eastern North Pacific, the eastern US, and Scandinavia, and negative anomalies over western Canada and the high latitudes of the North Atlantic Ocean (Fig. 4). The core of the East Asian jet stream was retracted westward to well west of the date line. This was attended by a shift of the mean ridge from western North America to the central/eastern North Pacific, and a shift of the mean Hudson Bay trough to central or even western North America (Fig. 4). A north-south dipole pattern of 500-hPa height anomalies occurred over the North Atlantic Ocean , with below-average heights centered over Greenland and above-average heights extended across the middle latitudes (Fig. 4). A strong blocking ridge was also evident over Scandinavia. SLP closely mirrored these features (Fig. 8).
The Tropics
During November 2007, equatorial SST anomalies became increasingly negative from 160°E to the South American coast. This cooling is reflected by a drop in the monthly Niño- 3.4 index to -1.5°C and a drop in the Niño-4 index to -0.9°C. Low-level easterly wind anomalies (more than 3.0 m s-1) and upper-level westerly anomalies (more than 5.0 m s-1) spanned the central equatorial Pacific. These oceanic and atmospheric conditions reflect a strengthening La Niña. One tropical storm (H. Noel) was observed.
During December, the equatorial SSTs were more than 1.5°C below average east of 170oW. The monthly Niño-3.4 index was -1.5°C and the monthly Niño-1+2 index was -2.0°C. The sub-surface temperature departures across the eastern equatorial Pacific, at thermocline depth ranged from -2°C to -4°C below average. Strong low-level easterly wind anomalies (more than 3.0 m s-1) spanned the western and central equatorial Pacific. The 850 hPa wind index in the western Pacific (+3.7) was the largest value observed in the historical record back to 1979. These conditions were associated with enhanced convection (above-average rainfall amounts) across the eastern tropical Indian Ocean and Indonesia and a continuation of suppressed convection (below-average rainfall amounts) across the central and eastern equatorial Pacific. Consistent with these anomalies, the TahitiDarwin SOI was +1.8 during December.
For the latest on ENSO see:
http://www.cpc.noaa.gov/products/analysis_monitoring/enso_advisory/
A summary of tropical storms may be found at:
http://www.nhc.noaa.gov
 2 (Click image to enlarge)
 3 (Click image to enlarge)
 4 (Click image to enlarge)
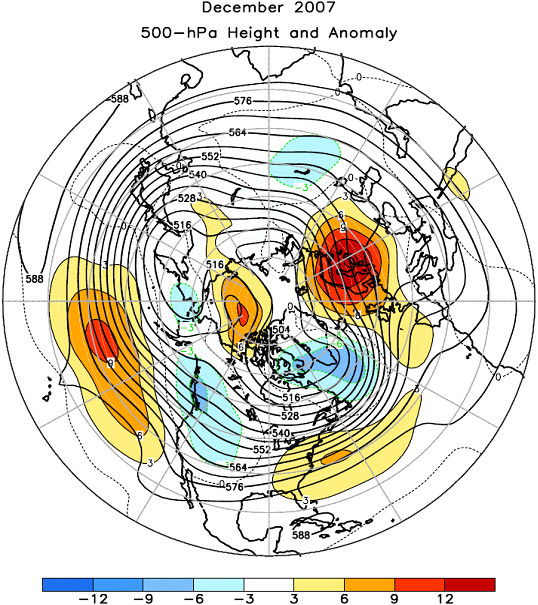
Figures 1-4. Northern Hemisphere mean and anomalous 500-hPa geopotential height (CDAS/Reanalysis). Mean heights are denoted by solid contours drawn at an interval of 8 dam. Anomaly contour interval is indicated by shading. Anomalies are calculated as departures from the 1979-1995 base period monthly means.
 6 (Click image to enlarge)
 7 (Click image to enlarge)
 8 (Click image to enlarge)
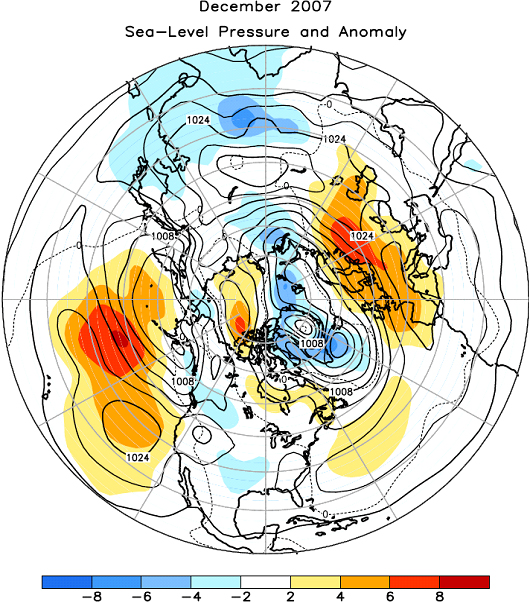
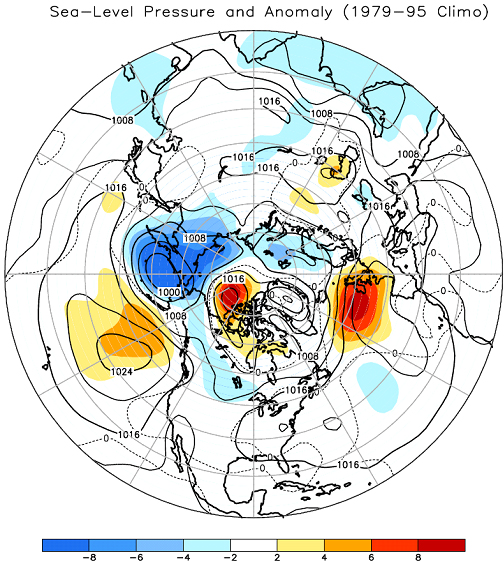
Figures 5-8. Northern Hemisphere mean and anomalous sea level pressure (CDAS/Reanalysis). Mean values are denoted by solid contours drawn at an interval of 4 hPa. Anomaly contour interval is indicated by shading. Anomalies are calculated as departures from the 1979-1995 base period monthly means.