Eastern North Pacific Hurricane Season of 2006
John L. Beven, Richard J. Pasch, and Eric S. Blake, Tropical Prediction Center/National Hurricane Center, NOAA/NWS Miami, FL
Introduction
Individual Storms
Tropical Depressions
Acknowledgments
After three below-average hurricane seasons, tropical cyclone activity in the eastern North Pacific basin was slightly above average in 2006. Eighteen tropical storms developed, and ten of these strengthened into hurricanes. Five of the hurricanes intensified into major hurricanes (category 3 or higher on the Saffir-Simpson Hurricane Scale). There were also three tropical depressions that did not strengthen into tropical storms. Since reliable records began in 1971, the long-term averages are 15 tropical storms, nine hurricanes, and four major hurricanes. Not since 1992 have as many as 18 tropical storms been observed, and the last time 10 hurricanes occurred was in 1993. Moreover, the 2006 season total of 5 major hurricanes equals the highest seen since 1998. The 2006 season featured several landfalls in Mexico, following two quiet years for hurricane strikes. One major hurricane (Lane), one category 2 hurricane (John) and one tropical depression (Paul) made landfall in Mexico during the season.
Back to topThe statistics of the named storms of 2006 are given in Table 1, while the tracks are shown in Figures 1a and 1b. The tracks of the non-developing depressions are shown in Figure 2. In the cyclone summaries given below, all dates are based on Universal Coordinated Time.
| Name | Class* | Dates** | Winds (kts) | Pressure (hPa) | Deaths |
|---|---|---|---|---|---|
| Aletta | TS | May 27-30 | 40 | 1002 | |
| Bud | H | July 11-16 | 110 | 953 | |
| Carlotta | H | July 12-16 | 75 | 981 | |
| Daniel | H | July 16-26 | 130 | 933 | |
| Emilia | TS | July 21-28 | 55 | 990 | |
| Fabio | TS | July 31-August 3 | 45 | 1000 | |
| Gilma | TS | August 1-3 | 35 | 1004 | |
| Hector | H | August 15-23 | 95 | 966 | |
| Ileana | H | August 21-27 | 105 | 955 | |
| John | H | August 28-September 4 | 115 | 948 | 5 |
| Kristy | H | August 30-September 8 | 70 | 985 | |
| Lane | H | September 13-17 | 110 | 952 | 4 |
| Miriam | TS | September 16-18 | 40 | 999 | |
| Norman | TS | October 9-15 | 45 | 1000 | |
| Olivia | TS | October 9-12 | 40 | 1000 | |
| Paul | H | October 21-26 | 90 | 970 | 4 |
| Rosa | TS | November 8-10 | 35 | 1002 | |
| Sergio | H | November 13-20 | 95 | 965 |
Table 1. 2006 Eastern North Pacific Tropical Storms and Hurricanes
* TS - tropical storm, maximum sustained winds 34-63 kts; H - hurricane, maximum sustained winds 63 kts or higher.
** Dates begin at 0000 UTC and include tropical/subtropical depression stage, but exclude extratropical stage.
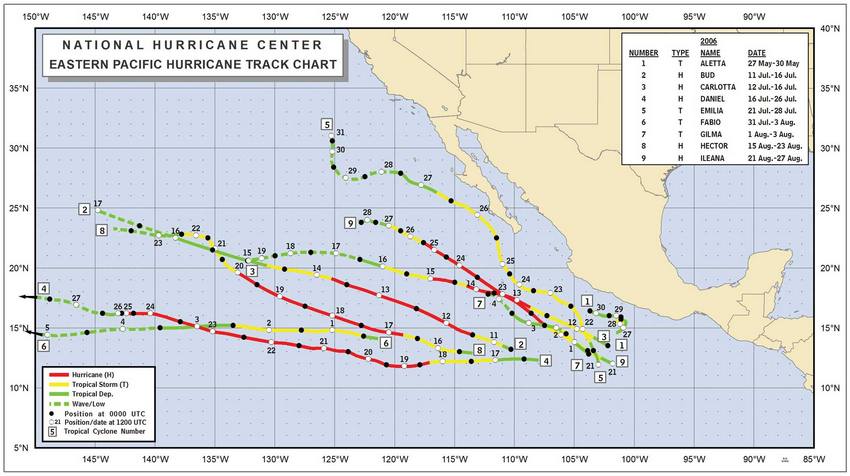
Figure 1a. Tracks of eastern North Pacific tropical storms and hurricanes of 2006: Aletta through Ileana.
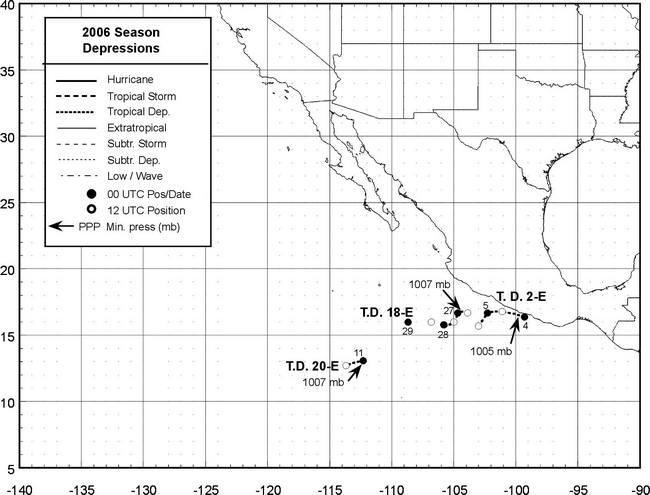
Figure 2. Tracks of eastern North Pacific tropical depressions of 2006.
Aletta formed from the combination of a westward-moving tropical wave and a pre-existing low-level trough near the Gulf of Tehuantepec. Early on 27 May, the system became organized into a tropical depression centered about 165 nmi southwest of Acapulco, Mexico (Figure 1a). The tropical cyclone moved slowly and strengthened into a tropical storm later that day. While reaching its estimated peak intensity of 40 kts, Aletta drifted erratically, and the storm executed a counterclockwise loop about 85 nmi southwest of Acapulco on 28 May. The cyclone began drifting westward on 29 May while weakening to a tropical depression. Aletta continued to weaken and dissipated about 175 nmi south-southeast of Manzanillo, Mexico on 30 May. Locally heavy rains occurred over portions of southern Mexico. However, there were no reports of casualties or damage.
Back to topBud developed from a tropical wave that reached the eastern North Pacific by 7 July. A tropical depression formed from the system early on 11 July about 700 nmi south of Cabo San Lucas, Mexico (Figure 1a). Persistent high pressure to the north steered the tropical cyclone west-northwestward throughout its life span. The initial development was rapid, and the system became a hurricane within about a day. Bud reached its estimated peak strength of 110 kts (category 3) while centered about 650 nmi west-southwest of Cabo San Lucas on 13 July (Figure 3). Thereafter, cooler waters and stable air induced rapid weakening. The cyclone dropped below hurricane strength on 14 July and weakened to a depression the next day. Bud degenerated into a remnant low pressure area on 16 July, and this remnant low dissipated in the trade winds on 17 July while located about 650 nmi east-northeast of Hawaii.
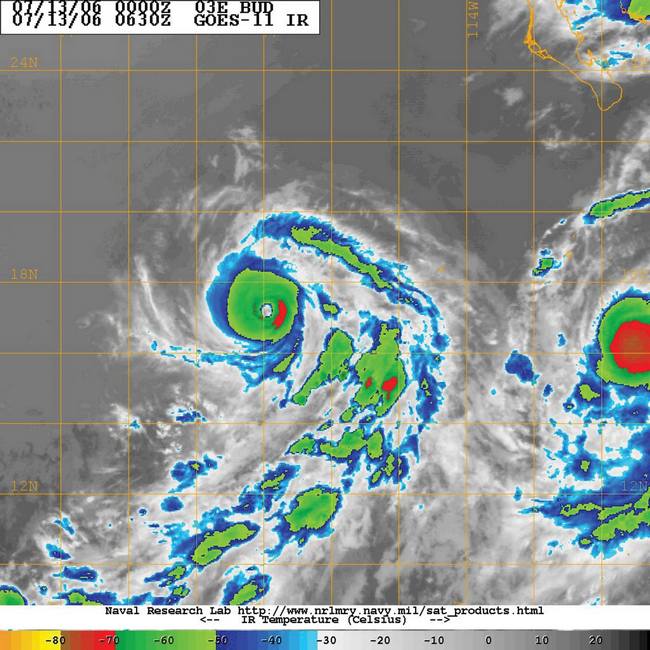
Figure 3. GOES-10 infrared image of Hurricane Bud near maximum intensity at 0630 UTC 13 July.
Image courtesy of the Naval Research Laboratory, Monterey, CA.
Carlotta originated from a tropical wave that entered the eastern North Pacific on 9 July. An associated broad low pressure area developed into a tropical depression early on 12 July about 250 nmi south of Zihuatanejo, Mexico (Figure 1a). Moving briskly west-northwestward, the cyclone became a tropical storm 6 h later and a hurricane 24 h after that. Carlotta initially had a large circulation, and its outer rainbands affected the coast of Mexico from the Gulf of Tehuantepec to Manzanillo on 12 July. On 13 July, the forward motion slowed while northwesterly vertical shear, associated with the outflow of Hurricane Bud located about 600 nmi to the west, slowed the intensification rate. Carlotta developed a banding eye and reached its estimated peak intensity of 75 kts late on 13 July, but the shear caused the system to weaken to a tropical storm late the next day. Carlotta briefly re-gained hurricane strength early on 15 July, then again weakened to a tropical storm as the center passed over lower sea surface temperatures. Rapid weakening ensued, and the cyclone weakened to a tropical depression on 16 July and degenerated to a remnant low early on 17 July. The low moved slowly westward and dissipated on 20 July about 1300 nmi east of the Hawaiian Islands.
Back to topDaniel, the strongest hurricane of the season, had a long track over the eastern and central North Pacific. It was spawned from a westward-moving tropical wave that crossed the Atlantic basin during the first couple of weeks of July. As the wave moved over the Pacific, convective organization increased, and a tropical depression formed late on 16 July about 455 nmi south-southwest of Manzanillo (Figure 1a). The cyclone moved westward in a light vertical shear environment to the south of a large subtropical ridge. It strengthened into a tropical storm on 17 July and into a hurricane the next day. Daniel turned west-northwestward early on 20 July, when intensification was briefly halted by an eyewall replacement cycle. Strengthening resumed after the cycle, and it is estimated that Daniel became a category 4 hurricane later on 20 July while centered about 965 nmi west-southwest of Cabo San Lucas. Daniel turned westward on 21 July during a second eyewall replacement cycle. After this cycle, the hurricane reached an estimated peak intensity of 130 kts early on 22 July (Figure 4). Slow weakening began later that day as Daniel moved over progressively cooler waters. The hurricane turned west-northwestward on 23 July, and early the next day it crossed 140°W and entered the central North Pacific hurricane basin. As the subtropical ridge to the north weakened, the cyclone decelerated and, due to a combination of cooler waters and increasing easterly shear, Daniel weakened to a tropical storm on 25 July and to a depression the following day. It degenerated to a remnant low early on 27 July that dissipated the next day about 220 nmi east-southeast of Hilo, Hawaii.
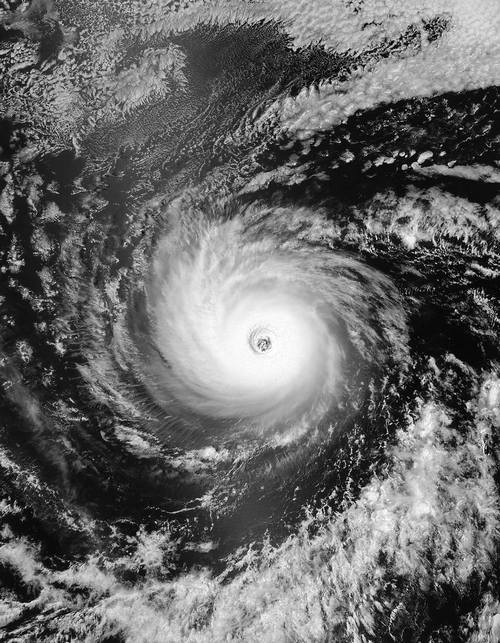
Figure 4. NASA MODIS image of Hurricane Daniel near maximum intensity from the Aqua satellite at 2155 UTC 21 July 2006.
Image courtesy of the NASA Earth Observatory, Greenbelt, MD.
Emilia developed from a tropical wave that produced a low pressure area about 370 nmi south of Acapulco on 20 July. On 21 July, the low became organized enough to be classified as a tropical depression about 350 nmi south-southwest of Acapulco (Figure 1a). The cyclone became a tropical storm early the next day. Moving around the southwestern periphery of a large subtropical ridge, Emilia’s center passed about 150 nmi southwest of Manzanillo. Emilia strengthened to an estimated peak intensity of 55 kts on 23 July, but increasing wind shear caused the storm to weaken for the next 24 h. Emilia re-intensified on 25 July as the shear relaxed, and the estimated maximum winds again reached 55 kts early on 26 July. The center passed within about 50 nmi of Cabo San Lazaro on the southwestern coast of the Baja peninsula later that day. On 27 July, Emilia turned toward the west-northwest over much cooler waters and rapidly weakened to a tropical depression. It became a remnant low early on 28 July that dissipated three days later about 430 nmi west-southwest of San Diego, California.
Several ships encountered Emilia (Table 2), with the Mediterraneo (DPCU) reporting the highest winds of 45 kts at 0600 UTC 25 July. At the coast, elevated sites at Cabo San Lucas and Puerto Cortes reported 10-min winds of 37 kts, with a gust to 48 kts at the latter location. Damage in Mexico was minor and there were no reports of casualties.
| Date/Time (UTC) |
Ship name/call sign | Latitude (°N) |
Longitude (°W) |
Wind dir/speed (knts) | Pressure (hPa) |
|---|---|---|---|---|---|
| 24/1500 | Nikkei Phoenix | 21.2 | 106.9 | 140/35 | 1007.0 |
| 25/0600 | Mediterraneo | 20.4 | 106.9 | 120/45 | 1009.5 |
| 25/0600 | Saiki | 25.4 | 110.3 | 120/38 | 1009.0 |
| 25/0900 | Contship Vision | 21.4 | 108.5 | 130/40 | 1005.5 |
Table 2. Selected ship and buoy reports with winds of at least 34 kts for Tropical Storm Emilia, 21-28 July 2006.
Back to top
Fabio formed from a weak area of low pressure associated with a tropical wave that entered the eastern North Pacific on 26 July. The associated deep convection gradually became better organized as the low passed well to the south and southwest of southern Baja California. A tropical depression developed on 31 July about 850 nmi southwest of Cabo San Lucas (Figure 1a). The westward-moving system soon became a tropical storm, and it reached its estimated peak intensity of 45 kts on 1 August. Increasing easterly vertical shear and a more stable air mass brought about weakening, and Fabio decayed to a depression early on 3 August. The cyclone degenerated into a remnant low that moved westward for a couple of days before dissipating several hundred nautical miles southeast of the Hawaiian Islands on 6 August.
Back to topGilma developed from a tropical wave that moved across the tropical Atlantic and Caribbean Sea during 17-24 July and moved into the eastern North Pacific on 25 July. While the convective organization began to increase on 29 July, upper-level winds only allowed slow development. The system eventually became a tropical depression early on 1 August about 360 nmi south of Acapulco (Figure 1a). The cyclone strengthened slightly and became a tropical storm later that day. Gilma moved west-northwestward along the southern periphery of a mid-level ridge while easterly vertical shear prevented further intensification. Early on 2 August the low-level center became completely exposed and Gilma weakened to a tropical depression. The system became a remnant low early on 4 August, and the weak circulation dissipated on 5 August about 325 nmi south-southwest of Cabo San Lucas.
Back to topHector originated from a tropical wave that reached the eastern North Pacific on 10 August. A broad low pressure area developed about 375 nmi south of Acapulco on 13 August, and additional development resulted in the formation of a tropical depression late on 15 August about 650 nmi south-southwest of Cabo San Lucas (Figure 1a). The depression intensified into a tropical storm early on 16 August as it moved west-northwestward to the south of a mid-level high pressure ridge that extended from northern Mexico into the northeastern Pacific Ocean. Despite moderate north-northeasterly shear, Hector strengthened steadily and became a hurricane early on 17 August. While continuing west-northwestward, the hurricane quickly intensified, and it is estimated that Hector reached its peak intensity of 95 kts (category 2) by early on 18 August while centered about 900 nmi southwest of Cabo San Lucas. Hector remained a category 2 hurricane for about a day. Thereafter, it encountered cooler waters and westerly shear that initiated weakening. The system fell below hurricane strength by 20 August. Shortly afterward, Hector approached a weakness in the subtropical ridge near 135°W longitude, which caused a slower forward speed and a turn toward the northwest. Hector decayed to a tropical depression on 23 August, and it became a remnant low soon thereafter. This remnant circulation dissipated on 24 August about 750 nmi east of the Hawaiian Islands.
The only observation of tropical-storm-force winds was from the Barcelona Bridge (A8CJ2), which reported 35 kts winds at 0000 UTC 16 August.
Back to topIleana formed from a tropical wave that entered the eastern North Pacific on 16 August. The system gradually organized, and it developed into a tropical depression on 21 August about 300 nmi south-southwest of Acapulco (Figure 1a). Persistent mid-level ridging over Mexico steered the system on a west-northwestward to northwestward track. A weak-shear environment allowed steady intensification, and Ileana became a hurricane on 22 August. The next day, Ileana strengthened into a category 3 hurricane with estimated 105 kts winds and its eye passed about 50 nmi south of Socorro Island (Figure 5). The hurricane slowly weakened on 24 August as it reached cooler water, but its weakening was protracted due to a continuing light-shear environment. Ileana diminished to a tropical storm on 26 August and to a tropical depression the next day. Ileana became a remnant low late on 27 August about 550 nmi west of Cabo San Lucas. The remnant low drifted westward for a couple days before dissipating.
A Mexican Navy surface station on Socorro Island (35 m elevation) measured 15-min winds of 51 kts, gusting to 67 kts between 1500 and 1530 UTC on 23 August. The next day, the Cosco Panama (A8HR7) reported 41 kts winds and a pressure of 1007 hPa at 1800 UTC. However, the reliability of the latter report is uncertain.
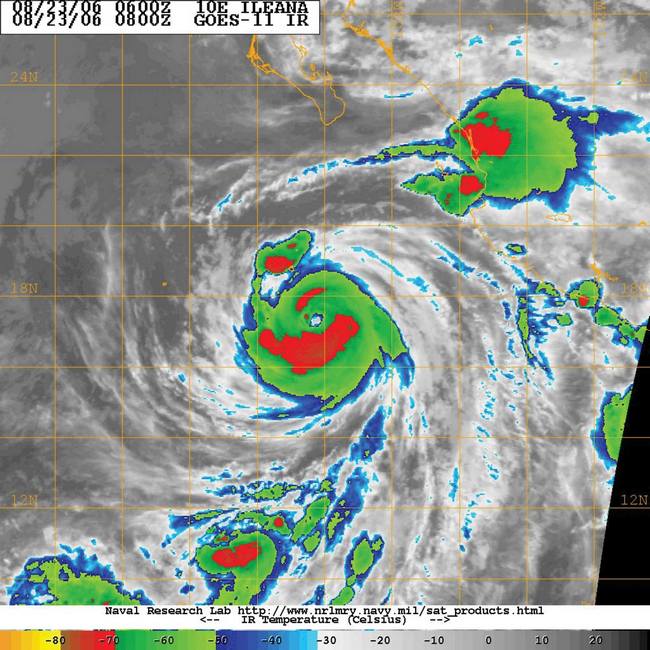
Figure 5. GOES-10 infrared image of Hurricane Ileana near maximum intensity at 0800 UTC 23 August.
Image courtesy of the Naval Research Laboratory, Monterey, CA
John can be traced back to a tropical wave that departed western Africa on 17 August and entered the eastern North Pacific one week later. The associated cloud pattern showed signs of organization almost immediately after crossing Central America. However, the subsequent development was slow. On 27 August, the convective organization again increased, and by early on 28 August the system became sufficiently well-organized to warrant its designation as a tropical depression centered about 235 nmi south of Salina Cruz, Mexico (Figure 1b). Development continued and the cyclone became a tropical storm later that day. John moved northwestward to west-northwestward at a leisurely pace for several days to the south of a weak mid-level ridge over Mexico. On this track, the center of the cyclone moved roughly parallel to, but not far offshore of, the coast of mainland Mexico. Meanwhile, an environment of weak vertical shear and a very warm ocean promoted significant intensification. John became a hurricane by 29 August and a major hurricane soon thereafter. The storm’s peak intensity of 115 kts (category 4) occurred late on 30 August.
John gradually weakened over the next day or so and fell below major hurricane status. This was probably in association with at least one eyewall replacement cycle. During this time, John’s eye came within about 50 nmi of the coastline between Manzanillo and Lazaro Cardenas early on 31 August. On 1 September, the hurricane re-intensified to category 3 status while headed toward Baja California. Late that day, the tropical cyclone turned toward the north-northwest when the mid-level ridge to the north of the hurricane weakened slightly. The eye made landfall in extreme southern Baja California at Cabo del Este, about 40 nmi northeast of Cabo San Lucas, around 0200 UTC 2 September (Figure 6) with winds estimated at 95 kts (category 2). John moved northwestward near or just inland of the eastern coastline of the Baja peninsula, with the center passing near La Paz. The cyclone then moved up the hilly Baja California peninsula while continuing to weaken; it became a tropical storm late on 2 September and a tropical depression early on 4 September. John dissipated near the east coast of the north-central Baja California peninsula later that day.
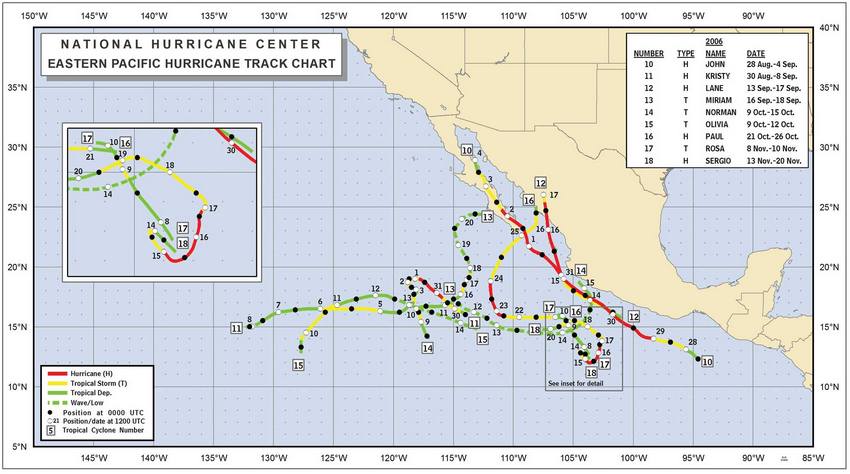
Figure 1b. Tracks of eastern North Pacific tropical storms and hurricanes of 2006: John through Sergio.
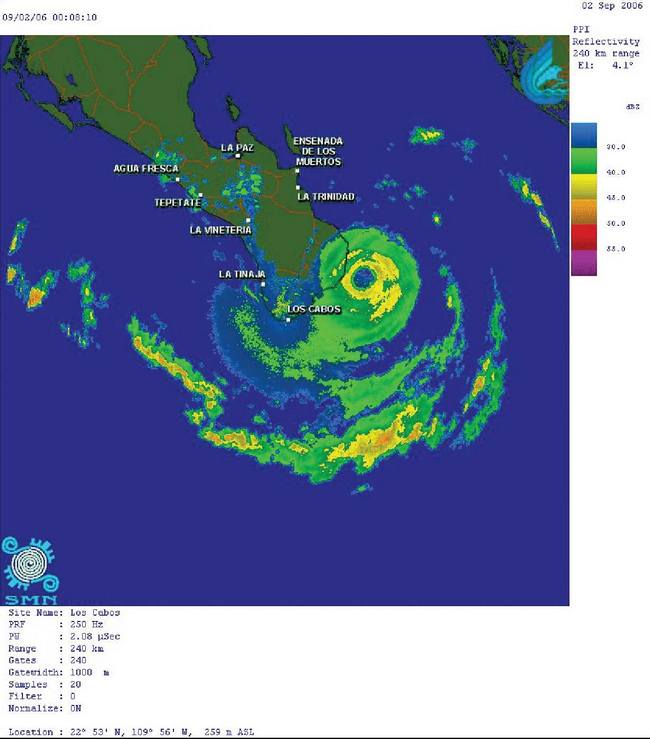
Figure 6. Image from the Meteorological Service of Mexico's Los Cabos radar exhibiting the well-defined eyewall of Hurricane John at 0810 UTC 2 September, shortly before landfall in southern Baja California.
John brought hurricane conditions to portions of the southern Baja California peninsula, although no data are available from the landfall area. The La Paz Observatory reported sustained winds of 45 kts with a gust to 57 kts at 1000 UTC 2 September. The CSL Cabo (D5XH) reported 37 kts winds and a pressure of 996.0 hPa at 0700 UTC 3 September over the Gulf of California.
Media reports indicate John caused five deaths in Baja California. Two hundred homes were reported destroyed near La Paz. Over 250 homes were reported damaged or destroyed in the city of Mulege, located on the eastern coast of south-central Baja California. Heavy rains resulted in the overflow of the Iguagil dam in Comundu, causing 4-foot floodwaters which isolated 15 towns. Winds and rains destroyed crops over large areas and killed many livestock in southern Baja California. Heavy rains and above normal tides caused damage in portions of mainland Mexico well southeast of the landfall area, and locally heavy rains and flooding extended as far north as the southwestern United States.
Back to topKristy originated from a westward-moving tropical wave that crossed Central America on 23 August. Little development occurred for almost a week until shower and thunderstorm activity became more concentrated on 29 August. A tropical depression formed early the next day about 520 nmi southwest of Cabo San Lucas, and it became a tropical storm 6 h later (Figure 1b). Moving northwestward, Kristy intensified further and became a hurricane on 31 August, reaching an estimated peak intensity of 70 kts that day. Later that day, northeasterly shear associated with the outflow from Hurricane John increased. This caused Kristy to weaken and it became a tropical storm the next day. Steering currents then collapsed, and the storm moved very slowly in a generally southward direction for the next few days. Vertical wind shear remained strong during this time and Kristy’s intensity fluctuated between tropical storm and tropical depression strength. On 4 September, a faster westward motion began, and the next day Kristy regained tropical storm status for the last time. This was short-lived, as the storm weakened to a depression on 6 September and decayed into a remnant low on 8 September. The low moved west-southwestward for a day before degenerating into a tropical wave on 9 September.
Back to topLane developed from a tropical wave that entered the eastern North Pacific on 10 September. The system slowly became better organized, and a tropical depression formed three days later centered about 100 nmi southwest of Acapulco (Figure 1b). On 14 September the depression became a tropical storm and continued to strengthen while on a track that roughly paralleled the coast of Mexico. Lane reached hurricane status the next day as it turned toward the north-northwest, its center passing about 30 nmi west of Cabo Corrientes. The system rapidly intensified, and Lane was at category 2 intensity when its center passed just west of the Islas Marias early on 16 September. Later that day, Lane became a major hurricane and turned northward, reaching a peak intensity of 110 kts (category 3). It maintained this intensity until landfall in the Mexican state of Sinaloa along the Peninsula de Guevedo, about 20 miles southeast of El Dorado (Figure 7). Lane quickly weakened to a tropical storm early on 17 September and dissipated later that day over the high mountains of western Mexico.
One observation was available from the landfall area—a temporary tower operated by the National Oceanic and Atmospheric Administration Earth System Research Laboratory at Estacion Obisbo about 10 nmi inland from the landfall location. Prior to being blown down in the eyewall, the tower measured a 1-minute wind of 81 kts with a gust to 105 kts at 1930 UTC 16 September; a sea level pressure of 966 hPa was measured at 1945 UTC. There were no reliable observations of tropical-storm-force winds from ships.
Media reports indicate that Lane was directly responsible for four deaths due to floods and mud slides. Heavy damage was reported in the landfall area in Sinaloa. Many streets and homes were flooded in El Dorado, Culiacan, and Mazatlan. Large rural areas were also flooded, severely impacting the agricultural industry. Numerous roads were washed out, isolating several communities, and a bridge between Culiacan and Mazatlan was destroyed. As seen during Hurricane John, heavy rains and above normal tides also affected portions mainland Mexico well to the southeast of the landfall area.
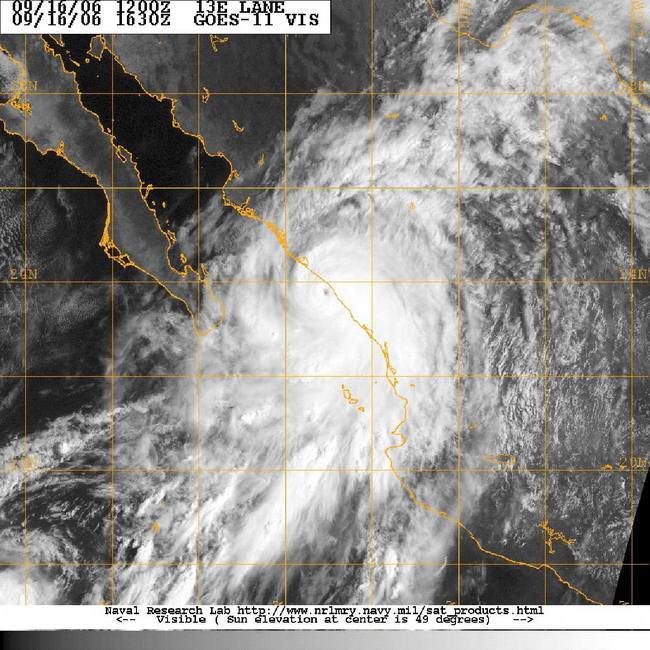
Figure 7. GOES-11 visible satellite image showing the small, well-defined eye of Hurricane Lane at 1630 UTC 16 September 2006, shortly before landfall in Mexico.
Image provided by the Naval Research Laboratory’s Marine Meteorology Division in Montery, CA.
Miriam formed from a large area of disturbed weather to the west of Hurricane Lane that was associated with a northward extension of the Intertropical Convergence Zone. The disturbed weather area gradually became organized, and a tropical depression formed early on 16 September, about 440 nmi southwest of Cabo San Lucas (Figure 1b). The depression moved northeastward and became a storm later that day, reaching its estimated peak intensity of 40 kts early on 17 September. Thereafter, northeasterly wind shear and inflow of cool stable air began to affect the storm. Miriam weakened to a depression and degenerated to a remnant low by late on 18 September. The remnants of Miriam moved generally northward before dissipating on 21 September just offshore of southern Baja California.
The Chembulk Vancouver (DGVC) reported 35 kts winds and a pressure of 1003.0 hPa at 0000 UTC 18 September. A Mexican Navy automated station on Clarion Island (60 m elevation) reported 15-min winds of 31 kts with a gust to 43 kts at 0830 UTC 17 September.
Back to topNorman originated from a tropical wave that moved into the eastern North Pacific on 1 October. The wave moved westward for about a week, first showing signs of organization on 8 October. A tropical depression formed from the wave the next day about 665 nmi southwest of Cabo San Lucas (Figure 1b). The depression became a tropical storm 12 h later as it moved north-northwestward. Norman attained an estimated peak intensity of 45 kts early on 10 October, but increasing southwesterly shear caused it to weaken rapidly to a tropical depression later that day. The cyclone turned to the east-northeast and degenerated into a remnant low on 11 October about 460 nmi southwest of Cabo San Lucas. The remnants of Norman moved generally east-southeastward for the next few days due to its interaction with a large cyclonic circulation near the coast of southwestern Mexico. On 15 October, Norman re-developed into a tropical depression on 15 October about 175 nmi south-southeast of Manzanillo, but dissipated by the end of the day just off the Mexican coast. Although the center remained offshore, Norman produced locally heavy rains in portions of southwestern Mexico. No casualties or damage have been attributed to the storm.
Back to topOlivia was spawned from a tropical wave that moved into the eastern North Pacific on 29 September. A surface low first formed on 5 October. However, only sporadic thunderstorm activity occurred in association with the low for the next few days, until the system became better organized on 9 October. Later that day, a tropical depression formed about 1180 nmi west-southwest of Cabo San Lucas (Figure 1b). The depression turned northward and became a tropical storm early on 10 October, reaching an estimated peak intensity of 40 kts later that day. Southwesterly shear caused rapid weakening of the cyclone, diminishing it to a tropical depression on 11 October. Olivia turned eastward and decayed into a remnant low on 13 October. The remnants of this system were absorbed by the large area of disturbed weather near the southwestern coast of Mexico that included the remnants of Norman.
Back to topPaul formed from a tropical wave that crossed Central America on 18 October and moved into a pre-existing area of disturbed weather over the eastern North Pacific the next day. A couple of days later, a low pressure system developed in this area, and a tropical depression formed early on 21 October about 230 nmi south-southwest of Manzanillo (Figure 1b). Moving westward, the depression became a tropical storm later that day, but further development was impeded by easterly shear. The shear decreased on 22 October and Paul began to intensify rapidly. Paul became a hurricane on 23 October and reached an estimated peak intensity of 90 kts (category 2) later that day. A large trough off the west coast of the United States turned Paul northward on 23 October. This trough also created increased westerly shear, which caused the tropical cyclone to begin weakening. The cyclone accelerated northeastward the next day as it diminished to a tropical storm. Paul was a minimal tropical storm when the center passed just south of Cabo San Lucas early on 25 October, and it weakened to a depression later that day. The depression abruptly turned northward with a decrease in forward speed as it approached the coast of southwestern Mexico, then it moved inland near the southern end of Isla Altamura, about 50 nmi northwest of Culiacán. Paul dissipated over the mountains of western Mexico shortly thereafter.
High surf from Paul caused two deaths in southern Baja California. Paul also caused significant freshwater flooding in Sinaloa, resulting in two deaths in that state.
Back to topRosa was generated from a tropical wave that entered the eastern North Pacific on 3 November. A broad low pressure area developed from this wave several hundred nautical miles south of the Gulf of Tehuantepec on 5 November. The associated convection was initially disorganized but increased and became concentrated near the center late on 7 November. This led to the formation of a tropical depression early on 8 November about 385 nmi south of Manzanillo (Figure 1b). The system moved slowly northwestward during its entire lifetime. The cyclone was in an environment of strong southwesterly shear, and Rosa was only briefly a tropical storm on 9 November before it weakened back to a tropical depression the next day. The circulation degenerated into a trough of low pressure later on 10 October about 215 nmi southwest of Manzanillo.
Back to topSergio appears to have been spawned by a tropical wave that crossed southern Central America into the eastern North Pacific on 7 November. An associated area of cloudiness and showers moved slowly westward to the south of Central America and eastern Mexico over the next several days. Showers and thunderstorms became more concentrated by 12 November, and a tropical depression formed late on 13 November centered about 400 nmi south of Manzanillo (Figure 1b). Initially moving northwestward, the cyclone stalled while strengthening into a tropical storm on 14 November. Sergio then turned toward the southeast, apparently due to the flow associated with a mid- to upper-level trough to its northeast, and continued to intensify. It became a hurricane on 15 November, and it developed a distinct and very small eye as it reached an estimated peak intensity of 95 kts later that day. The hurricane then turned toward the northeast and north-northeast and weakened due to increasing westerly shear associated with the upper-level trough. Early on 17 November, Sergio weakened to a tropical storm as the low-level circulation became partially exposed west of the deep convection. During the next few days, an area of high pressure built to the northeast and north of the tropical cyclone, forcing the system to turn toward the northwest, west, and eventually west-southwest. Although slight re-strengthening occurred on 18 November, Sergio generally weakened as persistent strong shear took its toll. The cyclone weakened to a tropical depression early on 20 November, and it dissipated later that day about 315 nmi southwest of Manzanillo.
Back to topThree depressions that did not reach tropical storm strength were observed over the eastern North Pacific during 2006 (Figure 2). Tropical Depression Two-E formed about 125 nmi southwest of Zihuatanejo on 3 June. The depression meandered eastward off the coast of Mexico for a couple of days and brought heavy rains, flash floods and mud slides over portions of the coast. The cyclone dissipated on 5 June as it interacted with land. Tropical Depression Eighteen-E formed about 135 nmi south of Manzanillo. The depression moved southwestward for a day or two and encountered unfavorable upper-level winds and a dry air mass. This caused the system to weaken to a non-convective remnant low on 28 October, about 210 nmi south-southwest of Manzanillo. Short-lived Tropical Depression Twenty-E formed on 11 November, about 565 nmi southwest of Manzanillo. It degenerated to a trough later that day.
Back to topThe cyclone summaries are based on Tropical Cyclone Reports prepared by the authors and the other Hurricane Specialists at the National Hurricane Center: Lixion Avila, Daniel Brown, James Franklin, Richard Knabb, Michelle Mainelli, Jamie Rhome, and Stacy Stewart. These reports are available on the Internet at www.nhc.noaa.gov/2006epac.shtml . Ethan Gibney produced the track maps for the tropical storms and hurricanes.