Marine Weather Review—North Pacific Area
September through December 2006
By George P. Bancroft, NOAA National Center for Environmental Prediction
Introduction
The weather pattern over the North Pacific from September into early October was more typical of late summer with cyclones tracking northeast from the vicinity of Japan into the Bering Sea and then into Alaska and included recurving tropical cycones that became extratropical. From mid-October on, the pattern became more active with the dominant storm track east-northeast toward the Gulf of Alaska or British Columbia, with cyclonic systems occasionally moving into the Bering Sea and then redeveloping in the Gulf of Alaska. The late fall and early winter period was very active with December alone having fourteen storms with hurricane-force winds.
Tropical activity in the western Pacific was concentrated in the month of September and in the first half of October, during which six named tropical cyclones appeared on OPC’s oceanic analysis charts used for radiofacsimile transmission. These headed in the direction of Japan and either recurved south and east of Japan or moved into the Sea of Japan before turning northeast and becoming extratropical. Three tropical cyclones were typhoons, including Super Typhoon Yagi, and also Ioke which came from the central Pacific at the end of August. Three tropical systems redeveloped into hurricane-force lows after becoming extratropical during this period.
Tropical Activity
Super Typhoon Ioke: Ioke, formerly a central Pacific hurricane in August, was still a super typhoon early on September 1 with maximum sustained winds of 130 kts with gusts to 160 kts near 21N 164E, moving northwest. Ioke continued weakening, and by 0000 UTC September 4 was located near 29N 150E, with maximum sustained winds down to 85 kts with gusts to 105 kts. The cyclone weakened to a tropical storm late on the 4th near 34N 147E while turning toward the northeast. The ship Arctic Sun (ELQB8 ) near 43N 147E encountered northeast winds of 40 kts at 1300 UTC September 5. Ioke then re-intensified to an extratropical hurricane-force low with a 973 hPa central pressure by 0000 UTC on the 6th (Figure 1). The ship Zim Israel (9HBG8) (41N 157E) reported south winds of 50 kts and 9.5 m seas (31 ft) at this time. Twelve hours later the ship Cosco Long Beach (A8HG2) (48N 170E) reported south winds of 40 kts, followed by a report of 7.5 m seas (24 ft) near 46N 166E at 0000 UTC on the 7th. While tracking northeast, the remains of Ioke weakened to 986 hPa twelve hours later while approaching the westernmost Aleutians, before re-intensifying to the intense 960 hPa hurricane-force low in the western Bering Sea as depicted in the second part of Figure 1. The central pressure dropped 21 hPa in the twenty-four hour period ending at 0000 UTC on the 7th. The buoy 46071 (51.1N 179.0E) reported southwest wind of 40 kts and 8.5 m seas (28 ft) at 0900 UTC on the 7th and a peak gust of 51 kts at 0800 UTC on the 7th. The same buoy reported highest seas of 11.5 m (38 ft) at 1100 UTC September 7. The Bering Sea buoy 46035 (57.1N 177.6W) reported north winds 41 kts with gusts to 56 kts and 6.5 m seas (21 ft) at 1900 UTC September 7, and highest seas 8.0 m (26 ft) ten hours later. The scatterometer image in Figure 2 reveals winds as high as 70 kts just northwest of the rapidly deepening cyclone, and winds to 55 kts on the south and north sides. This was about twelve hours prior to the time of maximum intensity as shown in the second part of Figure 1. The cyclone then weakened to a gale in the southeast Bering Sea by the 8th, entered the Gulf of Alaska the next day, and finally dissipated near Southeast Alaska on September 12.
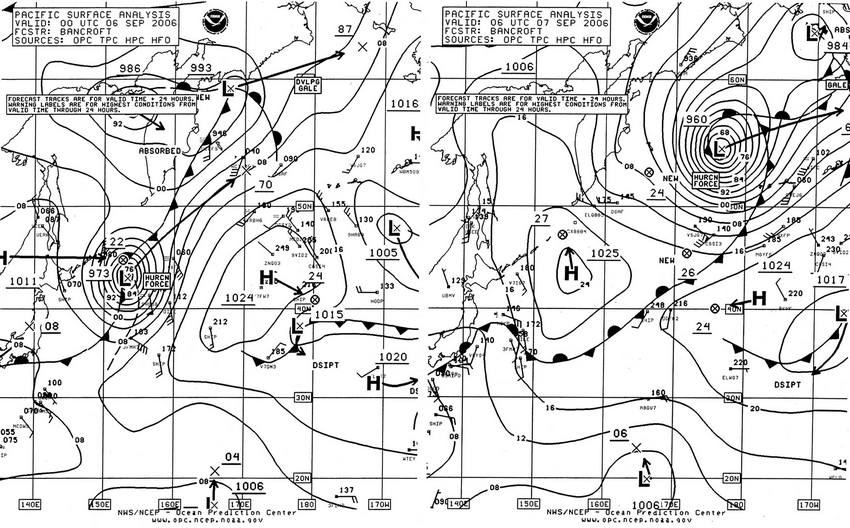
Figure 1. OPC North Pacific Surface Analysis charts (Part 2 - west) valid 0000 UTC September 6 and 0600 UTC September 7, 2006.

Figure 2. High-resolution QuikScat scatterometer image of satellite-sensed winds around the storm shown in the second part of Figure 1, valid at 1828 UTC September 6, 2006, or about eleven and one-half hours prior to the valid time of the second part of Figure 1. The resolution is 12.5 km, versus 25 km in the coarser version of the imagery. The center of the storm appears near 53N 166E.
Image is courtesy of NOAA/NESDIS /Office of Research and Applications.
Tropical Storm Shanshan: Shanshan passed near the west edge of OPC’s oceanic analysis area early on September 10 with maximum sustained winds of 40 kts with gusts to 50 kts. After becoming a typhoon west of the area the next day, Shanshan later turned north into the Sea of Japan and became an extratropical storm-force low with a 988 hPa central pressure at 0600 UTC September 19. The remains of Shanshan then weakened to a gale in the southern Sea of Okhotsk early on the 20th before dissipating southeast of the Kurile islands late on the 22nd.
Super Typhoon Yagi: Yagi formed as a minimal tropical storm near 21N 158E at 0600 UTC September 17 and initially remained nearly stationary while slowly intensifying. The ship Richard H. Matzke (C6FE5) near 22N 159E reported northeast winds of 50 kts at 0000 UTC on the 18th. Yagi then became a typhoon eighteen hours later and began to drift west while continuing to strengthen. At 0600 UTC September 21 Yagi became a super typhoon near 21N 148E with maximum sustained winds of 130 kts with gusts to 160 kts. Winds reached 140 kts with gusts to 170 kts six hours later with little change through 0600 UTC on the 22nd. Yagi then turned more northward near 142E on September 22 followed by a northeastward turn ahead of a frontal system, and maximum sustained winds weakened to 75 kts with gusts to 90 kts as the center passed near 34N 147E at 0000 UTC on the 24th. The cyclone became extratropical six hours later with a central pressure of 988 hPa, then re-intensified into a hurricane-force low with the central pressure dropping to 970 hPa when the center was near 49N 174E at 0600 UTC September 26. A high-resolution QuikScat pass near 1900 UTC September 24 revealed a compact system with winds to 65 kts just east, south and west of the center. The cyclone then turned east just south of the Aleutians and began to weaken, maintaining storm-force winds until 0600 UTC on the 27th when the center crossed 47N 177W. The weakening system then turned northeast into south-central Alaska on September 29.
Tropical Storms Bebinca and Rumbia: A gale-force nontropical low developed near 19N 154E at 0600 UTC October 3 and drifted northwest, becoming Tropical Storm Rumbia near 24N 151E at 1200 UTC October 5 with maximum sustained winds of 35 kts with gusts to 45 kts. At the same time Tropical Storm Bebinca moved into OPC’s oceanic map area near 27N 136E with maximum sustained winds of 45 kts with gusts to 55 kts. At 1800 UTC October 5 the ship CSX Enterprise (KRGB) reported northeast winds of 45 kts and 7.5 m seas (25 ft) near 32N 136E while the ship Santa Francesca (DGSR) (21N 139E) encountered southwest winds of 35 kts and 7.0 m seas (23 ft). Five hours later the ship CSX Enterprise reported northeast winds 50 kts, and later at 1300 UTC October 6 the same ship at 33N 140E reported north winds of 55 kts. Both cyclones then weakened to tropical depressions twelve hours later. Figure 3 depicts the two merging with a strong front southeast of Japan and re-intensifying into an intense extratropical low with hurricane-force winds. The second part of Figure 3 shows the storm at maximum intensity, 957 hPa, at 1200 UTC October 7. At maximum strength, this system was similar to the late-December storm in that same area (See Figures 12 and 13.). The ship CSX Enterprise (KRGB) encountered west winds of 45 kts and 11.5 m seas (38 ft) at this time, and the vessel Grafton (ZCBO5) (45N 149E) reported northeast winds of 50 kts and 14.0 m seas (46 ft) at 0600 UTC October 8. The ship APL Zircon (S6EJ7) (46N 149E) reported northeast winds of 55 kts six hours later. The cyclone subsequently moved northeast and weakened to a gale-force low near 44 153E at 0600 UTC on the 9th, before continuing on a northeast then eastward track into the southern Gulf of Alaska as a weakening gale on the 12th.
Typhoon Soulik: Tropical Depression 21W formed near 16N 157E at 0600 UTC October 9 and became Tropical Storm 21W six hours later. The cyclone then moved to 17N 154E with maximum sustained winds of 40 kts with gusts to 50 kts by 1800 UTC on the 9th, when the Japanese Meteorological Agency named it Soulik. Soulik intensified while moving northwest and became a typhoon near 23N 141E by 1200 UTC October 12 with maximum sustained winds of 65 kts with gusts to 80 kts, before turning north. Soulik attained a maximum intensity of 90 kts with gusts to 100 kts (Category 2 on the Saffir-Simpson scale of intensity—(See Reference 1) when the center passed near 24N 141E at 1200 UTC on the 13th. The cyclone then weakened to a tropical storm (34N 149E) at 0000 UTC on the 16th before becoming an extratropical gale-force low six hours later at 37N 155E, with a 988 hPa central pressure. The remains of Soulik then intensified to 980 hPa and briefly developed hurricane-force winds early on October 16 before the storm turned east-southeast and weakened. The system then redeveloped to a new center to the northeast, which developed hurricane-force winds by 1800 UTC October 17 with a high-resolution QuikScat pass showing winds to 70 kts on the south and west sides. The ship Maersk Wave (S6TV) (45N 180W) reported southwest winds of 50 kts and 10.0 m seas (32 ft) at 0600 UTC October 17. The new center developed a lowest central pressure of 960 hPa near 52N 166W at 0000 UTC October 18, a drop of 31 hPa in twenty-four hours. The ship SeaLand Reliance (WFLH) reported southeast winds of 60 kts near 51N 167W at 1800 UTC on the 17th. The storm then moved northeast and weakened to gale in the Gulf of Alaska late on the 18th, before dissipating over Southeast Alaska on the 19th.

Figure 3. OPC North Pacific Surface Analysis charts (Part 2) valid 0000 UTC October 6 and 1200 UTC October 7, 2006, showing two tropical cyclones merging and becoming extratropical. The text boxes contain information taken from the latest advisories.
Other Significant Events
North Pacific Storm, October 7-10: This developing storm initially followed an east-southeastward track from west of the Kamchatka Peninsula on October 5 to near 45N 161W at 1800 UTC October 8 before turning northeast. The center developed a lowest central pressure of 957 hPa near 49N 159W twelve hours later, when the ship (WDB9522) (54N 166W) reported northwest winds of 60 kts and 6.5 m seas (21 ft). Another ship, Taio Cosmos (ELMA6) (54N 161W), encountered northwest winds of 60 kts at 1200 UTC on the 9th , while the ship APL Philippines(WCX8884) near 50N 165W reported north winds of 50 kts and 11.5 m seas (37 ft). The cyclone re-formed to a new center to the north near the southwest Alaska coast at 1800 UTC October 9, with available scatterometer winds showing winds to 65 kts in the southeast Bering Sea near the new center. This was the first hurricane-force low that did not have tropical origins, during the four-month period. The storm system then weakened in the northeast Bering Sea by the 10th before moving inland over Alaska on October 11.
North Pacific and Bering Sea Storm, October 13-16: The next significant storm developed farther south, in the west central waters near 44N 171E late on October 13 and moved to near the central Aleutian Islands by 0000 UTC on the 15th with a 954 hPa central pressure, with the pressure dropping an impressive 38 hPa in the preceding twenty-four hours. A high-resolution QuikScat pass was available around 1900 UTC on the 14th, revealing west winds to 75 kts just south of the central Aleutians. OPC analyzed this system with a "hurricane force" descriptive label on its surface analyses between 1200 UTC October 14 and 1200 UTC October 15. The ship Western Ranger (WBN3008) near 60N 167W reported southeast winds of 60 kts at 0600 UTC on the 16th. The cyclone then weakened near the Bering Strait by the 17th.
Eastern North Pacific Storm, November 4-7: This developing storm followed a track from southeast of Japan at the start of the month to landfall over Southeast Alaska on November 7, with storm-force winds developing when the center was near 38N 161W at 1800 UTC on the 4th. Figure 4 depicts the subsequent development of this storm over a two-day period with the second part of Figure 4 showing the storm at maximum intensity in terms of central pressure. OPC analyzed the cyclone as a hurricane-force low from 0000 UTC November 6 through 0000 UTC on the 7th. No ships reported hurricane-force winds, but a high-resolution QuikScat image (Figure 5) reveals a swath of west to southwest winds as high as 65 kts south of the storm center, close to the time of maximum intensity. Table 1 is a list of selected ship and buoy observations taken during the storm. The storm then rapidly weakened inland on November 7.
Western North Pacific Storm of November 6-8: While the eastern storm described above was near its peak, this far-western storm developed rapidly while moving from the northern Sea of Japan on November 6 to the Sea of Okhotsk the next day, with the center developing a maximum intensity of 970 hPa near 50N 147E at 0000 UTC on the 8th and briefly developing hurricane-force winds just northeast of Japan near this time. At 0000 UTC November 8 the ship Leverkusen Express (DEHY) south of the Kamchatka Peninsula near 45N 159E reported southeast winds of 60 kts and 6.5 m seas (21 ft). Eighteen hours later the ship Polar Eagle (ELPT3) encountered east winds 55 kts at 50N 162E. The cyclone subsequently weakened and split, with the main center moving northwest and a new center forming near 50N 161E early on the 8th ,drifting southeast and becoming absorbed by another low passing to the south on the 12th.
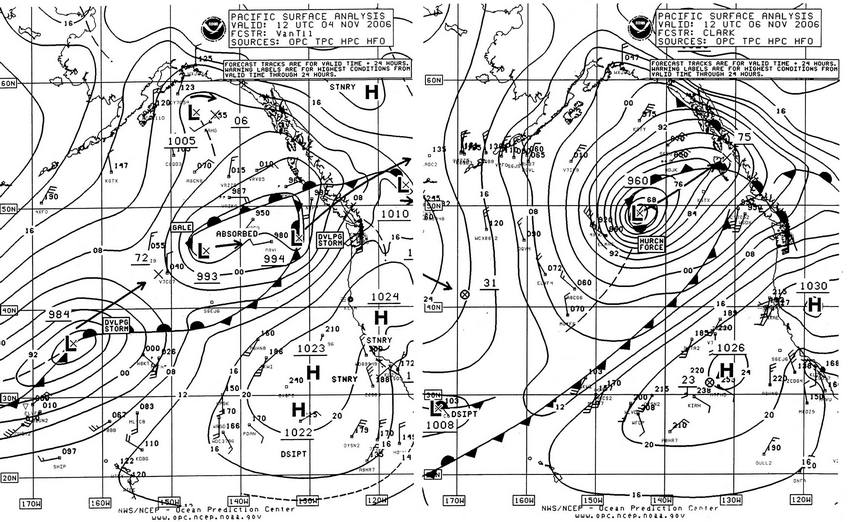
Figure 4. OPC North Pacific Surface Analysis charts (Part 1 - east) valid 1200 UTC November 4 and 6, 2006.
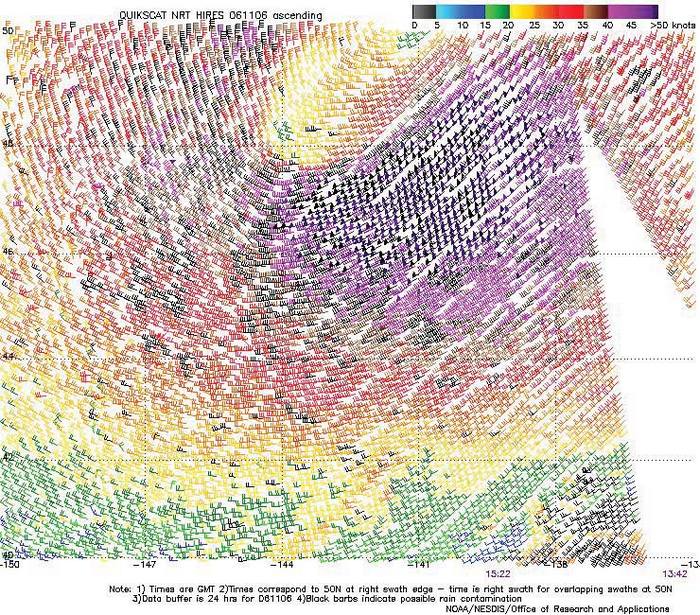
Figure 5. High-resolution QuikScat scatterometer image of satellite-sensed winds around the south side of the storm shown in Figure 4. The valid time of the pass is 1522 UTC November 6, or about three and one-half hours later than the valid time of the second part of Figure 4.
Image is courtesy of NOAA/NESDIS/ Office of Research and Applications.
| OBSERVATION | POSITION | DATE/TIME(UTC) | WIND | SEAS(m/ft) |
|---|---|---|---|---|
| Taio Cosmos (ELMA6) | 49N 149W | 06/0000 | NE 50 | 7.0/23 |
| Zim U.S.A. (4XFO) | 48N 154W | 06/0000 | N 45 | 8.0/27 |
| SeaLand Anchorage (KGTX) | 52N 139W | 06/0300 | NE 45 | |
| Taio Cosmos (ELMA6) | 48N 150W | 06/0600 | N 55 | 7.0/23 |
| Zim U.S.A. (4XFO) | 48N 150W | 06/1200 | NW 40 | 9.5/31 |
| Seabulk Pride (WCY7052) | 51N 132W | 07/0000 | SW 55 | 12.0/40 |
| Buoy 46036 | 48.4N 133.7W | 07/0000 | SW 40 | 11.5/37 |
| 07/0100 | SW 35 | 12.0/39 | ||
| Buoy 46147 | 51.8N 131.2W | 07/0600 | SW 30 | 13.0/42 |
| Buoy 46204 | 51.4N 128.8W | 07/0700 | SW 25 | 10.0/32 |
Table 1. Ship and buoy observations taken during the passage of the storm of November 4-7 in the eastern North Pacific
Northeast Pacific Storm, November 9-11: This cyclone originated south of the eastern Aleutians near 45N early on November 8 and, unlike the November 4-7 storm, underwent much of its intensification after passing 160W. The storm was otherwise similar to the other storm in strength and winds, developing a maximum intensity of 962 hPa near 54N 143W at 0000 UTC November 10. The central pressure fell an impressive 38 hPa in the twenty-four period ending at 1800 UTC on the 9th. Hurricane-force winds with this storm lasted from 1200 UTC on the 9th through 1200 UTC on the 10th. A vessel bearing the SHIP identifier reported a southwest wind of 50 kts near 48N 140W at 1800 UTC November 9. Twenty-four hours later the ship Zim China (4XFQ) reported west winds of 55 kts near 55N 148W. The system then stalled and weakened to a gale in the central Gulf of Alaska on the 11th.
Western North Pacific Storm, November 11-13: This developing storm originated south of Japan near 32N 140E late on November 10 and initially moved northeast before turning north and developed a central pressure as low as 979 hPa near 46N 146E at 0600 UTC November 12. OPC analyzed this system as a hurricane-force low from 1800 UTC on the 11th through 0600 UTC on the 12th, and again at 1200 UTC on the 13th ahead of the storm’s frontal system as it was approaching the Kamchatka Peninsula. The ship Maersk Gairloch (VQGQ4) (42N 154E) reported southeast winds of 60 kts at 0000 UTC November 12. The storm center then turned northwest into the Sea of Okhotsk by the 13th before moving inland on the 14th.
Western North Pacific Storm, November 18-20: This storm originated southeast of Japan near 33N 145E early on November 17 and moved east-northeast while strengthening, before turning north along 165E and briefly developing hurricane-force winds late on the 19th. A high-resolution scatterometer pass near 1800 UTC on the 19th revealed winds to 65 kts on the southwest and west sides of the center. The lowest central pressure of the storm was 983 hPa near 42N 165E at 0000 UTC November 20. The system then turned more east-northeast and weakened, and dissipated near the dateline late on the 21st.
North Pacific and Bering Sea Storm, November 30-December 3: This developing storm originated just east of Japan early on November 30 and moved northeast before turning more north near the dateline. At 1800 UTC December 1 the center was near 49N 178E with a central pressure of 965 hPa, after deepening by 35 hPa in twenty-four hours. The cyclone developed hurricane-force winds by this time when a high-resolution QuikScat pass revealed winds to 65 kts around the east, south and southwest sides and even an isolated 70 kts wind southwest of the center. The cyclone developed a lowest central pressure of 959 hPa six hours later before a weakening trend began. The ship Hanjin Ottawa (DANM) (53N 170W) reported a southeast wind of 60 kts at 0900 UTC December 2. Three hours prior, the ship Zim Korea (4XGU) encountered west winds of 40 kts and 12.0 m seas (39 ft). The buoy 46071 (51.1N 179.2E) reported west winds of 50 kts and 9.5 m seas (31 ft) at 0900 UTC on the 2nd. The storm center moved into eastern Russia and dissipated by December 3.
North Pacific Storm, December 2-6: This storm originated from a complex area of low pressure with multiple centers off Japan late on December 1 and consolidated into a rapidly deepening low near 42N 163E twenty-four hours later. The system developed hurricane-force winds early on the 3rd with the central pressure dropping 26 hPa in the twenty-four hour period ending at 1200 UTC on the 3rd. The ship Cho Yang Atlas (DQVH) reported south winds of 65 kts near 43N 178E at that time. The hurricane-force winds eased early on the 4th when the system redeveloped to the east and developed a lowest central pressure of 956 hPa near 49N 158W at 0000 UTC December 6. The cyclone then weakened near Kodiak Island by the 7th before becoming absorbed by another approaching storm.
North Pacific Storm, December 8-9: This developing storm moved east from northern Japan on December 7 and became a storm south of the central Aleutians on the 8th. The center developed a central pressure down to 972 hPa when passing near 48N 153W at 1200 UTC December 9, when the S/R Baytown (KFPM) reported a west wind of 75 kts near 44N 153W. The cyclone was then overtaken and absorbed by a larger storm system on the 10th.
Eastern North Pacific Storm, December 10-11: This storm originated south of Japan near 32N late on December 7 and moved east-northeast, not developing storm-force winds until reaching the eastern North Pacific near 45N 153W at 0600 UTC December 10. A high-resolution scatterometer pass from 1500 UTC on the 10th revealed a small area of west winds to 65 kts on the south side of the center near 46N 143W. The central pressure dropped 29 hPa in the twenty-four hour period ending at 0000 UTC on the 11th. The cyclone developed a lowest central pressure of 964 hPa when passing near 54N 135W at 0600 UTC December 11. Scatterometer winds near this time showed winds similar to those in Figure 7 for the next storm that followed. The ship Polar Resolution (WDJK) (50N 131W) reported southwest winds of 50 kts at 0600 UTC on the 11th. The storm then turned north and dissipated near Southeast Alaska on the 11th.
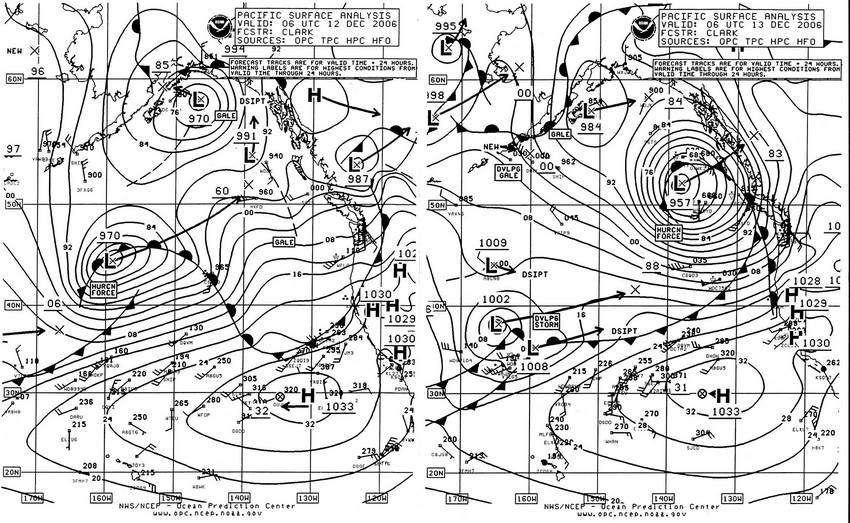
Figure 6. OPC North Pacific Surface Analysis charts (Part 1) valid 0600 UTC December 12 and 13, 2006
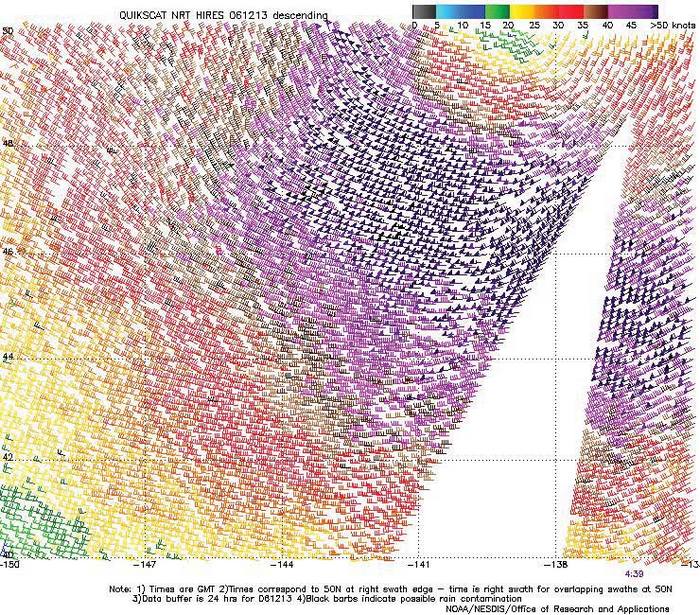
Figure 7. High-resolution QuikScat scatterometer image of satellite-sensed winds around the south side of the storm shown in Figure 6. The valid time of the pass is 0439 UTC December 13, or about one and one-half hours prior to the valid time of the second part of Figure 6.
Image is courtesy of NOAA/NESDIS/ Office of Research and Applications.
Eastern North Pacific Storm, December 10-13: This developing storm moved east-northeast from Japan early on December 9 and intensified to a storm-force low the following morning, near 39N 165E. Figure 6 displays the final stage of the development of this cyclone, from the time it first developed hurricane-force winds until maximum intensity (957 hPa) twenty-four hours later. A high-resolution QuikScat pass (Figure 7) reveals a swath of west to southwest winds of up to 65 kts with some 70 kts near 139W occurring near the time of maximum intensity. At 0000 UTC December 13 the ship Westwood Marianne (C6QD3) reported southwest winds of 50 kts near 44N 139W. Eighteen hours later the ships Polar Adventure (WAZV) (50N 132W) and the Zim Korea (4XGU) near 50N 128W both reported southwest winds of 60 kts. The cyclone then moved inland shortly thereafter.
Eastern North Pacific Storm, December 13-15: This storm followed a track east of others in the series and more strongly affected the U.S. offshore waters which extend 250 nmi off the coast. The initial weak low moved east of Japan early on December 10 and rapidly intensified when passing well south of the eastern Aleutians early on the 13th. The system developed a 993 hPa central pressure and hurricane-force winds relatively far south as it passed near 40N 156W at 1800 UTC on the 13th. The cyclone then turned northeast and maintained hurricane-force winds until reaching Vancouver Island late on December 15. Figure 8 displays the storm at its maximum intensity as it was entering the Pacific Northwest offshore waters. A high-resolution QuikScat pass valid near 0400 UTC on the 15th revealed winds to 65 kts south and southwest of the center. Table 2) lists buoy and C/MAN station observations taken as the storm was passing through the area. The storm then moved inland by the 16th.
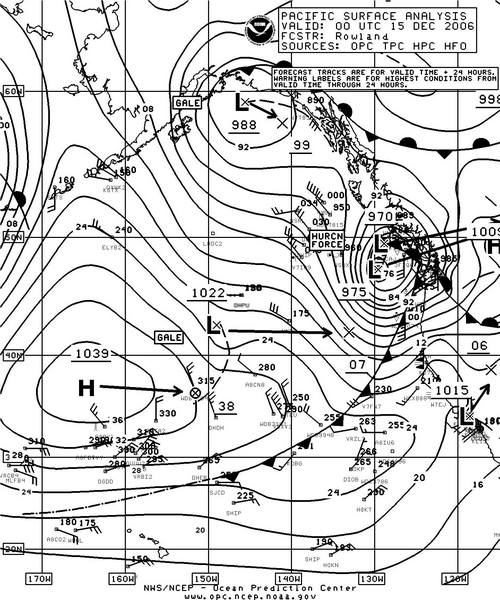
Figure 8. OPC North Pacific Surface Analysis chart (Part 1) valid 0000 UTC December 15, 2006.
| OBSERVATION | POSITION | DATE/TIME(UTC) | WIND | SEAS(m/ft) |
|---|---|---|---|---|
| Buoy 46005 | 46.0N 131.0W | 15/0100 | NW 49 G64 | 7.0/23 |
| 15/0400 | maximum 10.0/33 | |||
| Buoy 46027 | 41.9N 124.4W | 15/0200 | SW 35 G47 | 5.0/16 |
| 15/1000 | maximum 8.5/28 | |||
| Buoy 46050 | 44.6N 124.5W | 15/0300 | SW 43 G54 | 9.0/30 |
| 15/0600 | maximum 10.5/34 | |||
| Buoy 46132 | 49.7N 127.9W | 15/0600 | NW 39 G49 | 5.0/16 |
| Buoy 46029 | 46.1N 124.5W | 15/0700 | W 43 G52 | 10.0/33 |
| Buoy 46206 | 48.8N 126.0W | 15/0800 | NW 43 G54 | 5.0/16 |
| maximum 8.0/26 | ||||
| Buoy 46087 | 48.5N 124.7W | 15/1000 | W 43 G56 | 6.0/20 |
| maximum 9.0/30 | ||||
| Destruction Island DESW1 | 47.7N 124.4W | 15/0300 | S 50 G58 peak gust 70 | |
| 15/0800 | W 52 G62 | |||
| 15/0900 | peak gust 68 | |||
| Smith Island SISW1 | 48.3N 122.8W | 15/1000 | SW 45 G64 | |
| 15/1200 | peak gust 66 |
Table 2. Buoy and coastal C/MAN automated station observations taken during the passage of the storm of December 13-15, 2006.
North Pacific Storm, December 16-18: This next storm in the very active December pattern initially moved east of Japan on December 14 and tracked east-northeast, becoming a storm-force low near the dateline early on the 16th. The cyclone then turned northeast and intensified to 969 hPa near 52N 153W twenty-four hours later. The center developed a lowest central pressure of 956 hPa near 58N 146W at 0600 UTC on the 18th, when the ship SeaLand Tacoma (KGTY) reported a south wind of 75 kts near 55N 139W. The ship Hatsu Elite (VSJG7) (56N 147W) encountered west winds of 50 kts at that time. The storm moved inland and weakened by the 19th.
Eastern North Pacific Storm, December 18-20: This event was the first of three 944 hPa storms to develop in the eastern waters during the last half of December. It developed from a 995 hPa frontal wave of low pressure near 42N 169E at 0000 UTC December 18 which moved northeast while rapidly intensifying. The central pressure dropped 38 hPa in the twenty-four hour period ending at 0600 UTC on the 19th, when the center passed near 51N 153W with a 952 hPa central pressure. OPC analyzed the cyclone as a hurricane-force storm twelve hours later near 55N 151W with the pressure down to 944 hPa (27.88 in), making it the deepest of the period in the North Pacific. The ship Svend Maersk (OYJS2) (42N 146W) reported south winds to 60 kts at this time. Six hours prior to this, the ship APL Coral (S6JS) (50N 148W) encountered southwest winds of 40 kts and 11.5 m seas (37 ft). Winds to 65 kts appeared in high-resolution scatterometer data southeast of the center near 1500 UTC on the 19th. The cyclone then moved northeast and weakened rapidly upon moving inland late on the 20th.
Eastern North Pacific Storm, December 19-21: This developing storm tracked east-northeast from Japan early on December 17 and did not develop rapidly until passing east of 170W. The cyclone developed a lowest central pressure of 960 hPa near 52N 134W at 1200 UTC on the 21st after having hurricane-force winds between 1200 UTC on the 20th and 0600 UTC on the 21st. Satellite scatterometer observations revealed isolated 70 kts winds south of the center and winds to near hurricane force extending south into the Oregon offshore waters on the evening of the 20th. At 1800 UTC December 21 the ship Judith (WCX7052) (48N 133W) reported southeast winds of 55 kts. The storm then weakened, passing inland over Southeast Alaska later on the 21st.
Eastern North Pacific Storm, December 21-23: This storm initially formed near 42N 163W with a 992 hPa central pressure at 0600 UTC December 21 and intensified into a hurricane-force low near 51N 148W twenty-four hours later. The center attained a lowest central pressure of 959 hPa when passing near 56N 146W at 0000 UTC on the 23rd. Some selected ship and buoy observations taken in this storm are listed in Table 3. The ship President Polk (WRYD) reported a west wind of 65 kts near 54N 152W at that time. Six hours prior, the SeaLand Anchorage (KGTX) encountered south winds of 55 kts at 52N 133W. The system then weakened in the northern Gulf of Alaska on the 23rd as a stronger system approached from the southwest.
North Pacific Storm, December 23-25: This major storm had its origin southeast of Japan late on December 20 and like many of the other storms during the month, underwent much of its intensification after passing east of 160W. The cyclone intensified quickly from a 997 hPa sub-gale force low near 40N 165W at 0000 UTC on the 23rd to a hurricane-force low with a 959 hPa central pressure near 46N 148W at 0000 UTC on the 24th. The later stage of development of this storm is shown in Figure 9, with the storm shown at maximum intensity in the second part of Figure 9. Figure 10 is an infrared satellite image of the fully-developed storm showing deep cold-topped cloud bands associated with the strong fronts, wrapping completely around the well-defined center. The strong frontal system also is reflected in the QuikScat remotely-sensed wind data (Figure 11) revealing winds near hurricane-force even ahead of the fronts on the north and east sides, besides the 65 to 70 kts west to northwest winds found on the south and southwest sides. The hurricane-force winds with this system lasted until 1800 UTC on the 25th. The cyclone subsequently began to weaken late on December 24, with the center moving into Southeast Alaska and associated winds weakening to gale force by the 26th. Some ship and buoy observations taken in this storm are listed in Table 4.
| OBSERVATION | POSITION | DATE/TIME(UTC) | WIND | SEAS(m/ft) |
|---|---|---|---|---|
| President Polk (WRYD) | 54N 149W | 22/1700 | W 45 | 9.0/30 |
| 54N 152W | 23/0000 | NW 65 | 11.5/38 | |
| Midnight Sun (WAHG) | 51N 131W | 22/2300 | S 60 | 6.0/19 |
| Buoy 46147 | 51.8N 131.2W | 23/0000 | SE 45 | 10.0/32 |
| Buoy 46080 | 58.0N 150.2W | 23/0200 | N 40 | 9.5/31 |
| Buoy 46183 | 53.6N 131.1W | 23/0200 | SE 47 G58 | 7.0/23 |
| Maximum | 8.0/26 | |||
| Buoy 46207 | 50.9N 129.9W | 23/0200 | SE 43 G56 | 10.0/33 |
| 23/0300 | maximum | 10.5/35 | ||
| Buoy 46082 | 59.7N 143.4W | 23/0500 | E 43 G60 | 10.5/35 |
| Buoy 46185 | 52.4N 129.8W | 23/0600 | 11.5/38 |
Table 3. Ship and buoy observations taken during the passage of the storm of December 21-23, 2006.
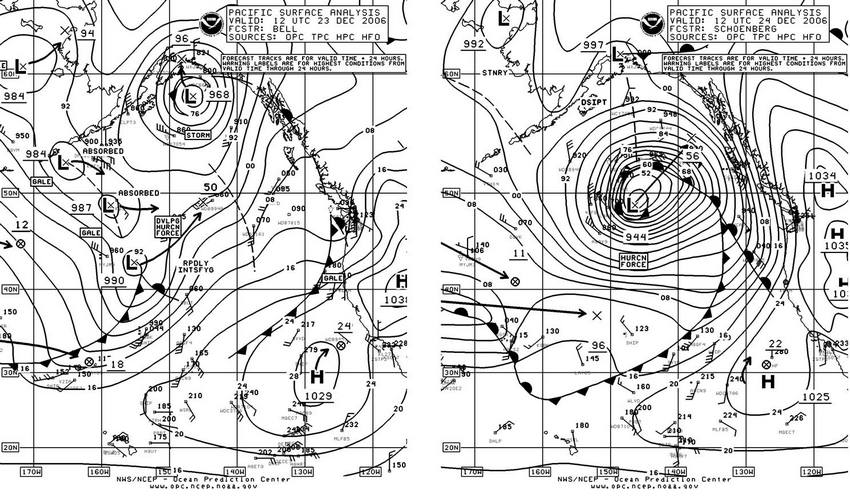
Figure 9. OPC North Pacific Surface Analysis charts (Part 1) valid 1200 UTC December 23 and 24, 2006.
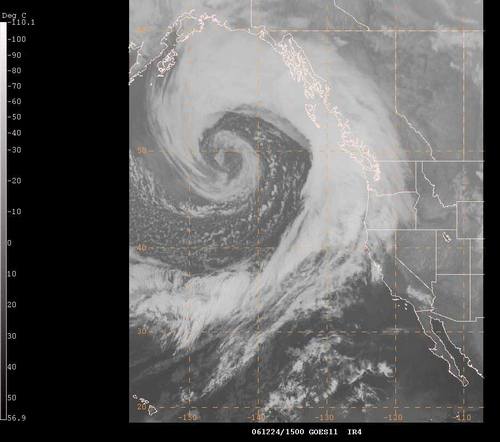
Figure 10. GOES11 infrared satellite image of the storm in Figure 9 near maximum intensity. The satellite senses temperature on a scale ranging from black (warm) to white (cold) in this type of imagery. The valid time of the image is 1500 UTC December 24, 2006, or three hours later than the time of the second part of Figure 9.
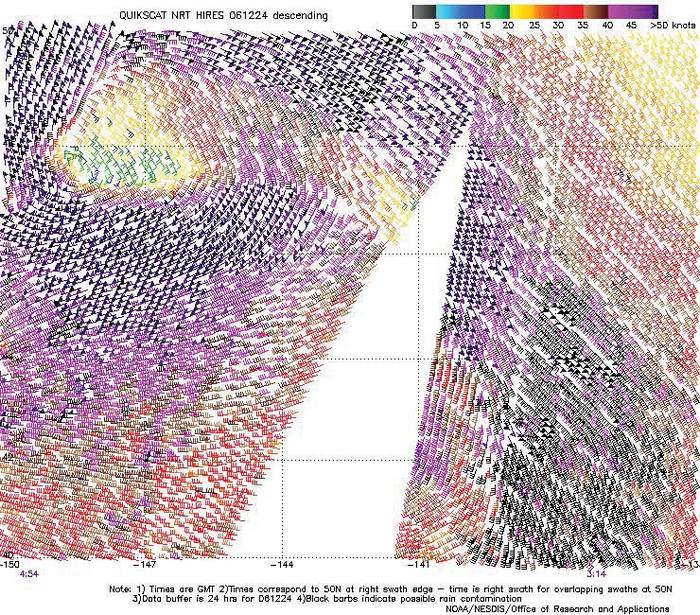
Figure 11. High-resolution QuikScat scatterometer image of satellite-sensed winds around the storm shown in the second part of Figure 10. The valid time of the pass is 0454 UTC December 24, 2006, or about seven hours prior to the valid time of the second part of Figure 10. The center of the storm is apparent in the upper left side of the figure near 48N 148W.
Image is courtesy of NOAA/NESDIS/ Office of Research and Applications.
| OBSERVATION | POSITION | DATE/TIME(UTC) | WIND | SEAS(m/ft) |
|---|---|---|---|---|
| APL China (WDB3161) | 50N 146W | 24/0600 | E 55 | 10.0/33 |
| Star Geiranger (LAKQ5) | 48N 150W | 24/1200 | NW 60 | |
| APL China (WDB3161) | 51N 149W | 24/1200 | NE 60 | 9.0/29 |
| SeaLand Tacoma (KGTY) | 53N 149W | 24/1200 | N 60 | |
| SeaLand Explorer (V7IP9) | 53N 146W | 24/1500 | NE 40 | 13.0/42 |
| Zim Italia (4XGT) | 47N 152W | 24/1800 | NW 50 | 13.5/44 |
| OOCL France (A8AV9) | 45N 148W | 24/1800 | NW 55 | 17.0/56 |
| SeaLand Explorer (V7IP9) | 53N 147W | 24/1800 | NE 50 | 9.0/30 |
| Alaskan Navigator (WDC6644) | 55N 142W | 24/1800 | E 55 | 8.0/27 |
| 54N 148W | 24/2100 | N 50 | 10.5/34 | |
| Westwood Ranier (C6SI3) | 55N 135W | 25/0000 | SE 40 | 15.5/51 |
| Buoy 46004 | 50.9N 136.1W | 25/0500 | SW 45 G58 | 10.5/35 |
| 25/0300 | maximum | 11.5/38 | ||
| Buoy 46036 | 48.4N 133.9W | 24/2200 | SW 37 G51 | 7.0/23 |
| 25/0600 | maximum | 12.5/41 | ||
| Buoy 46208 | 52.5N 132.7W | 24/1500 | SE 47 G64 | 8.0/26 |
| 25/0600 | maximum | 10.0/33 |
Table 4. Ship and buoy observations taken during the passage of the storm of December 23-25, 2006.
Eastern North Pacific Storm, December 26-27: This small and relatively compact storm was the redevelopment of a low-pressure system coming from the west, seen in the second part of Figure 9 as the 996 hPa low forecast to move into the chart area near 37N 151W. The cyclone developed northwest winds to 65 kts in high-resolution QuikScat data briefly during the evening of December 26 in the offshore waters off the northern California coast as the storm center crossed the area. The central pressure only reached 990 hPa six hours before the center moved onshore on the southern Oregon coast six hours later. Available reports from ships and buoys had only winds of gale-force or less, but reported seas were impressive. The ship British Pride (ZQTP2) (33N 119W) reported northwest winds of 40 kts and 10.0 m seas (32 ft) at 0600 UTC on the 28th, while Hatsu Smart (MLBD9) (37N 125W) encountered north winds to 25 kts but seas to 10.5 m (35 ft) mainly as northwest swell. Buoy 46059 (38.0N 129.9W) reported 9.0 m seas (30 ft) along with northwest winds of 30 kts at 0600 UTC December 27. Buoy 46028 to the southeast near 35.7N 121.9W reported north winds 30 kts and 9.0 m seas (29 ft) at 0300 UTC on the 28th.
Western North Pacific Storm, December 26-31: The development of this major storm is displayed in Figure 12. Unlike any other cyclone of this period, this low already had storm-force winds while passing initially south of Japan. The central pressure dropped 31 hPa in the twenty-four hour period ending at 0000 UTC December 28, with the cyclone attaining a central pressure of 958 hPa at that time. Some ship observations taken during this storm are listed in Table 5.
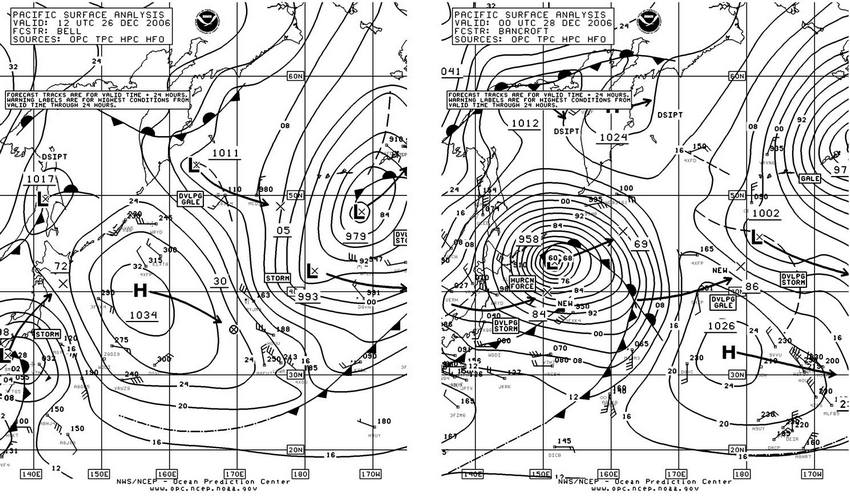
Figure 12. OPC North Pacific Surface Analysis charts (Part 2) valid 1200 UTC December 26 and 0000 UTC December 28, 2006.
| OBSERVATION | POSITION | DATE/TIME(UTC) | WIND | SEAS(m/ft) |
|---|---|---|---|---|
| SeaLand Developer (V7HZ7) | 31N 141E | 26/1200 | SE 50 | |
| 32N 142E | 26/1800 | SE 50 | 6.5/22 | |
| Arctic Sun (ELQB8) | 40N 143E | 27/1000 | NE 65 | |
| Ever Unique (3FXQ6) | 41N 143E | 27/1200 | N 55 | |
| Prairie Sky (3FXK4) | 38N 154E | 27/1200 | SE 45 | 11.5/37 |
| Green Lake (WDDI) | 33N 144E | 27/1800 | W 40 | 9.5/31 |
| Prairie Sky (3FXK4) | 38N 154E | 28/0000 | SW 40 | 12.0/39 |
| SeaLand Charger (WDB9948) | 47N 154E | 28/0600 | NE 40 | 9.0/29 |
Table 5. Ship observations taken during the passage of the storm of December 26-31, 2006.
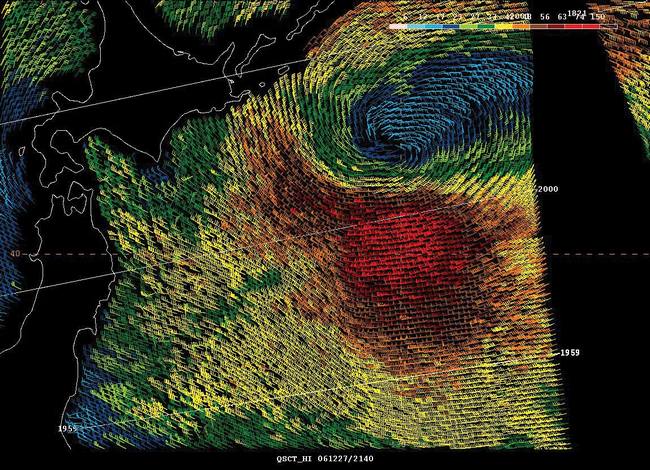
Figure 13. High-resolution QuikScat scatterometer image of satellite-sensed winds around the storm shown in the second part of Figure 12. The valid time of the pass is about 2000 UTC December 27, 2006, or about four hours prior to the valid time of the second part of Figure 12. The center of the storm is apparent in the north central portion of the figure. The diagonal numbered lines are cross-track time lines.
Figure 13 depicts some higher winds in high-resolution scatterometer data, up to 75 kts in the westerly flow south of the storm center. The cyclone subsequently moved northeast and then turned more east with the hurricane-force winds lasting into early on the 28th, but with the circulation enlarging. This led to a large storm system with a 955 hPa central pressure southeast of the Kamchatka Peninsula near 46N at the end of the month.
Northeastern Pacific Storm, December 28-30: Associated with a gale-force low over the eastern Aleutians, a secondary low formed to the southeast (39N 152W) with a 997 hPa central pressure at 0600 UTC December 28 and moved north-northeast while explosively deepening, with the central pressure falling 51 hPa in the following twenty-four hours. This was the most rapid pressure fall of the four-month period in the North Pacific. This led to the third 944 hPa low of the month in this area, located near 55N 145W at 1200 UTC on the 29th. Hurricane-force winds with this system lasted from 0000 UTC on the 29th through 0000 UTC on the 30th, with the cyclone weakening rapidly thereafter while moving into Prince William Sound, Alaska on the 31st. The SeaLand Anchorage (KGTX) reported southeast winds of 55 kts near 51N 131W at 0600 UTC December 29. Six hours later the ship Hanjin Dallas (V7JC6) encountered southeast winds of 60 kts near 58N 143W. This event marked the end of a very busy December in the North Pacific.
1. From Tropical Prediction Center website, http://www.nhc.noaa.gov/aboutsshs.shtml.