Marine Weather Review - North Atlantic Area
January to April 2016
George P. Bancroft
Ocean Forecast Branch, Ocean Prediction Center, College Park,
MD
NOAA National Center for Environmental Prediction
Introduction
The author considers this four month period the second half of the heavy weather season when hurricane force lows are most likely. January is normally the most active month in North Atlantic (VonAhn and Sienkiewicz, 2005), this year February produced 11 hurricane force lows versus nine in January. The numbers then declined later in the season to six in March and two in April. The period featured mainly a progressive pattern of developing cyclones moving from southwest to northeast across the North Atlantic toward Greenland and Iceland. Some of the cyclones, especially in January, took a more northerly track toward the Labrador Sea and Davis Strait; at times, moving erratically. Five cyclones developed central pressures below 950 hPa through March, with most of these occurring in January and the beginning of February. There were several noteworthy events over the southwestern waters in which cyclones developed rapidly off the U.S. East Coast, especially from January to early March.
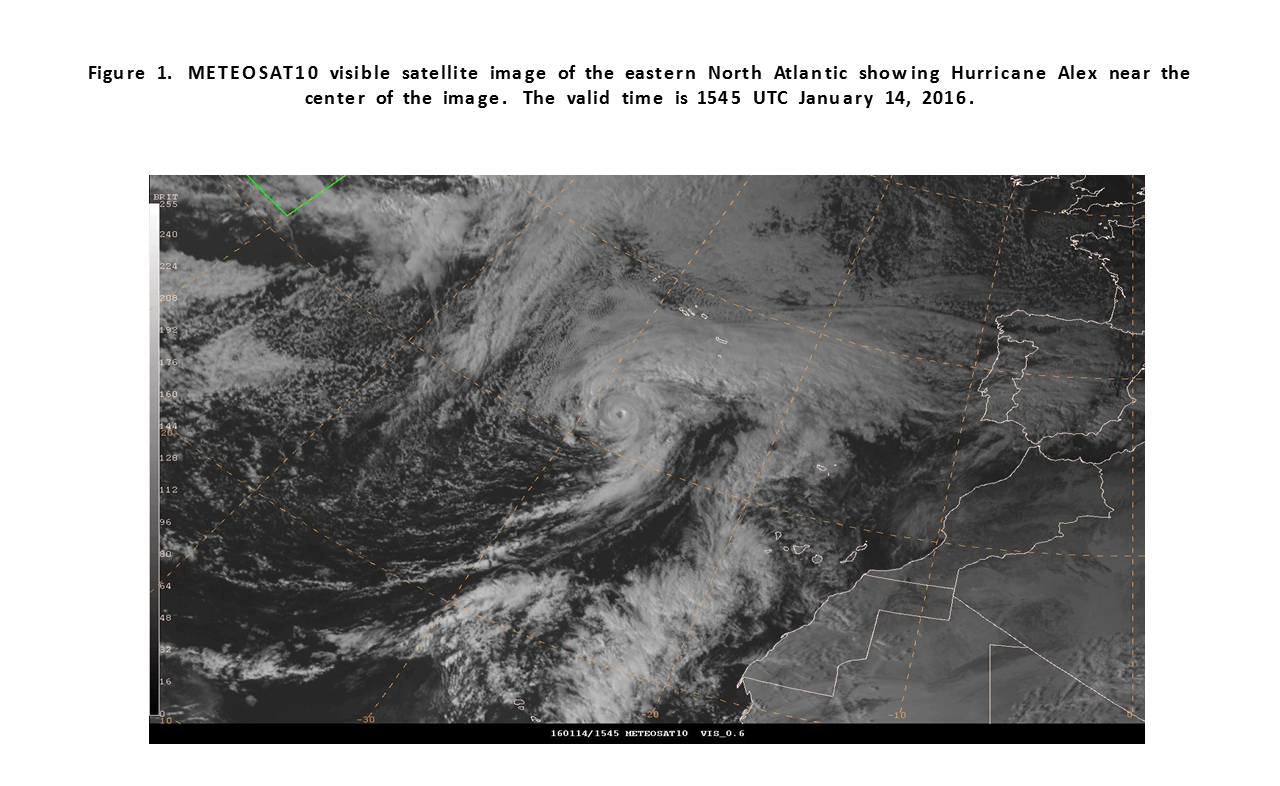
Tropical cyclones are rare during this period, but Hurricane Alex developed in mid-January in subtropical waters south of the Azores. Alex was the first tropical or subtropical cyclone to form in January since an unnamed storm formed in 1978, and only the fourth in the record going back to 1851, (Reference 5).
Tropical Activity
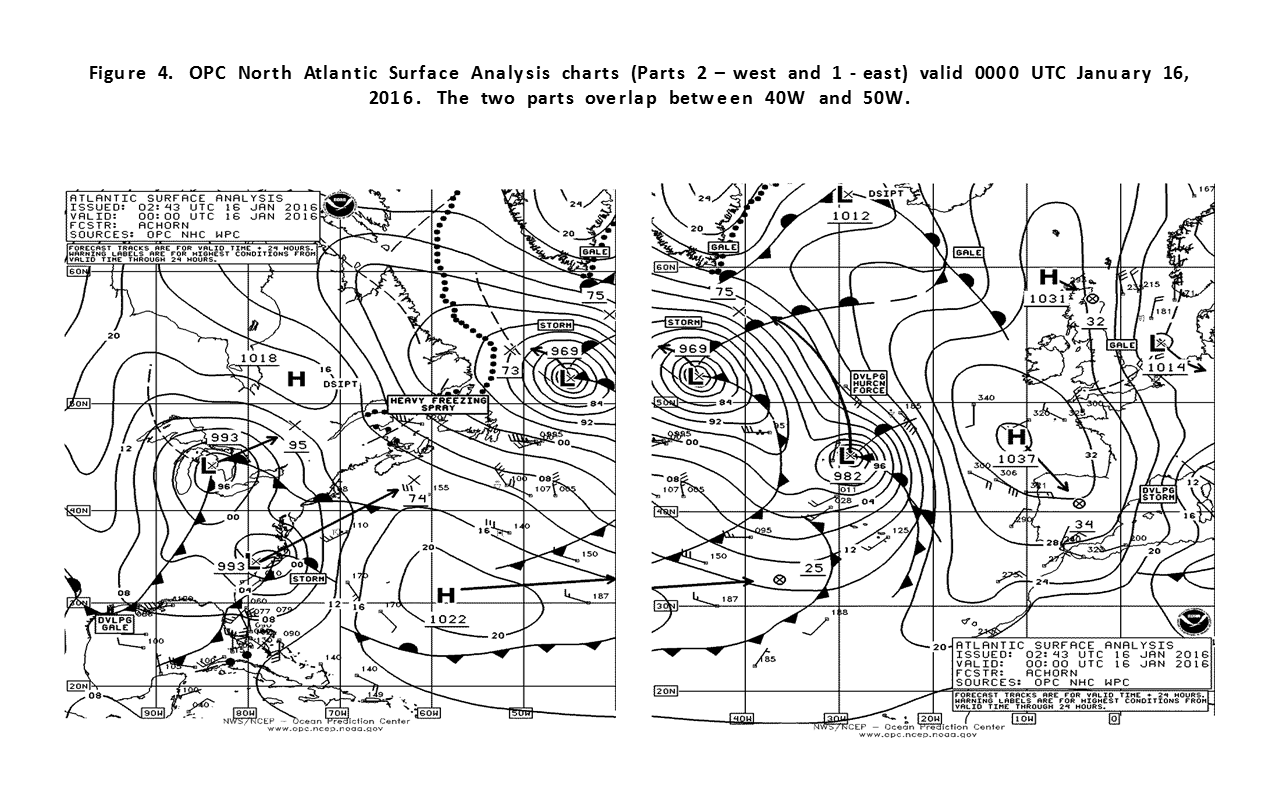
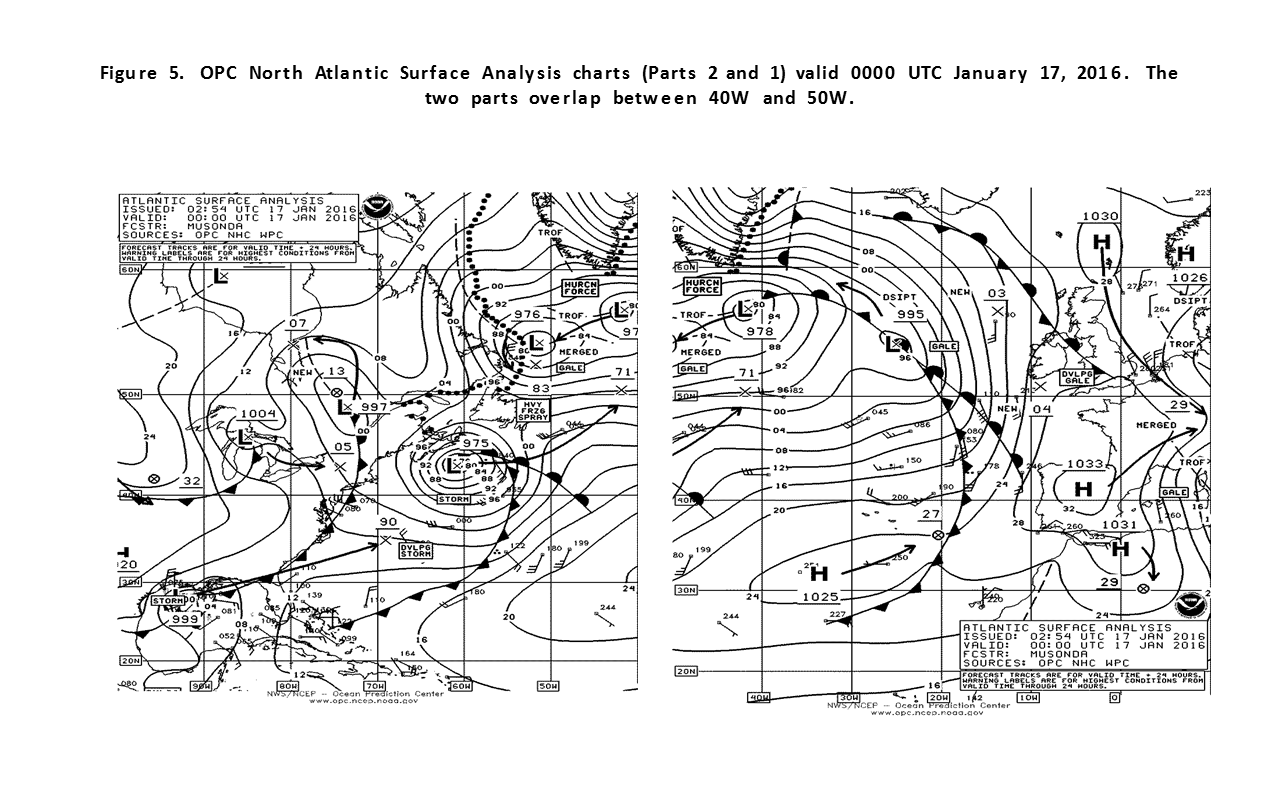
Hurricane Alex: Alex appeared to have origins as a non-tropical low which moved northeast from the Bahamas early on January 6th, then turned east across Ocean Prediction Center's southern waters and developed into a relatively compact hurricane force low pressure, late on the 9th with a 992 hPa center near 35N 56W. The ST. LOUIS EXPRESS (WDD3825) reported northeast winds of 45 kts and 8.5 m seas (28 ft) near 37N 55W at 1800 UTC on the 9th. The top winds weakened to storm force the following day before the low attained a lowest central pressure of 982 hPa near 31N 44W at 0600 UTC on the 11th. The cyclone then tracked southeast to well southwest of the Azores near 25N 35W late on the 12th while maintaining gale to storm force winds, gradually losing its frontal structure. The National Hurricane Center declared it Subtropical Storm Alex at 2100 UTC on the 13th near 27N 31W with maximum sustained winds of 45 kts and gusts to 55 kts. Alex became a hurricane the next day near 32N 28W (Figure 1 ) with the eye quite visible, with maximum sustained winds of 75 kts with gusts to 90 kts, which is a Category 1 on the Saffir- Simpson scale (Reference 4). Alex then moved north and weakened to a tropical storm the next day before becoming extratropical near 45N 29W (Figure 4). The ship BATFR17 (38N 24W) reported southeast winds of 40 kts and 9.8 m seas (32 ft) at 1500 UTC on the 15th. INDEPENDENT VOYAGER (A8XY2) reported southeast winds of 50 kts near 49N 21W at 0600 UTC on the 16th. Post Tropical Alex then turned northwest and became a hurricane force low south of Greenland 0000 UTC on the 17th before looping back to the southwest (Figure 5). The cyclone then became absorbed by a developing low moving off the East Coast on the 18th (Figure 4 and Figure 5 ) on the 18th.
Other Significant Events of the Period
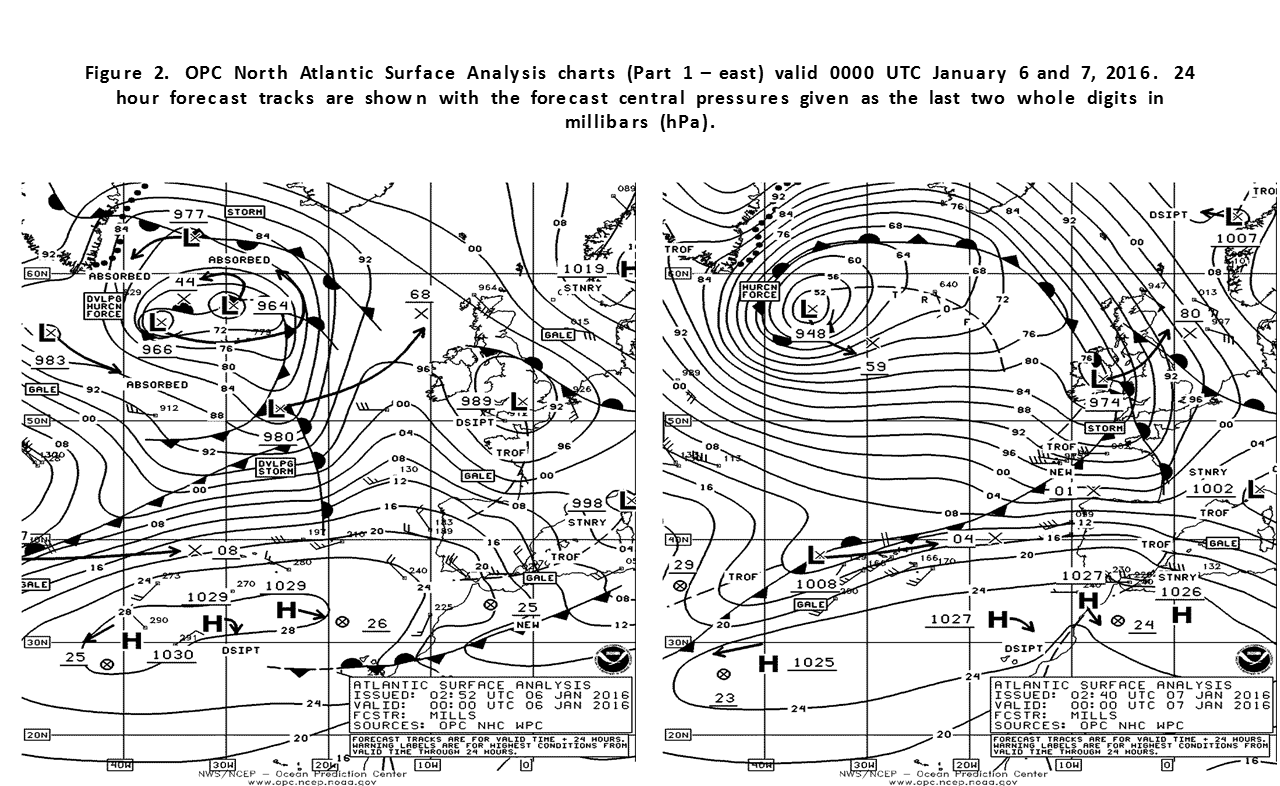
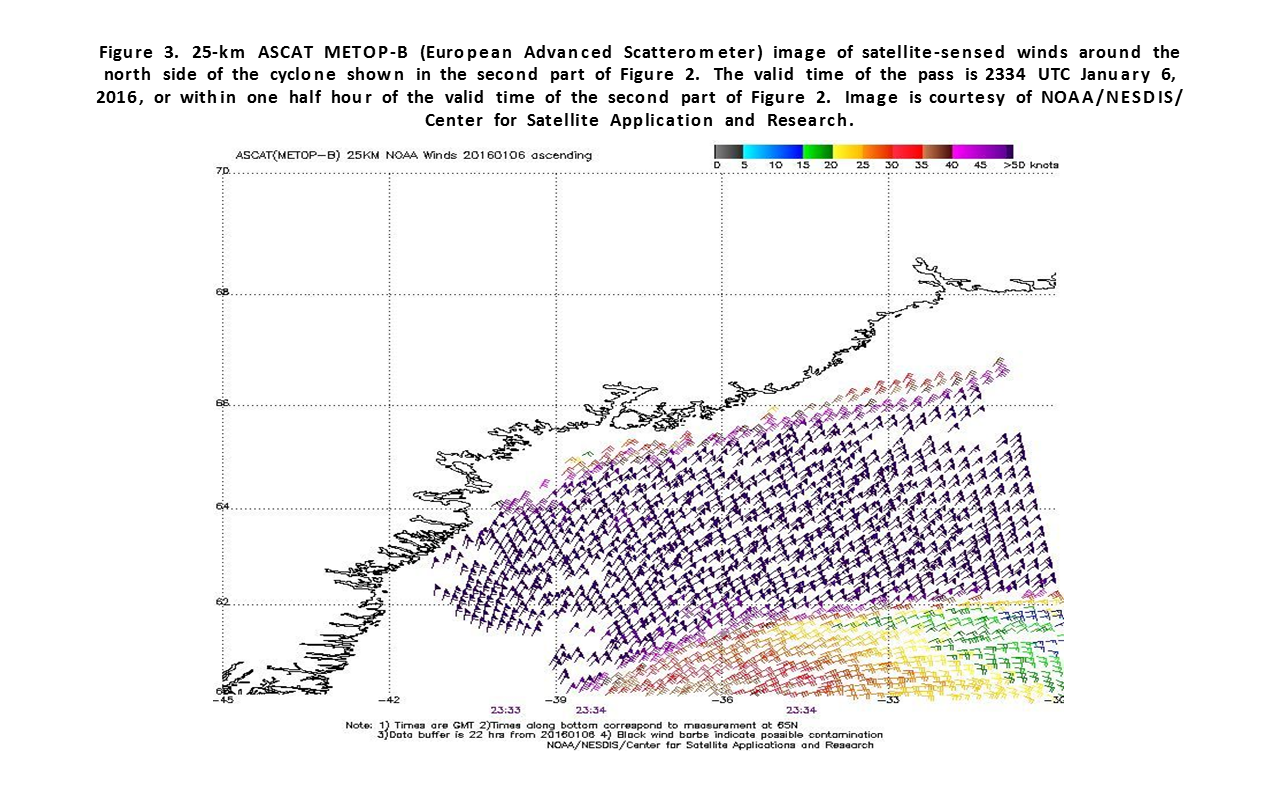
North Atlantic Storm / Greenland area, January 5-9: This cyclone began as a new development on a front near 56N 30W at 1800 UTC January 5th and Figure 2 shows the subsequent strengthening and consolidation into a 948 hPa hurricane force low, one of the deepest of the period. Figure 3 shows widespread 50 to 60 kts winds north of the occluded front retrieved by the ASCAT-B scatterometer. Not shown, these winds also extended south of Greenland along the front. The cyclone then drifted back to the southeast the next day with a weakening trend.
North Atlantic Storm, January 14-16: The initial development was as a new low south of Newfoundland near 41N at 0000 UTC on the 15th followed by rapid intensification over 24 hours, with the central pressure falling 36 hPa. Figure 4 and Figure 5 shows the cyclone east of Labrador turning northwest. It developed a lowest central pressure of 964 hPa 12 hours later and hurricane force winds later that day before stalling and becoming absorbed by Post Tropical Alex the following night.
North Atlantic Storm, January 15-17: Figure 4 and Figure 5 also show an intensifying storm moving offshore from the southeast U.S. coast. The MAERSK DENVER (WMDQ) reported west winds of 50 kts and 8.0 m seas (26 ft) near 38N 57W at 1200 UTC on the 17th. Buoy 44141 (43.0N 58.0W) reported northwest winds of 47 kts with gusts to 62 kts and 9.5 m seas 31 ft) at 0800 UTC on the 17th. The cyclone briefly developed hurricane force winds while passing near 46N 51W at 1200 UTC on the 17th. The cyclone then headed northeast toward the east Greenland waters and weakened, except for briefly developing hurricane force winds while passing near Greenland late on the 18th.
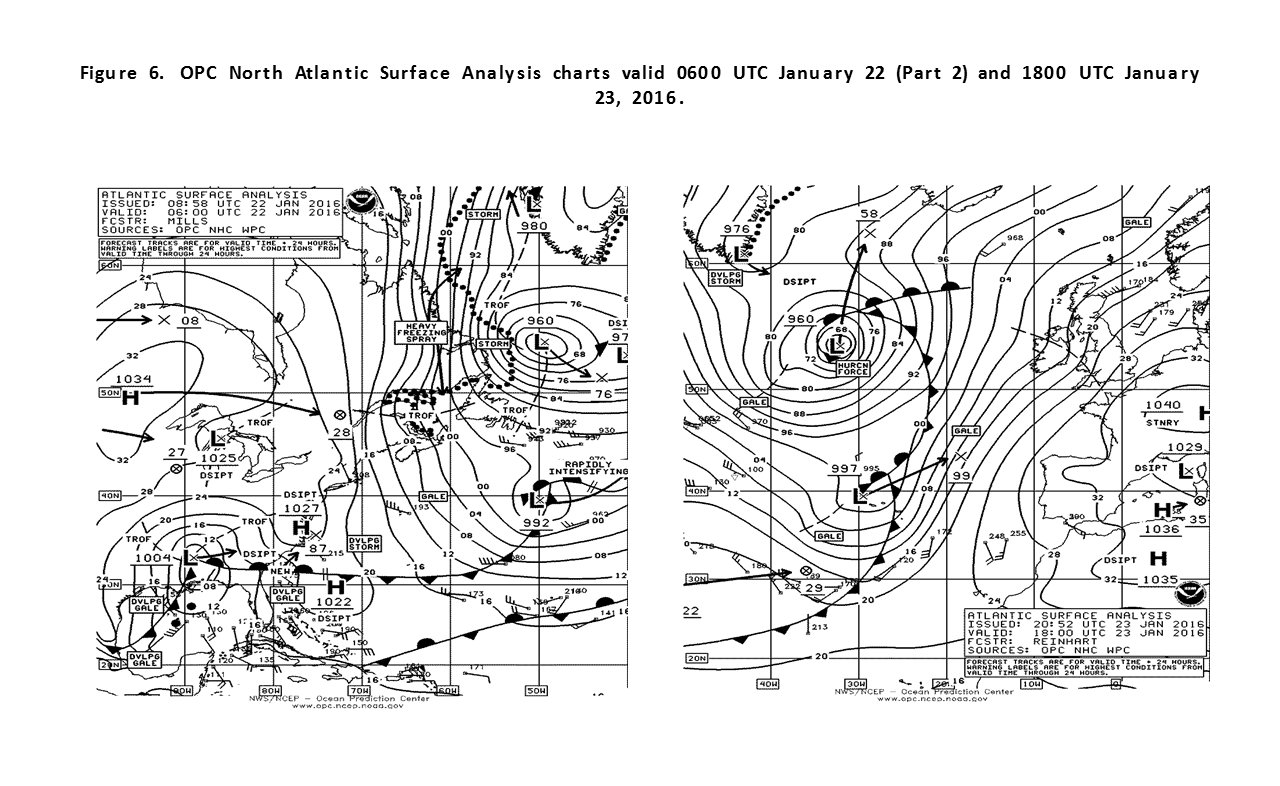
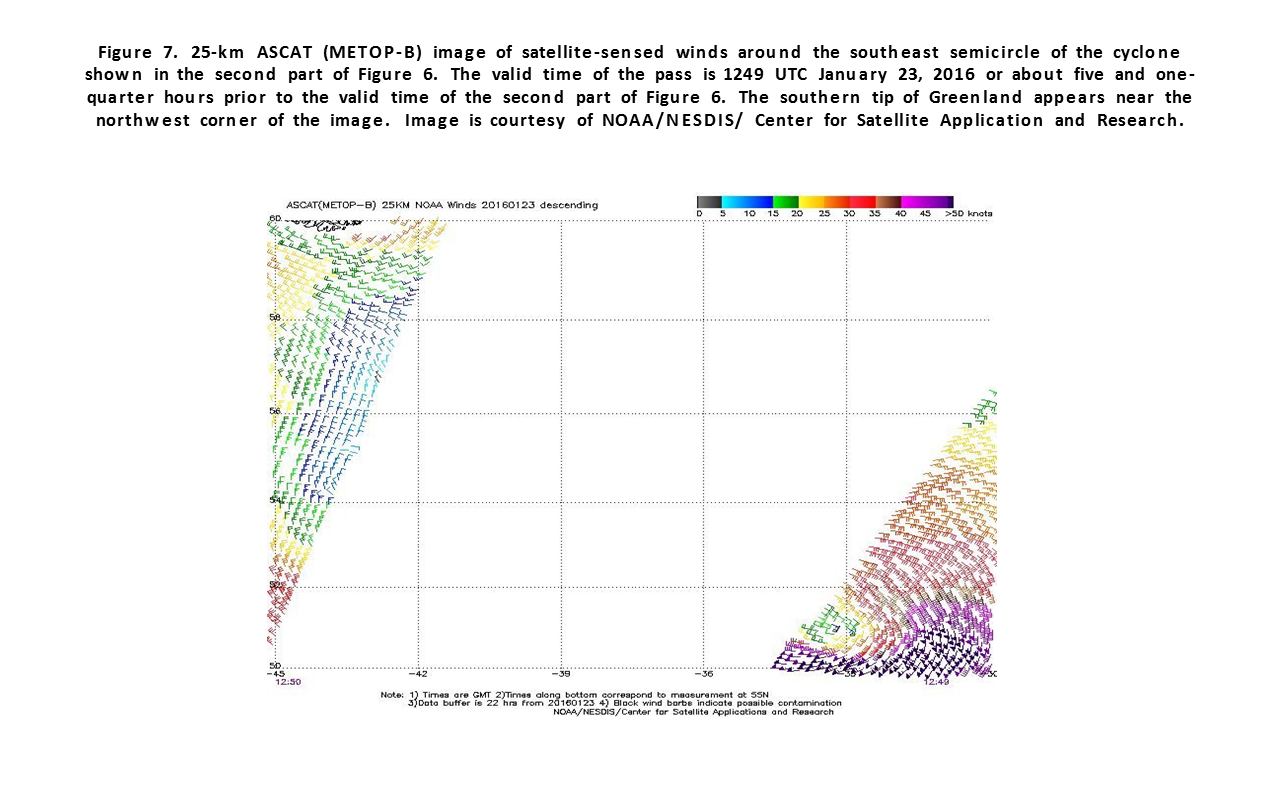
North Atlantic Storm, January 22-25: The development of this cyclone over a 36 hour period is depicted in Figure 6. The cyclone developed hurricane force winds on the night of the 22nd which continued to 0000 UTC on the 24th when it developed a lowest central pressure of 957 hPa. Figure 7 is an ASCAT pass showing wind retrievals of up to 60 kts in the south semicircle of the low. The EVER UNITY (3FCD9) encountered west winds of 45 kts near 33N 54W at 0600 UTC on the 22nd, and seas of 9.5 m (31 ft) six hours later, near 33N 55W. The cyclone subsequently turned toward the north, passing near Iceland late on the 24th.
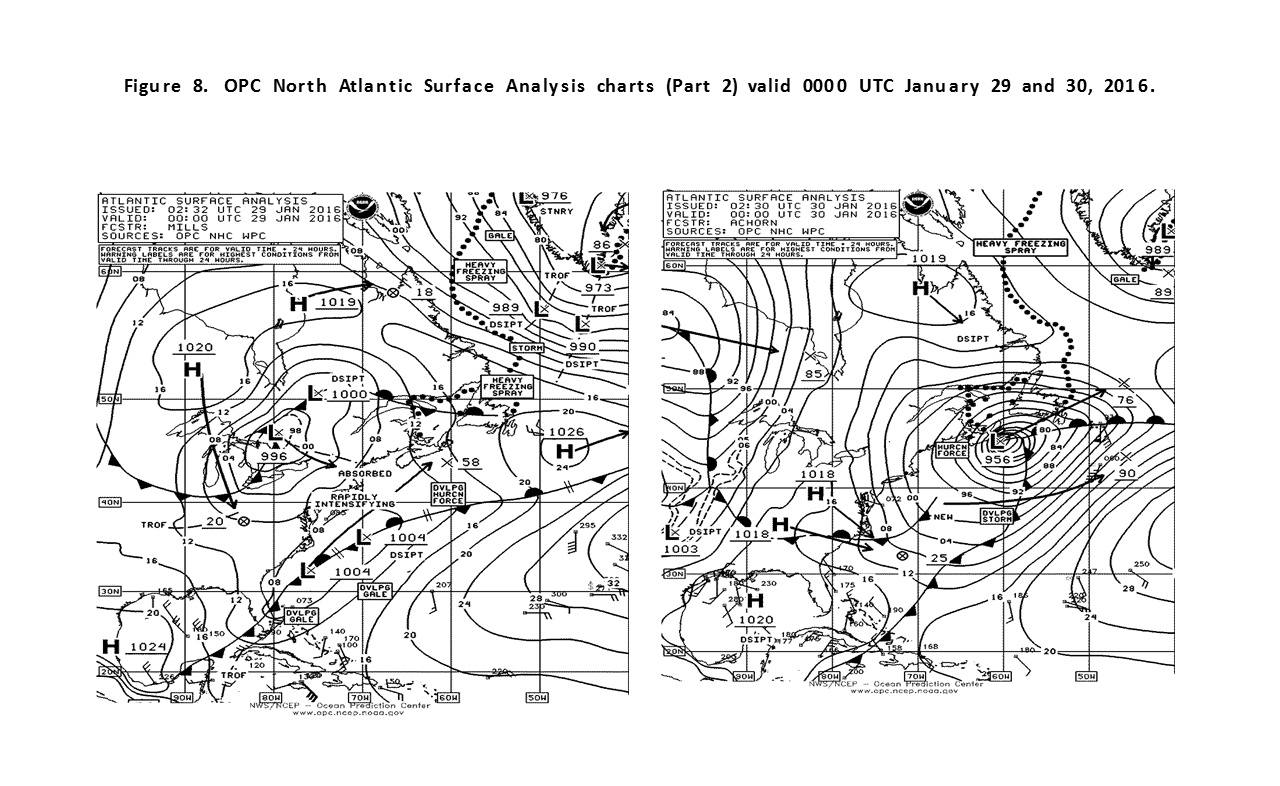
Western North Atlantic Storm, January 29-31: Figure 8 shows the explosive development of a hurricane force low from a flat frontal wave over only a 24 hour period. The central pressure fell 36 hPa in the 24 hour period ending at 1800 UTC on the 29th. From Sanders and Gyakum (1980) this would be well within the requirement for this cyclone to be called a "bomb". THEBAUD PLATFORM (CFO383, 43.9N 60.2W) reported southwest winds of 53 kts with gusts to 63 kts at 2300 UTC on the 29th. Buoy 44139 (44.2N 57.1W) reported southwest winds of 49 kts with gusts to 66 kts and 9.0 m seas (30 ft) four hours later, followed by a report of 13.0 m (43 ft) two hours later. The cyclone weakened as it passed northeast of Newfoundland on the 30th and became absorbed on the 31st.
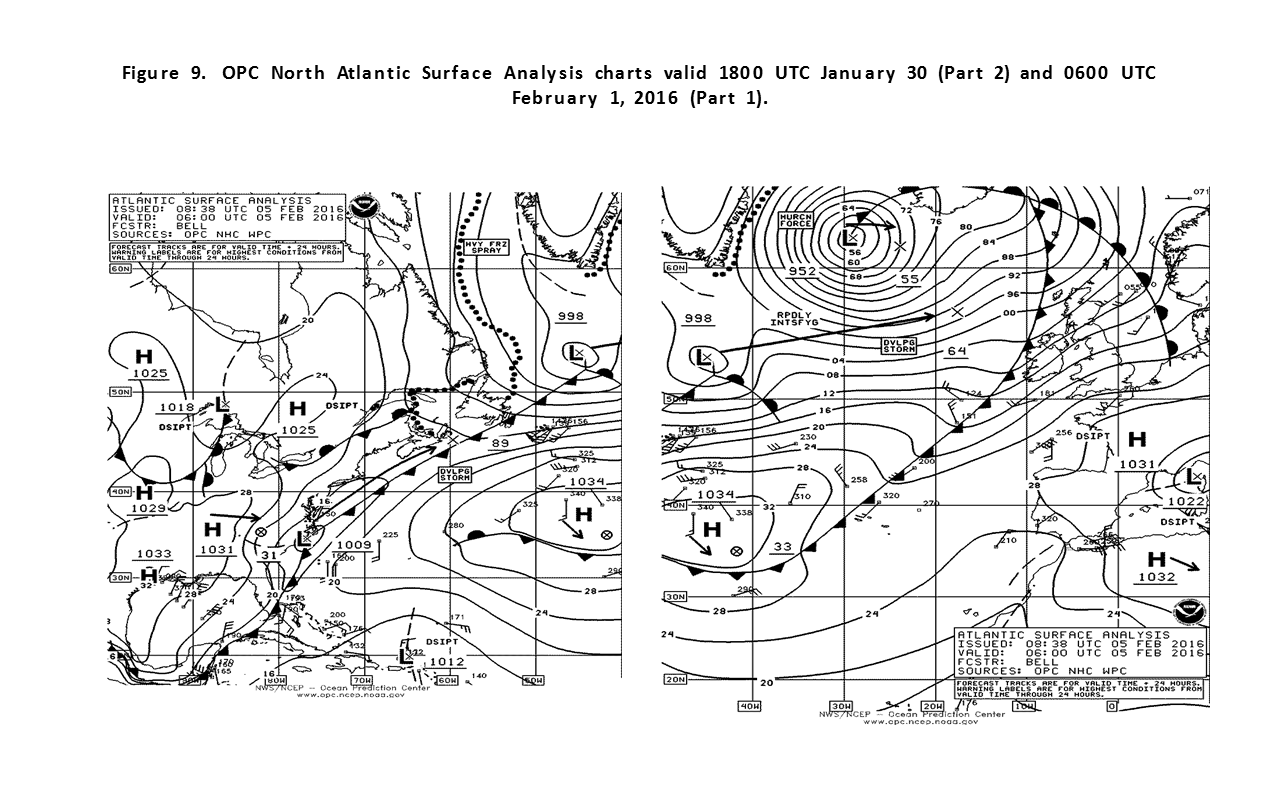
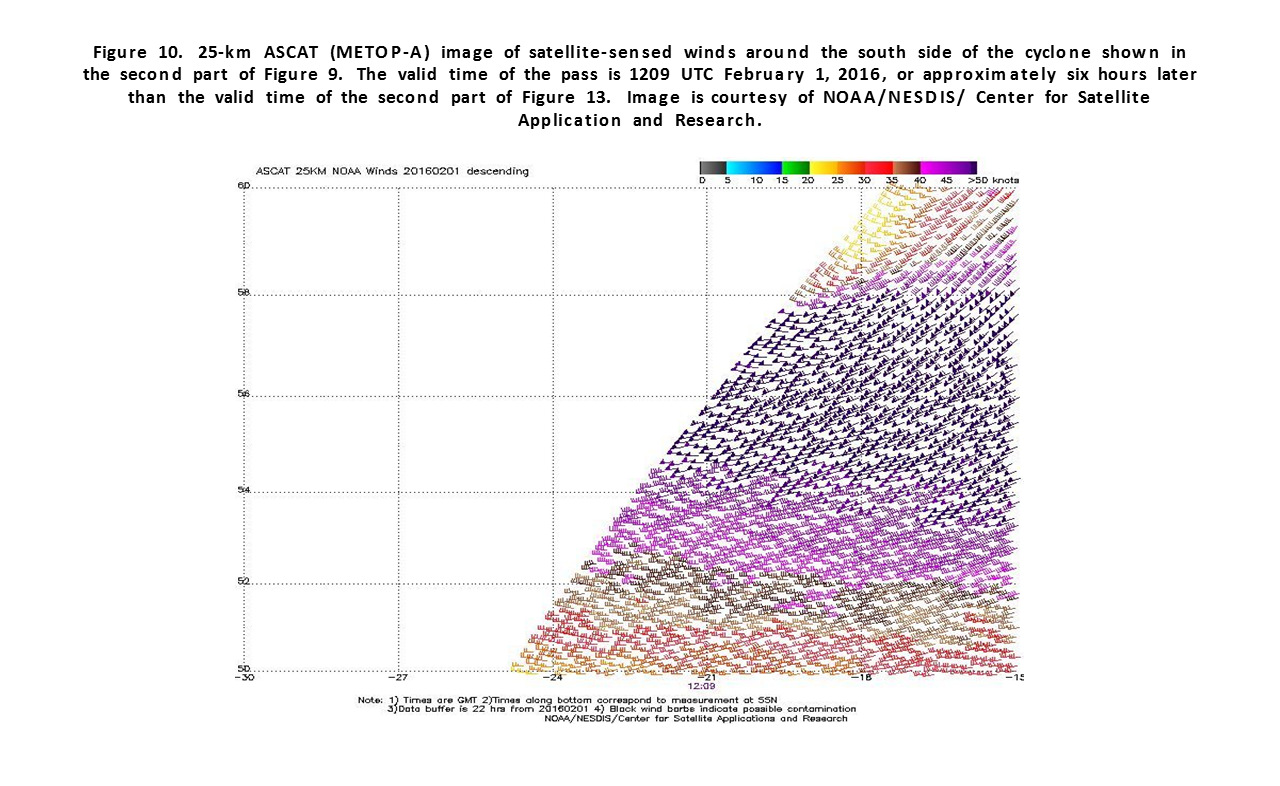
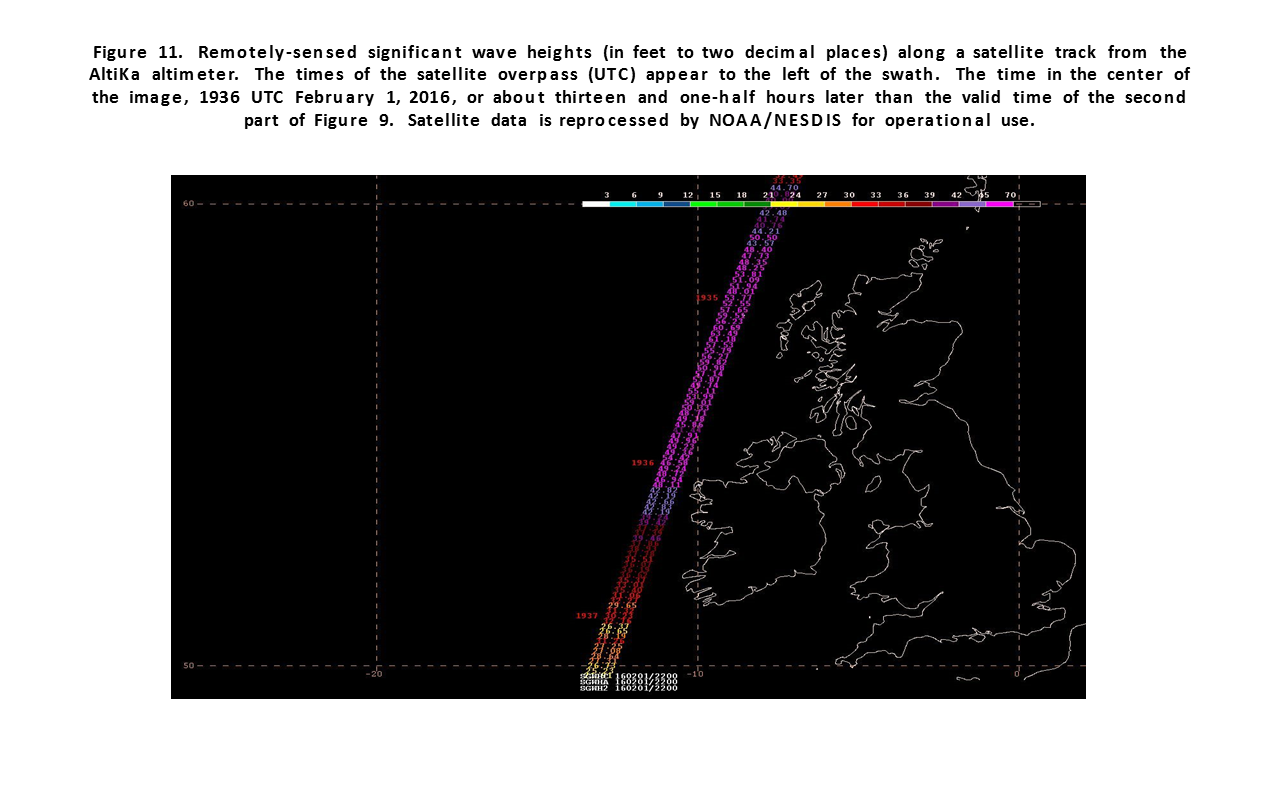
North Atlantic Storms, January 28 to February 2: A pair of strong lows of similar intensity moved northeast to north of the British Isles during this period. The first one formed in the Labrador Sea on the 28th and tracked northeast, developing a lowest central pressure of 949 hPa and hurricane force winds near 63N 2W at 1200 UTC on the 29th. The central pressure fell 38 hPa in the preceding 24 hours. At 1300 UTC on the 29th the ship BATEU08 (59N 2E) reported west winds of 60 kts. Buoy 64046 (60.5N 4.2W) reported west winds of 48 kts with gusts to 65 kts and 9.5 m seas (31 ft) at 1200 UTC on the 29th. Oil platforms in the northern North Sea reported west to southwest winds up to 71 kts and seas up to 14.0 m (46 ft) (at 63104, 61.2N 1.6E). The cyclone proceeded northeast through the Norwegian Sea late on the 29th. The next development was a new low forming south of Newfoundland on the 30th and moving to south of Iceland with a lowest central pressure of 945 hPa early on February 1st (Figure 9). This was the deepest low of the period. The central pressure fell 45 hPa in the 24 hour period ending at 0000 UTC on the 1st. The ASCAT pass in Figure 10 returned a swath of west to southwest winds of 50 to 60 kts west of the British Isles. Buoy 62105 (55.2N 12.7W) at 1700 UTC on the 1st reported west winds 47 kts with gusts to 61 kts and 15.0 m seas (50 ft), and a gust of 64 kts nine hours earlier. Altimeter data in Figure 11 reveal seas as high as 63.5 ft (19.5 m) west of Scotland. The cyclone then moved east into southern Norway early on the 2nd.
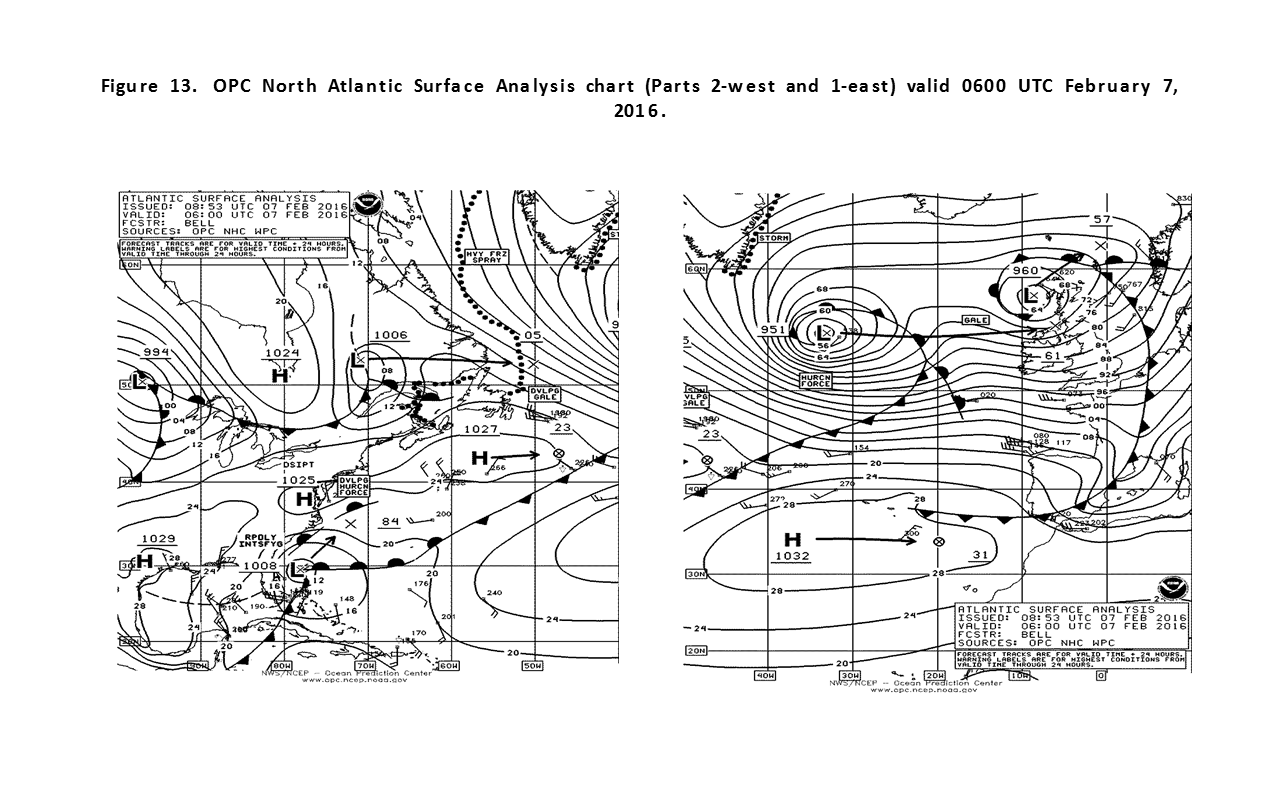
North Atlantic Storms, February 2-6: February was a stormy period, beginning with three systems moving northeast into the northern waters. The first one moved from inland over eastern Canada on the 1st to the northern Labrador Sea the next day, where it briefly developed hurricane force winds at 1800 UTC on the 2nd before drifting east and spawning a new low east of Greenland on the night of the 3rd. The new low quickly took over as the main low by early on the 5th (Figure 12). Its central pressure fell 37 hPa in only 18 hours. The cyclone subsequently drifted east and then south with Figure 13 indicating a new intense low taking over. This new storm originated off the New England coast late on the 5th and while tracking northeast its central pressure fell 41 hPa in the 24 hour period ending at 0000 UTC on the 7th. An ASCAT-A pass from 2134 UTC on the 7th revealed a swath of west winds 50 to 60 kts on the south side similar to Figure 10 from an earlier event. HIBERNIA PLATFORM (VEP717, 46.7N 48.7W) reported west winds of 69 kts and 7.0 m seas (23 ft) at 0600 UTC on the 7th, at a height of 139 m. above sea level. The cyclone weakened while passing across northern Scotland late on the 8th.
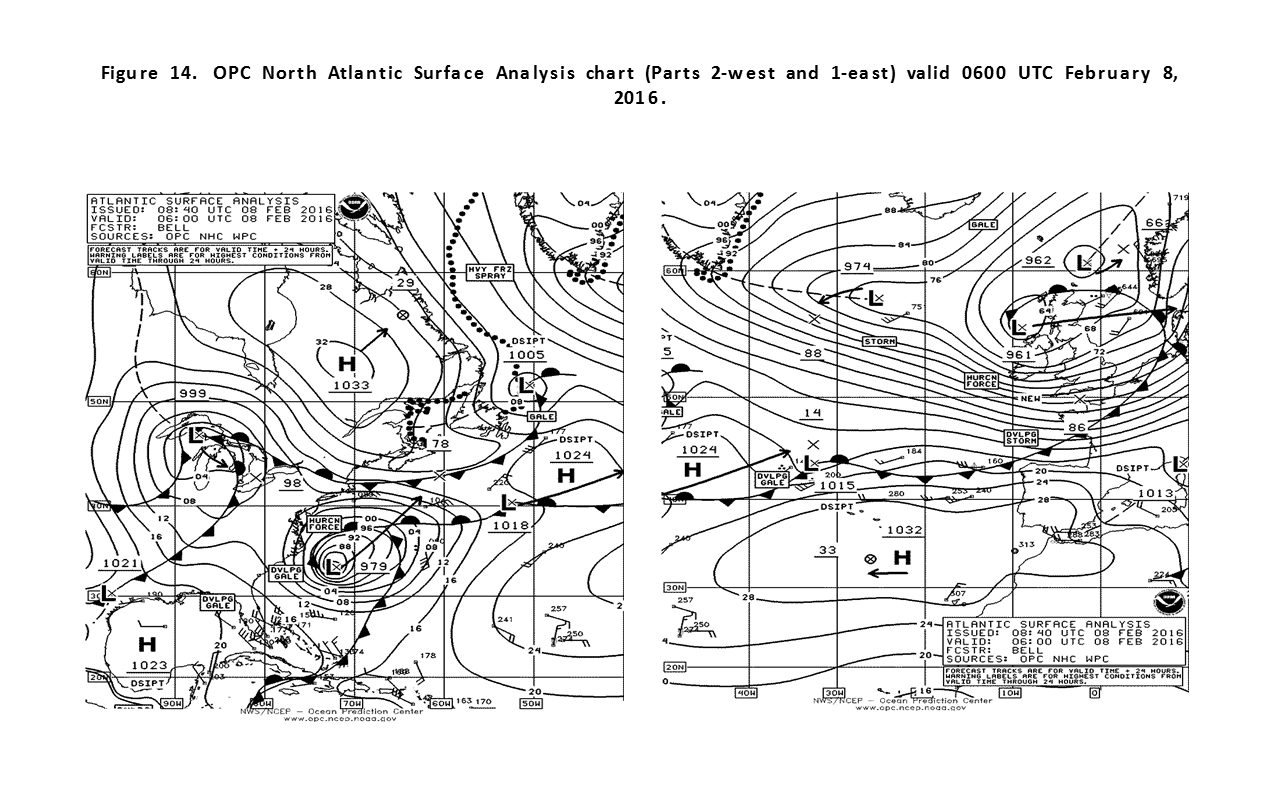
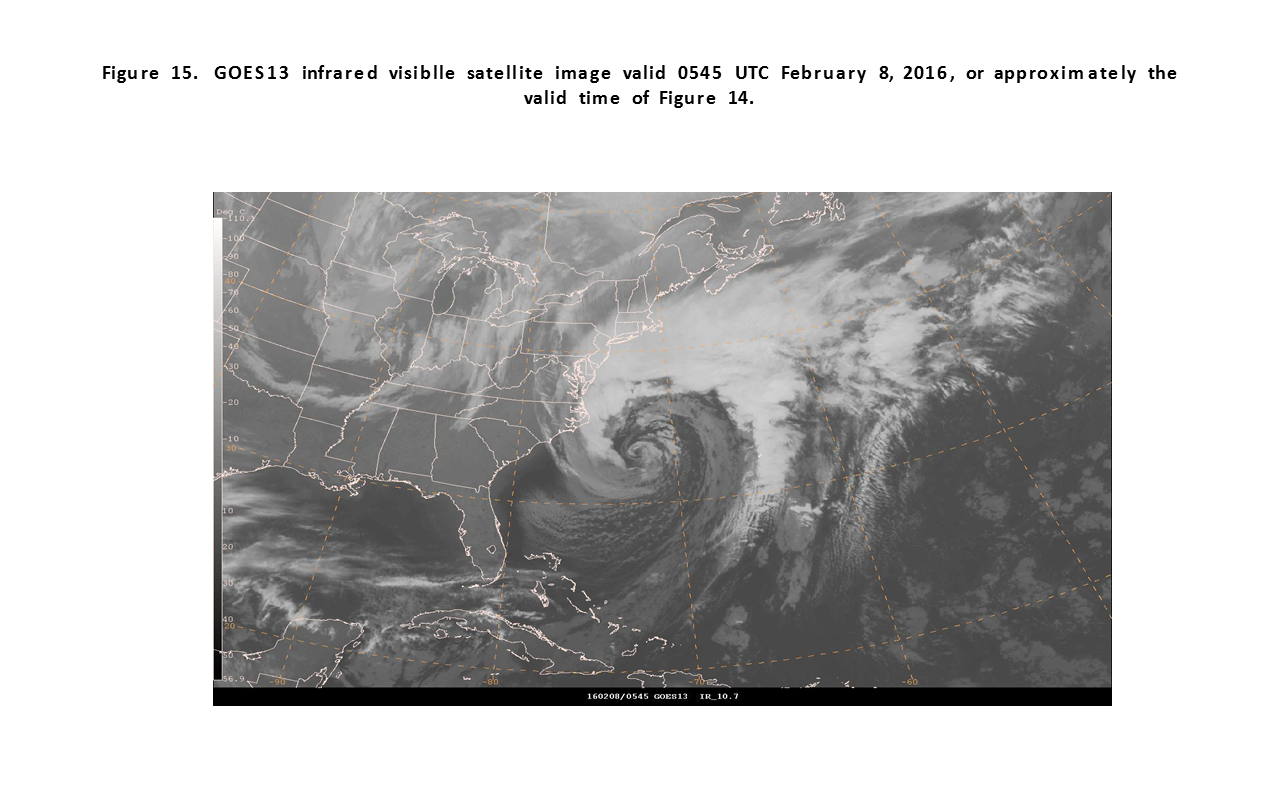
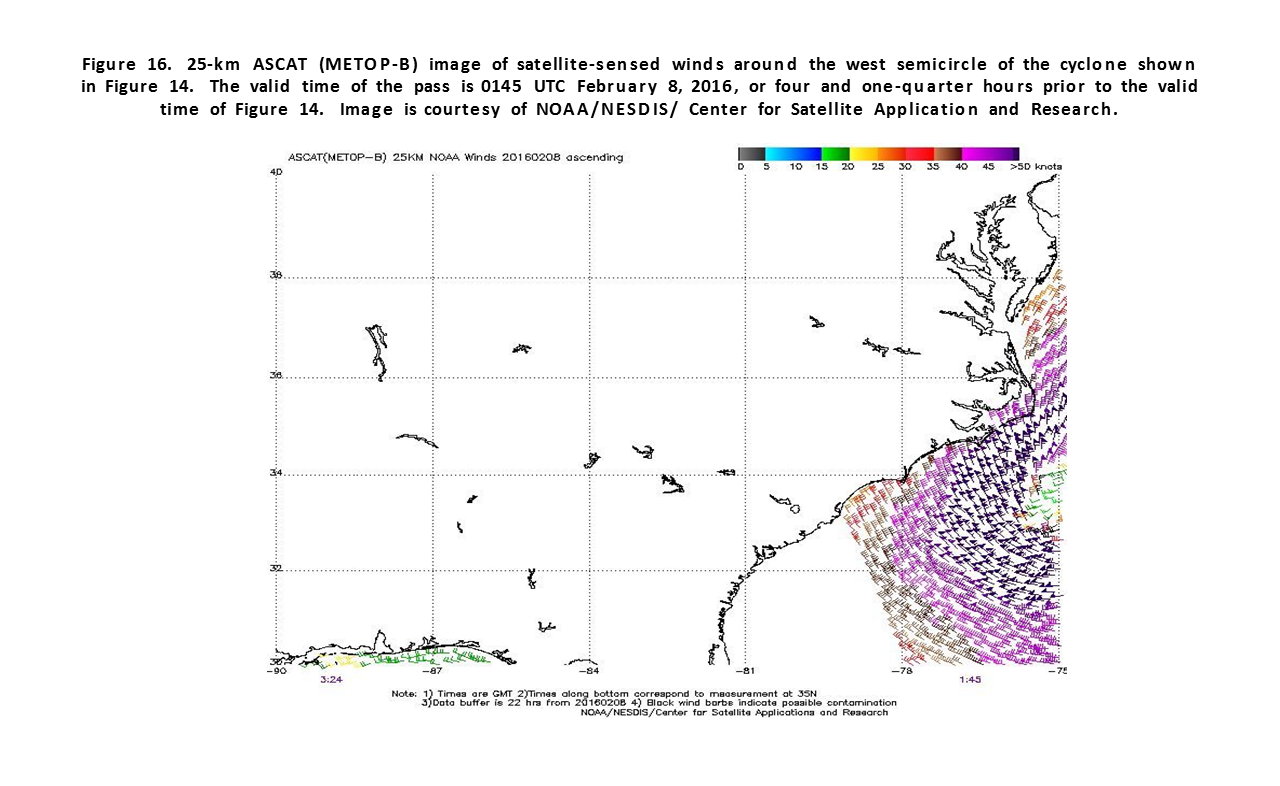
Southwestern North Atlantic Storm, February 6-10: Figure 13 and Figure 14 depict the rapid development of this storm over a 24 hour period. The central pressure fell 31 hPa in the 24 hour period ending at 1200 UTC on the 8th, when the cyclone developed its lowest central pressure of 974 hPa, quite intense for a low latitude development. Figure 15 is an infrared satellite image of the cyclone near maximum intensity with intense frontal bands and an eye like feature at the center. Buoy 41002 (31.9N 74.8W) reported west winds of 51 kts with gusts to 64 kts and 9.0 m seas (30 ft) at 0300 UTC on the 8th. Buoy 41001 (34.6N 72.7W) reported northwest winds of 47 kts with gusts to 66 kts at 1000 UTC on the 8th and seas 8.5 m (28 ft) one hour later. Another buoy, 41048 (31.9N 69.6W), reported southwest winds of 47 kts with gusts to 58 kts at 1000 UTC on the 8th and highest seas 12.0 m (40 ft) three hours later. The ASCAT-B image in Figure 16 shows wind retrievals of up to 65 kts in the west semicircle and possibly up to 70 kts. The cyclone then moved off to the northeast with its top winds weakening to storm force as it passed north of 40N, and then passed over Newfoundland late on the 9th.
Western Atlantic Storm, February 9-14: A new low formed on a front along the U.S. mid Atlantic coast early on the 9th and briefly developed hurricane force winds offshore near 38N 67W with a 990 hPa center at 1800 UTC on the 9th. A Rapidscat pass from 0355 UTC on the 10th revealed west to southwest winds of 50 to 60 kts south of the low center. The OLEANDER (V7SX3) near 33N 65W encountered west winds of 45 kts at 1600 UTC on the 9th. The cyclone then moved off to the northeast into the North Atlantic, where it stalled on the 13th and became absorbed the next day.
Northwestern Atlantic Storm, February 13-15: A new low formed on the southeast U.S. coast on the 12th and quickly developed storm force winds offshore the following night. The system passed over Newfoundland and into the Labrador Sea on the 14th. It approached the southern coast of Greenland the following night and briefly developed hurricane force winds with a 961 hPa pressure the following night, then rapidly weakened in the Davis Strait.
North Atlantic Storm, February 14-16: The next development consisted of a new low near Newfoundland late on the 14th moving into the north central waters and developing hurricane force winds and then with further intensification maintaining such conditions until passing north of the British Isles. An ASCAT-B pass from 1112 UTC on the 16th returned a swath of west to southwest winds 50 to 60 kts on the south side, with similarity to Figure 10 from an earlier event. The system then passed east of Iceland late on the 16th. Buoy 62105 (55.1N 12.8W) reported west winds of 34 kts with gusts to 48 kts at 1500 UTC on the 16th, a peak gust of 54 kts four hours prior, and highest seas 11.0 m (36 ft) at 2100 UTC on the 16th.
North Atlantic Storms, February 18-20: Similar to the February 9-14 event, a low moved off the southeast U.S. coast early on the 18th and briefly developed hurricane force winds near 38N 55W late on the 19th but the central pressure was only 1000 hPa. The system tracked east northeast and dissipated over the central waters on the 21st.
North Atlantic Storms, Greenland area, February 23-27: The first of two lows originating near the northeast U.S. coast moved northeast and briefly developed hurricane force winds near Greenland with a 982 hPa center at 0600 UTC on the 26th before dissipating east of Greenland on the 26th. A second low followed a similar track but was deeper, more like the February 13-15 event with the cyclone turning north into the Davis Strait. It developed hurricane force winds with a 964 hPa central pressure near 60N 57W late on the 26th. An ASCAT pass with limited coverage revealed an area of east to southeast winds 50 to 60 kts off the southwest Greenland coast at 2225 UTC on the 26th. The system weakened in the Davis Strait shortly thereafter.
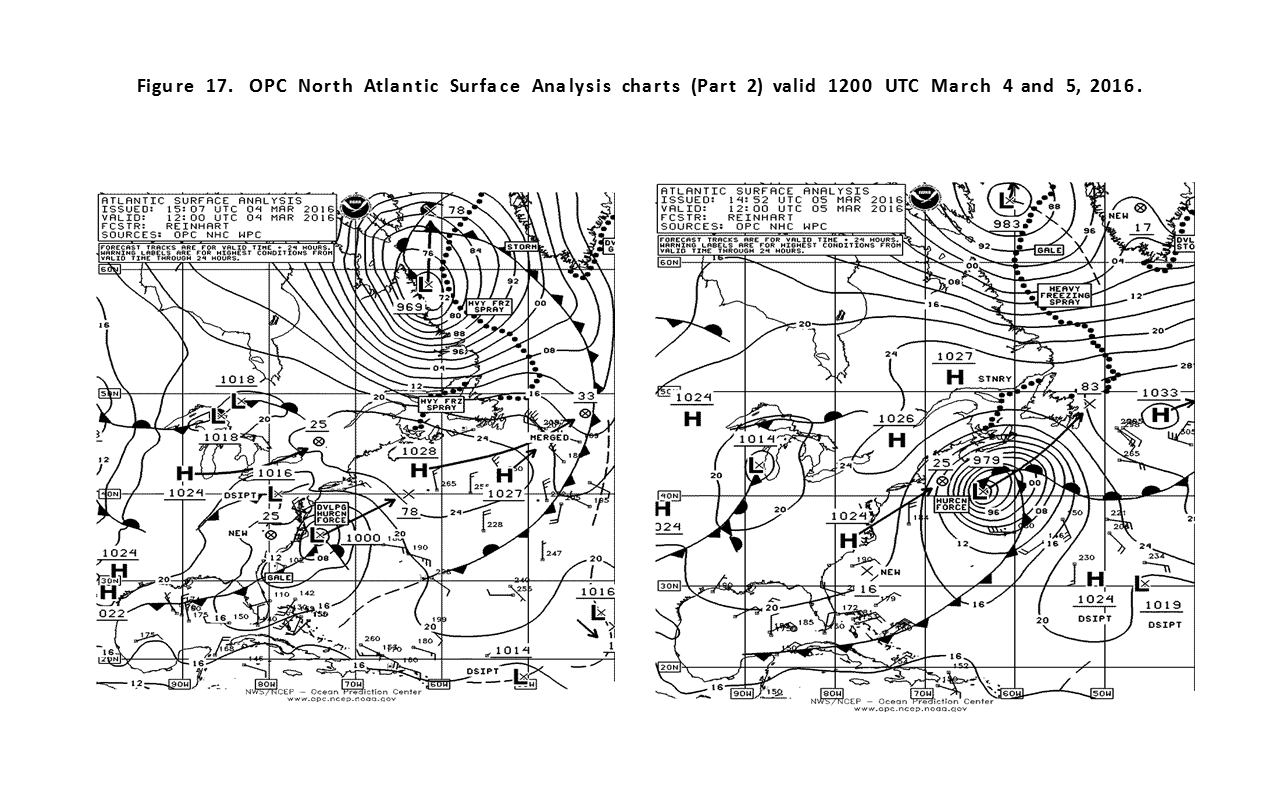
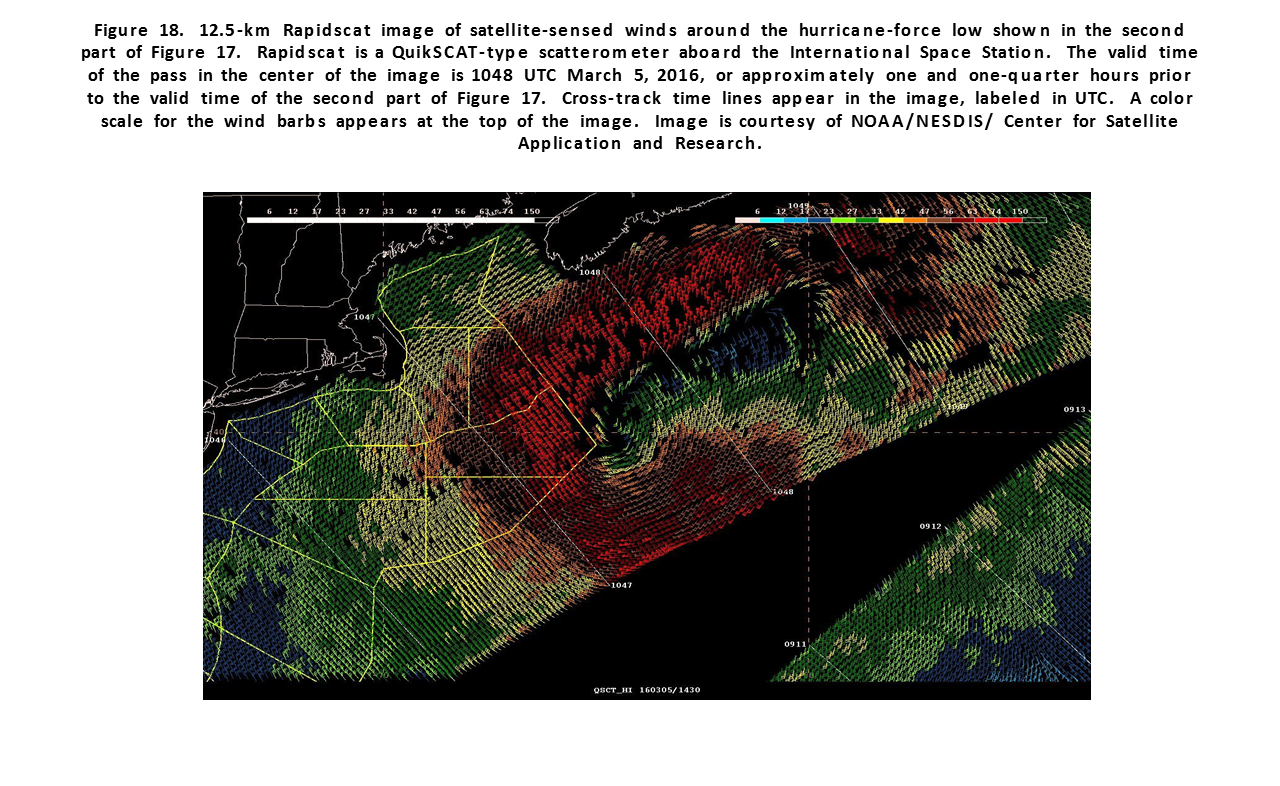
North Atlantic Storm, March 4-8: Figure 17 depicts the initial rapid development of this cyclone over the southwestern waters, with the central pressure falling 27 hPa in the 24 hour period ending at 0600 UTC March 5th. The Rapidscat image in Figure 18 reveals hurricane force winds up to 80 kts around the south, west and north sides, although some of the reports are rain flagged and may be questionable. Buoy 44137 (42.3N 62.0W) reported north winds of 49 kts with gusts to 62 kts at 1800 UTC on the 5th and highest seas 9.5 m (31 ft) one hour later. The platforms THEBAUD (CFO383, 43.9N 60.2W) and CFL24 (43.8N 60.6W) reported north to northwest winds of 61 kts with gusts to 77 kts at 2200 UTC on the 5th, with the latter site reporting 7.5 m seas (25 ft) six hours prior. The cyclone then moved off to the northeast past Newfoundland on the 6th as a storm force low with the lowest central pressure 970 hPa occurring as the storm passed between Greenland and Iceland late on the 7th.
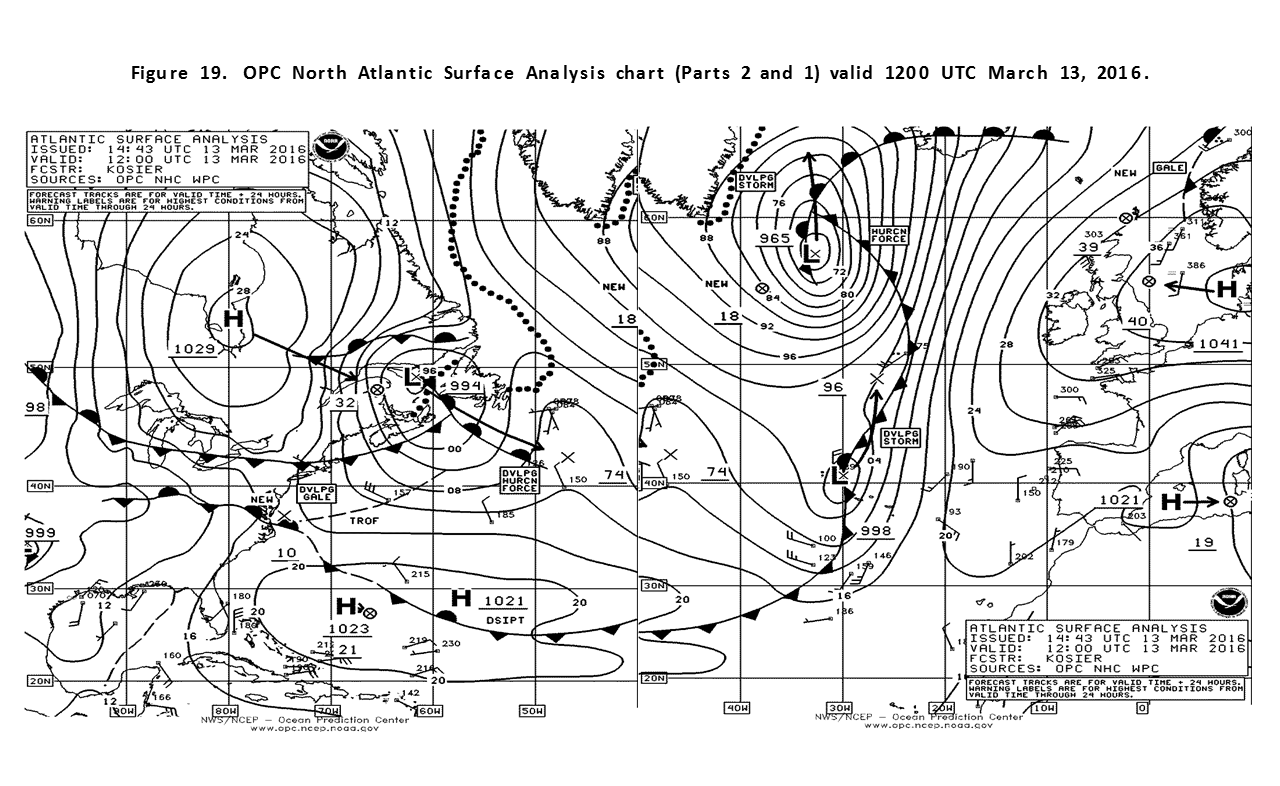
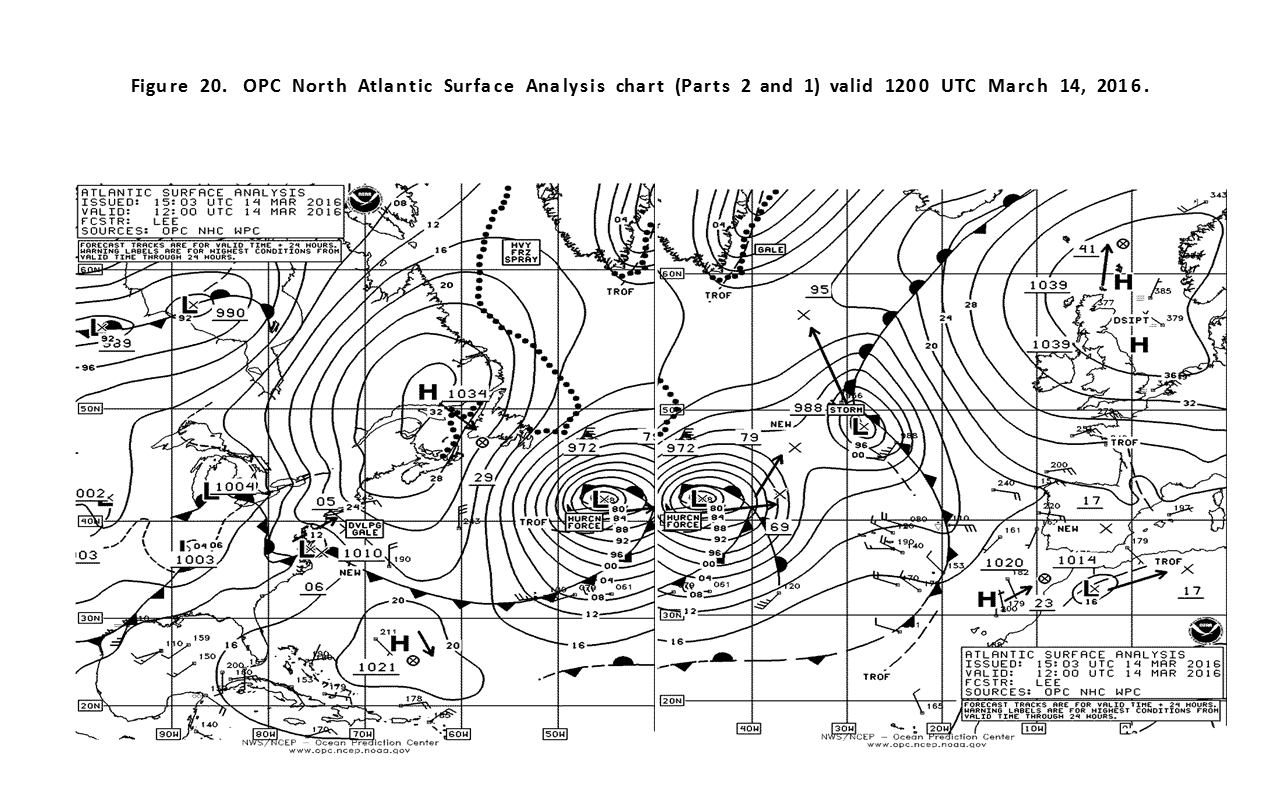
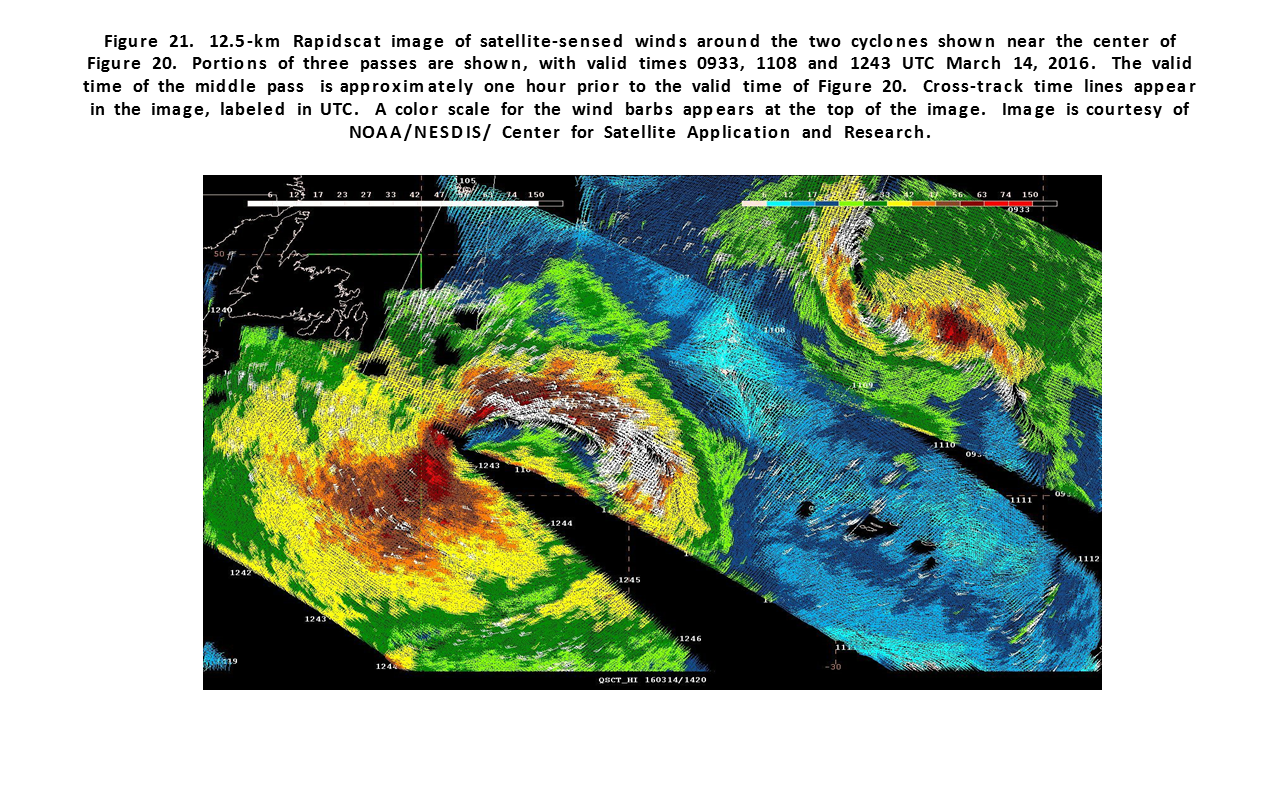
Northeast Atlantic Storm, March 11-16: The early to middle part of March continued to be active, with three hurricane force lows developing over a period of several days. The first one originated near Newfoundland early on the 10th and moved northeast, developing storm force winds while passing east of Greenland late on the 11th and briefly hurricane force winds 1200 UTC on the 12th in the Denmark Strait before weakening rapidly. A second cyclone moved east off the New England coast as a gale early on the 11th and developed hurricane force winds over the central waters on the 12th and early on the 13th while turning north with a lowest central pressure of 960 hPa. Figure 19 shows this system as it approached the east Greenland waters and began to weaken. The next two systems developed about at the same time south of 50N as shown in Figure 19 and Figure 20. The stronger of these developed hurricane force winds southeast of Newfoundland while the weaker low moved north along 30W as a developing frontal wave and is shown as a storm force low in Figure 20. Figure 21 is a Rapidscat image of the two systems with the larger cyclone showing a larger area of hurricane force winds on the south side with white barbs indicating possible rain contamination and even the smaller cyclone to the northeast revealing a small area of 65 kts on the east side around 0935 UTC on the 14th. Both cyclones then moved north with a weakening trend. MAERSK PALERMO (PDHW) near 41N 47W reported west winds of 50 kts and 5.0 m seas (16 ft) at 1200 UTC on the 14th. KUALA LUMPUR EXPRESS (DFNB2) near 46N 31W encountered east winds of 45 kts and 7.9 m seas (26 ft) at 0900 UTC on the 15th.
North Atlantic Storm, March 21-25: A cyclone similar to the one in early April in the northwestern waters originated near the southeast U.S. coast early on the 20th and developed hurricane force winds and a lowest central pressure of 948 hPa in the Labrador Sea by 0000 UTC on the 23rd, making it one of the deepest lows of the period. The central pressure fell 36 hPa in the 24 hour period ending at that time. The ship BATEU08 (59N 47W) reported southeast winds of 67 kts at 0200 UTC on the 23rd. The system stalled in that area before moving east and weakening late on the 23rd.
Northwestern Atlantic Storm Greenland area, March 28-April 2: A second cyclone following a similar track originated near the North Carolina coast on the 27th and moved into the waters south of Greenland with a central pressure as low as 964 hPa early on the 31st with a brief period of hurricane force winds. The MARY ARCTICA (BATEU00) near 58N 45W encountered north winds of 71 kts at 0500 UTC on the 31st. The cyclone then weakened in the east Greenland waters in early April.
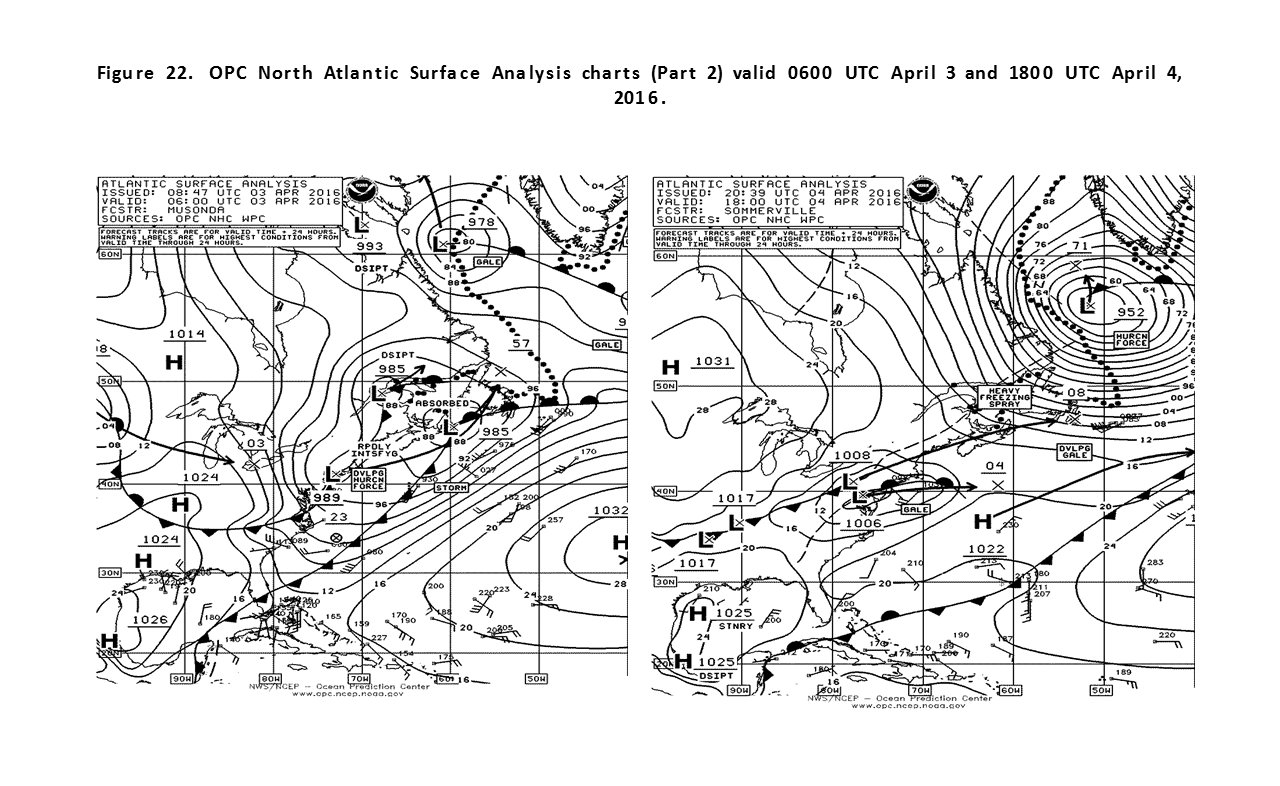
Northwestern Atlantic Storm, April 3-5: This cyclone quickly developed hurricane force winds while moving off the New England coast early on April 3rd (Figure 22) and maintained its winds through 1800 UTC on the 4th, when it developed a lowest central pressure of 952 hPa. The platform CFL24 (43.8N 60.6W) reported northwest winds of 68 kts at 0100 UTC on the 4th and two hours later seas of 6.0 m (20 ft). Buoy 44141 (43.0N 58.0W) reported west winds 54 kts with gusts to 68 kts at 0100 UTC on the 4th one hour later seas of 12.5 m (41 ft). The cyclone then stalled and weakened west of southern Greenland from late on the 5th through the 7th.
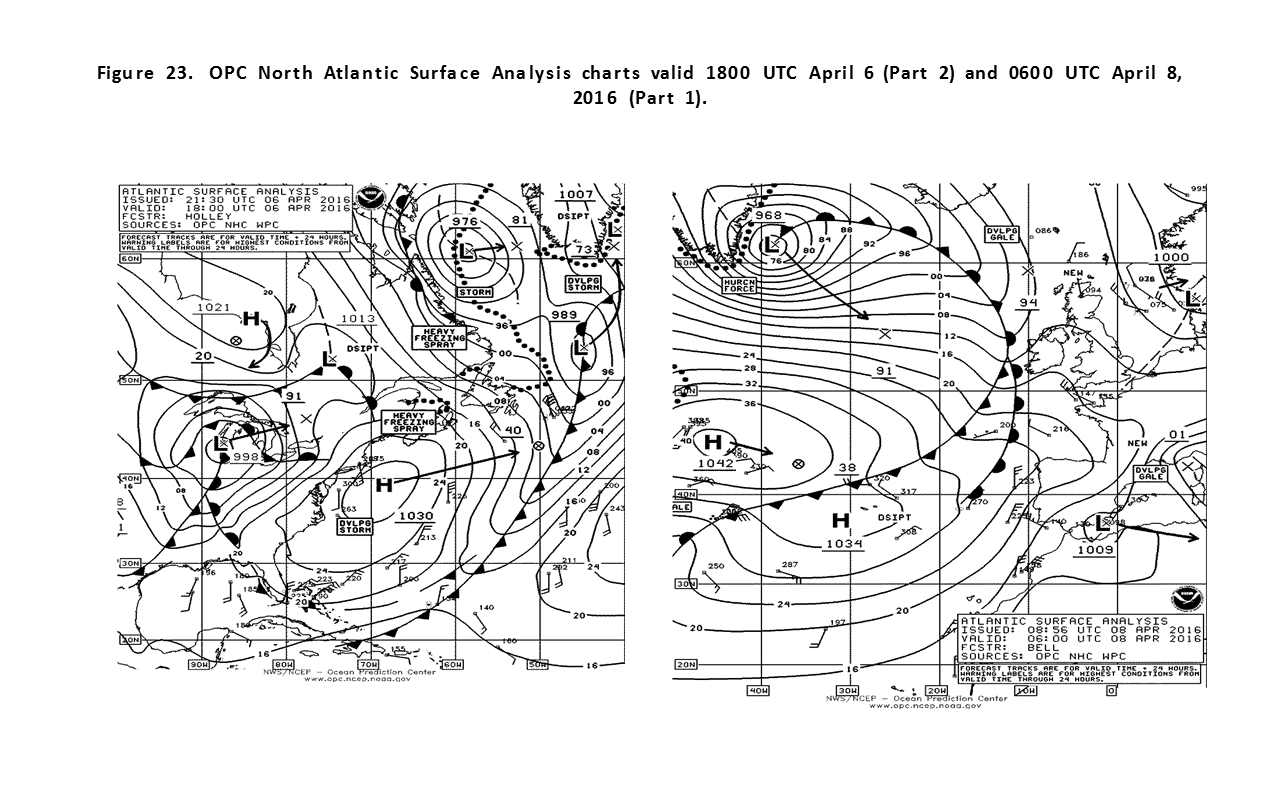
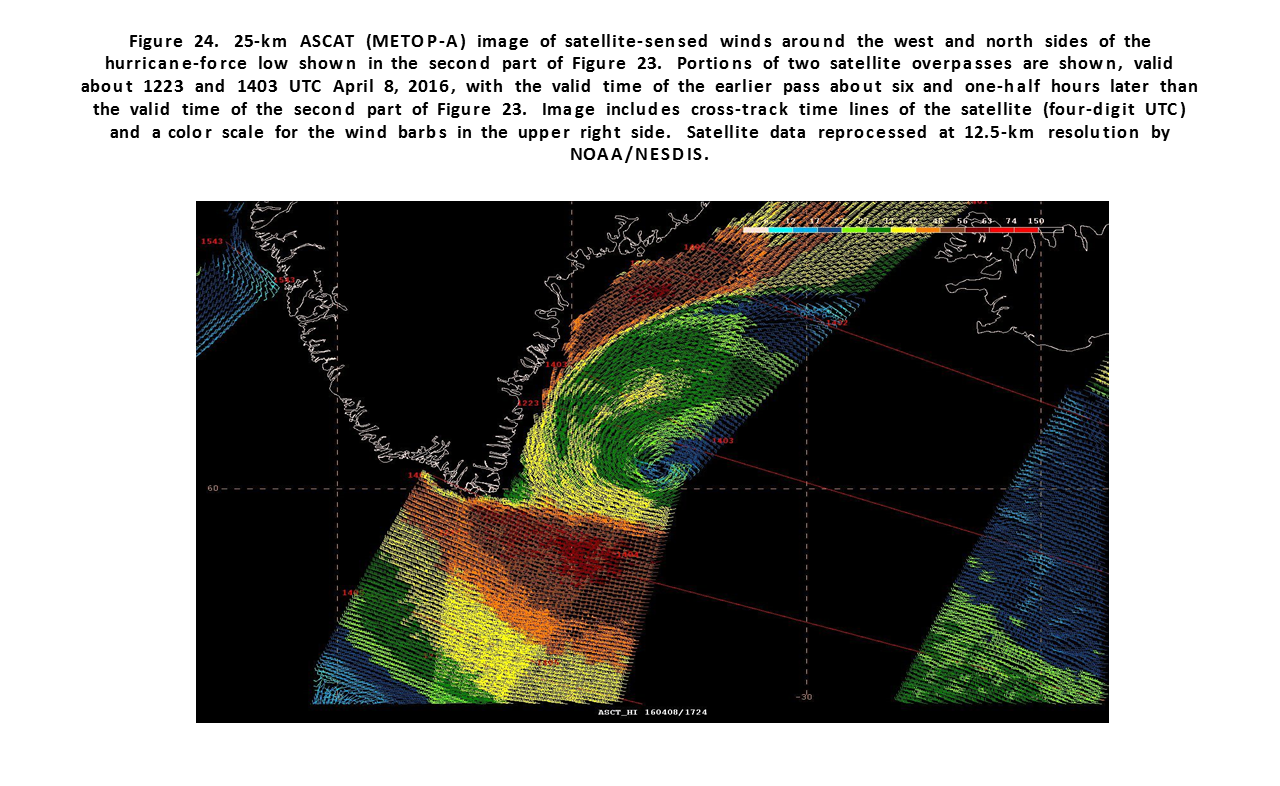
North Atlantic Storm Greenland area, April 7-10: Figure 23 depicts the final 36 hour period of development of this system, as a developing frontal wave off southern Labrador absorbed two other lows north of 60N with the second part of Figure 23 showing the cyclone at maximum intensity. Figure 24 is an ASCAT image showing the strongest winds southeast of the southern tip of Greenland and also channeled northeast winds between the occluded front and the coast of Greenland. An altimeter passes through the area of strongest winds southeast of Greenland revealed wave heights approaching 49 ft (14.9 m). The cyclone subsequently moved southeast and weakened, with its top winds weakening to gale force on the 11th.
References
1. Sanders, Frederick and Gyakum, John R., Synoptic-Dynamic Climatology of the "Bomb", Monthly Weather Review, October 1980.
2. Ocean Surface Winds, http://manati.star.nesdis.noaa.gov/products.php
3. VonAhn, Joan. and Sienkiewicz, Joe, "Hurricane Force Extratropical Cyclones Observed Using QuikSCAT Near Real Time Winds", Mariners Weather Log, Vol. 49, No. 1, April 2005.
4. Saffir-Simpson Scale of Hurricane Intensity: http://www.nhc.noaa.gov/aboutsshws.php
5. Tropical Cyclone Reports, 2015, National Hurricane Center, http://www.nhc.noaa.gov/archive/2016/al012016.discus.001.shtml
6. Bancroft, G., "Marine Weather Summary, North Pacific and North Atlantic Areas", Mariners Weather Log, August 2016.
7. Shapiro,M. A. and D. Keyser, 1990: Fronts, Jet Streams and the Tropopause. Extratropical Cyclones, The Erik Palmen Memorial Volume, C.W. Newton and E.O. Holopainen, Eds, Amer.Meteor. Soc., 167-191.